We’ve already analyzed tens of thousands of financial research papers and identified more than 700 attractive trading systems together with hundreds of related academic papers.
Browse Strategies- Unlocked Screener & 300+ Advanced Charts
- 700+ uncommon trading strategy ideas
- New strategies on a bi-weekly basis
- 2000+ links to academic research papers
- 500+ out-of-sample backtests
- Design multi-factor multi-asset portfolios
Upgrade subscription
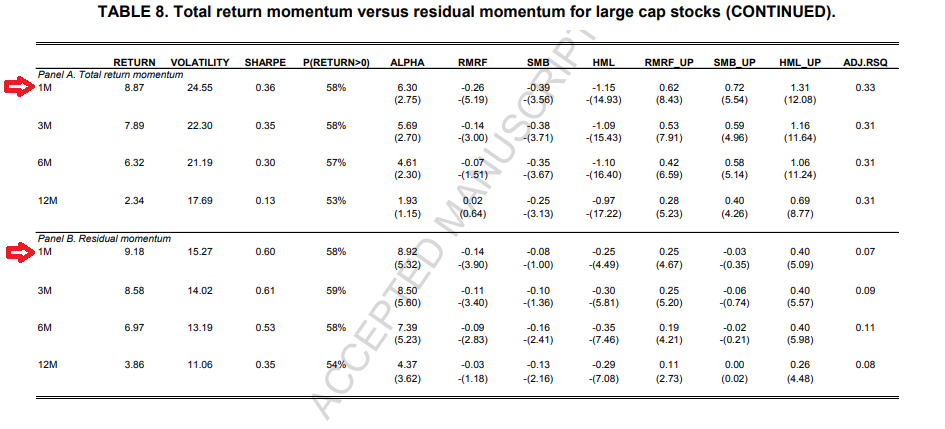
Conventional momentum is a very well known anomaly; therefore, it is scrutinizingly studied. This strategy has been academically confirmed many times, but a lot of researchers have documented several momentum drawbacks. One important characteristic is that traditional momentum has substantial time-varying exposures to the classical Fama and French factors. Academic research shows that momentum loads positively (negatively) on systematic factors when these factors have positive (negative) returns during the formation period of the momentum strategy. As a consequence, a conventional total return momentum strategy experiences losses when the sign of the factor returns over the holding period is opposite to the sign over the formation period. One example is that negative market returns in the credit crises of 2008 caused the total return momentum to be tilted towards the low-beta segment of the market in early 2009. When the market recovered in the first quarter of 2009, the total return momentum’s negative market beta caused large losses. Luckily, the same academic research offers a solution. A residual momentum strategy based on residual returns estimated using the Fama and French three-factor model offers smaller time-varying factor exposures (which reduces the volatility of the strategy). It has a higher long-run average Sharpe ratio. A higher strategy consistency, large-cap investment universe, and a lower concentration in the extremes of the cross-section of stocks is an added bonus.
* For those interested in systematic quantitative momentum factor ETF implementation, here is a link to the Alpha Architect Quantitative Momentum ETF (strategy background), our partner. *
Fundamental reason
As it is mentioned in the “Description”, a residual momentum strategy uses the Fama and French three-factor model to remove the classical momentum strategy’s dependence on systematic factors. The residual momentum is closer to being factor neutral than total return momentum, which adds a lot of benefits.
- Unlocked Screener & 300+ Advanced Charts
- 700+ uncommon trading strategy ideas
- New strategies on a bi-weekly basis
- 2000+ links to academic research papers
- 500+ out-of-sample backtests
- Design multi-factor multi-asset portfolios
Backtest period from source paper
1926-2009
Confidence in anomaly's validity
Strong
Indicative Performance
9.18%
Notes to Confidence in Anomaly's Validity
Notes to Indicative Performance
per annum, data from table 8 for 12-1M residual momentum
Period of Rebalancing
Monthly
Estimated Volatility
15.27%
Notes to Period of Rebalancing
Notes to Estimated Volatility
data from table 8 for 12-1M residual momentum
Number of Traded Instruments
200
Notes to Number of Traded Instruments
Estimated number of stocks in portfolio. We estimate that ~1000 stocks fulfill all criteria. Investor uses 2 deciles for investment.
Notes to Maximum drawdown
Complexity Evaluation
Complex strategy
Notes to Complexity Evaluation
Financial instruments
stocks
Simple trading strategy
The investment universe consists of all domestic, primary stocks listed on the New York (NYSE), American (AMEX), and NASDAQ stock markets with a price higher than $1. Closed-end funds, REITs, unit trusts, ADRs, and foreign stocks are removed. The 10% largest stocks in terms of market capitalization are then selected for trading.
The residual momentum strategy is defined as a zero-investment top-minus-bottom decile portfolio based on ranking stocks every month on their past 12-month residual returns, excluding the most recent month, standardized by the standard deviation of the residual returns over the same period. Residual returns are estimated each month for all stocks over the past 36 months using a regression model. The regression model is calculated every month for all eligible stocks using the Fama and French three factors as independent variables. The portfolio is equally weighted and rebalanced monthly.
Hedge for stocks during bear markets
Yes - Based on the source research paper (see Table 4), the strategy has a positive return during recession months (as defined by NBER); therefore, it probably can be used as a hedge/diversification to equity market risk factor during bear markets.
Out-of-sample strategy's implementation/validation in QuantConnect's framework
(chart+statistics+code)