We’ve already analyzed tens of thousands of financial research papers and identified more than 700 attractive trading systems together with hundreds of related academic papers.
Browse Strategies- Unlocked Screener & 300+ Advanced Charts
- 700+ uncommon trading strategy ideas
- New strategies on a bi-weekly basis
- 2000+ links to academic research papers
- 500+ out-of-sample backtests
- Design multi-factor multi-asset portfolios
Upgrade subscription
Momentum is a simple well-known trading strategy that buys stocks with the best returns over the past three to 12 months and sells stocks with the worst returns over the same horizon. Many tweaks to the basic momentum strategy have been published in academic papers.
Momentum combined with a volatility effect is one such useful trick as research shows that momentum returns could be enhanced by using the most volatile stocks. An additional advantage of this approach is that it works very well within large-cap stocks (it is well-known that momentum works better in a small-cap universe; therefore, any trick which works within large caps is helpful).
* Are you interested in systematic quantitative factor ETFs? Here is a link to the Alpha Architect Value Momentum Trend ETF (strategy background), our partner, which combines international equities’ value, momentum, and trend factors. *
Fundamental reason
Academic research postulates that the medium-term momentum is rationalized largely along the behavioral avenue. Gradual information diffusion and/or investor under-reaction leads to momentum (Chan, Jegadeesh and Lakonishok, 1996; and Hong, Lim and Stein, 2000). Some researchers show that information uncertainty can intensify return continuations under the postulation that investors under-react more (due to overconfidence) when presented with vague information. Following this line of thinking, investors should see stronger momentum in securities with greater information uncertainty, such as in smaller stocks and stocks with higher volatility.
- Unlocked Screener & 300+ Advanced Charts
- 700+ uncommon trading strategy ideas
- New strategies on a bi-weekly basis
- 2000+ links to academic research papers
- 500+ out-of-sample backtests
- Design multi-factor multi-asset portfolios
Backtest period from source paper
1964-2009
Confidence in anomaly's validity
Strong
Indicative Performance
16.46%
Notes to Confidence in Anomaly's Validity
Notes to Indicative Performance
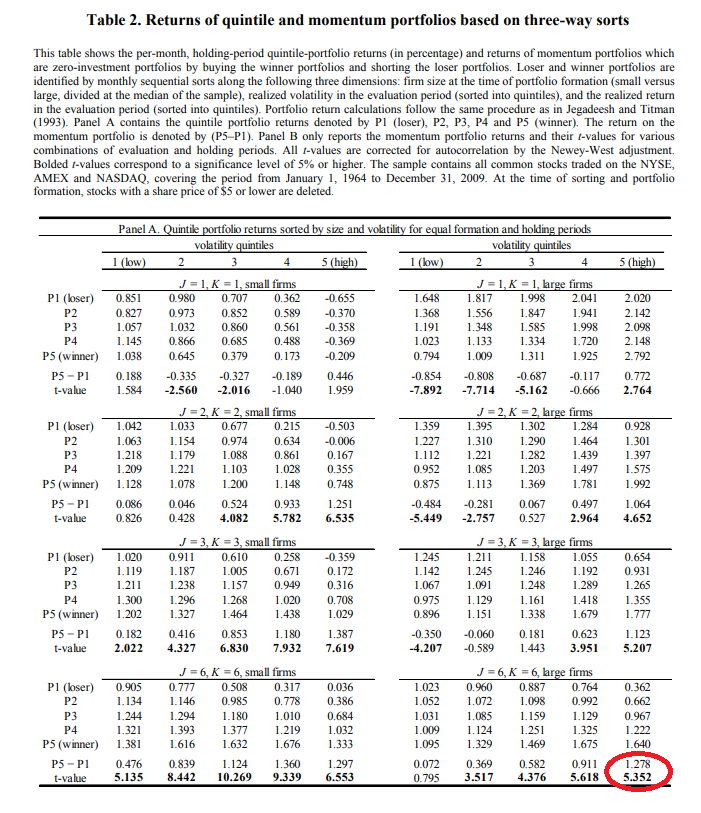
per annum, annualized (geometrically) monthly return 1.278% for long short portfolio, data from table 2 for large firms with high volatility for 6-month ranking and 6-month holding period
Period of Rebalancing
Monthly
Estimated Volatility
19.22%
Notes to Period of Rebalancing
Notes to Estimated Volatility
estimated from t-statistic 5.352 from table 2
Number of Traded Instruments
1000
Notes to Number of Traded Instruments
more or less, it depends on investor’s need for diversification
Notes to Maximum drawdown
Complexity Evaluation
Complex strategy
Notes to Complexity Evaluation
Financial instruments
stocks
Simple trading strategy
The investment universe consists of NYSE, AMEX, and NASDAQ stocks with prices higher than $5 per share. At the beginning of each month, the sample is divided into equal halves, at the size median, and only larger stocks are used. Then each month, realized returns and realized (annualized) volatilities are calculated for each stock for the past six months. One week (seven calendar days) prior to the beginning of each month is skipped to avoid biases due to microstructures. Stocks are then sorted into quintiles based on their realized past returns and past volatility. The investor goes long on stocks from the highest performing quintile from the highest volatility group and short on stocks from the lowest-performing quintile from the highest volatility group. Stocks are equally weighted and held for six months (therefore, 1/6 of the portfolio is rebalanced every month).
Hedge for stocks during bear markets
Not known - Source and related research papers don’t offer insight into the correlation structure of the proposed trading strategy to equity market risk; therefore, we do not know if this strategy can be used as a hedge/diversification during the time of market crisis. The strategy is built as a long-short, but it can be split into two parts. The long leg of the strategy is surely strongly correlated to the equity market; however, the short-only leg might be used as a hedge during bad times. Rigorous backtest is, however, needed to determine return/risk characteristics and correlation.
Out-of-sample strategy's implementation/validation in QuantConnect's framework
(chart+statistics+code)