Analysis of Asymmetrical Moving Average for Buy/Sell Signals
Nice academic paper related to trend-following strategies:
Authors: Chu
Title: Asymmetry between Uptrend and Downtrend Identification: A Tale of Moving Average Trading Strategy
Link: https://papers.ssrn.com/sol3/papers.cfm?abstract_id=2903855
Abstract:
Most market participants are risk adverse and people tend to close their long positions once they perceive a formation of downturn in the market. Large sudden price drops can always be observed near the end of uptrends. On the other hand, people tend to have their own preferences in deciding the market entrance timings and large sudden price changes are relatively less commonly observed near the end of downtrends. Typical Moving Average strategies employ the same approach, using a single pair of time series, to locate the ending points of uptrends and downtrends. This approach does not consider the asymmetry of price changes near the end of uptrend and downtrend distinctively. To cater for the differences, a new approach using distinct pairs of time series for locating uptrends and downtrends is proposed. Performance of the proposed strategy is evaluated using stock market index series from 8 different developed countries including US, UK, Australia, Germany, Canada, Japan, Hong Kong and Singapore under 3 moving average calculation methods. The empirical results indicate that the proposed strategy outperforms the typical strategy and the buy-and-hold strategy. Recommended heuristics for selecting an appropriate MA length will also be addressed in this study.
Notable quotations from the academic research paper:
"This paper addresses the issue of asymmetrical information content observed in uptrend and downtrend patterns which is caused by investors’ risk aversion preference. The existence of the asymmetrical information content indirectly supports the use of distinct ways to identify uptrends and downtrends separately.
To illustrate the effect of using various MA lengths for locating the ending time points of uptrends, we fix the MA length for generating buy-signals ( pl ) and adjust the length for generating sell-signal ( ql ) iteratively. The average return of Long positions identified by strategies using ql from 5 to 200 pairing with 4 fixed values of pl are computed. The results are depicted in Figure 1.
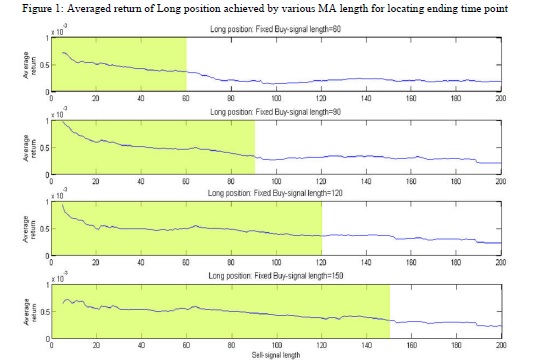
There are four sub-plots in Figure 1 and each plot represents the average return achieved by a fixed pl and varying ql. The four plots depict the performance of fixed buy-signal length of 60, 90, 120 and 150 respectively. The highlighted area on the left side shows the performance of using a shorter length to locate the ending time points (i.e. ql < pl ). The performance of the typical symmetric approach can be found on the boundary of highlighted area where ql = pl .
It is observed that shorter lengths for locating the ending time points are always more preferable than longer lengths in all four settings. A short length for generating sell-signals (i.e. ql = 5 to 7) always gives the best performance under various settings for generating buy-signals, in additional to the illustrated lengths of 60, 90, 120 and 150. Preference to shorter lengths for generating sell-signals is also observed in other data sets and different MA trading strategies as well. The empirical results support our speculation that a more responsive way (i.e. small ql ) should be used to locate the ending time points of uptrends.
A new Moving Average trading strategy is proposed to model the ending time points of uptrends and downtrends under an asymmetrical setting. The results show that a more responsive way (i.e. using a shorter MA length) to locate the ending time points of uptrends always helps to achieve a better average return. Based on our empirical data, a short MA length (i.e. 5-7) for generating sell-signals always gives good performance in uptrend identification. About downtrend identification, however, not any consistent clues in selecting appropriate MA lengths can be found. Moreover, it is shown that the asymmetric approach provides much larger improvement on uptrend identification than downtrend identification in general."
Are you looking for more strategies to read about? Check http://quantpedia.com/Screener
Do you want to see performance of trading systems we described? Check http://quantpedia.com/Chart/Performance
Do you want to know more about us? Check http://quantpedia.com/Home/About
Share onLinkedInTwitterFacebookRefer to a friend