Equity Factors in Emerging Markets
A new financial research paper has been published and is related to multiple equity factor strategies:
Author: Atilgan, Demirtas, Gunaydin
Title: The Cross-Section of Equity Returns in Emerging Markets
Link: https://papers.ssrn.com/sol3/papers.cfm?abstract_id=3225034
Abstract:
This study investigates the relation between a comprehensive set of firm-specific attributes and future equity returns for a sample of stocks from 27 emerging markets. Univariate analyses based on equal-weighted portfolio returns reveal that the low beta, firm size, book-to-market ratio, momentum and illiquidity anomalies are also observed in emerging markets whereas short-term reversal, left-tail risk and lottery demand effects manifest themselves in the opposite direction compared to U.S. studies. Value-weighted portfolio returns and bivariate analyses that control for firm size show that some of these results are driven by small stocks. After we control for all attributes simultaneously in a regression framework, we find that the most robust cross-sectional effects for emerging market equities are medium and short-term return momentum.
Notable quotations from the academic research paper:
"Although there is no shortage of research on the cross-section of equity returns in emerging markets, these studies are restricted in the sense that they only focus on a limited number of potential determinants of expected returns and/or they only conduct their analyses in a single country or a small group of countries. Our contribution is that we compile a large set of firm-specific attributes that can potentially impact equity returns and use a comprehensive sample of stocks from 27 emerging markets. Thus, we are able to investigate the independent information that a particular firm-specific attribute provides compared to other attributes and observe the generalizability of our results across all emerging markets. We should also note that we undertake a more modest task in this study by focusing on the potential return determinants that can be extracted from the empirical return distribution of individual equity returns. The U.S. literature also suggests various accounting-based variables as cross-sectional return determinants, however, accounting information is sparse for emerging markets and not easily comparable across countries in a large sample due to differences in accounting practices. The only exception we make is for book-to-market ratio of equity since this variable is included in all contemporary asset pricing models and book value of equity is relatively more available compared to other accounting variables for emerging markets.
To investigate the relation between each firm-specific attribute and expected stock returns, we conduct discrete univariate portfolio analyses by sorting stocks into deciles based on one firm-specific characteristic at a time. Next, we compare the one-month ahead returns of the portfolio that includes equities with the highest values of a firm-specific attribute and the portfolio that includes equities with the lowest values of a firm-specific attribute. For example, if the firm-specific characteristic under focus is market beta, Portfolio 10 contains the stocks with the highest sensitivity towards market movements and Portfolio 1 contains the stocks with the lowest sensitivity towards market movements. The decile portfolios are formed every month starting from January 1989 to December 2014. The main portfolio analysis used in this study combines all equities in the sample, therefore, stocks in each decile come from a multitude of countries.
Firm size is an important mediating variable in cross-sectional studies of equity returns. Many anomalies are driven by smaller stocks implying that some significant relations between firm characteristics and expected returns that manifest themselves in the full sample of equities may not be observed when one focuses solely on large stocks. We employ conditional (dependent) double sorts on firm size and various firm-specific attributes by grouping equities into deciles based on firm size and then into additional deciles based on a certain firm-specific attribute within each size decile. For each firm-specific attribute, this bivariate analysis provides 100 conditionally double-sorted portfolios. Portfolio 1 represents the combined portfolio of stocks with the lowest values of a firm-specific attribute in each size decile and Portfolio 10 represents the combined portfolio of stocks with the highest values of a firm-specific attribute in each size decile. We investigate whether the mean return or alpha differences between two extreme firm-specific attribute deciles is significantly different from zero. This type of analysis can also reveal whether the existence or non-existence of a relation between a certain attribute and expected returns is driven or masked by a significant correlation between the attribute and firm size.
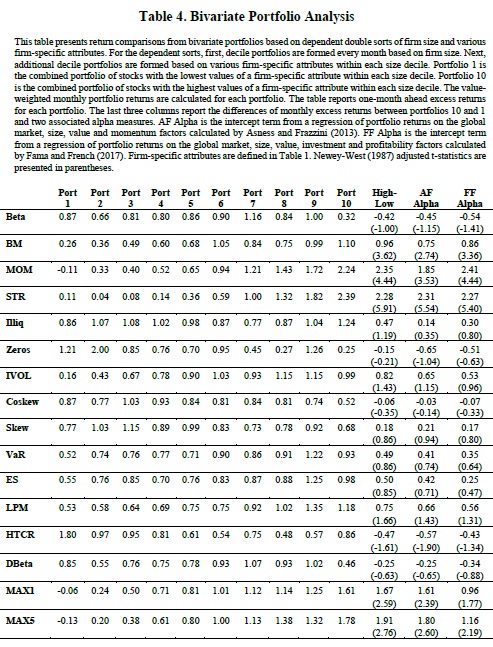
We find that the return pattern across the market beta deciles is relatively flat, however, the decile returns drop from 1.00% to 0.32% between Portfolio 9 and 10. Despite this sharp drop, the return and alphas to the zero-cost portfolio constructed based on market beta are insignificant. The book-to-market and momentum anomalies survive after controlling for firm size using bivariate sorts. The return and alphas to the zero-cost strategy based on BM are between 75 and 96 basis points with t-statistics of between 2.74 and 3.62. The zero-cost strategy based on momentum reveals even higher returns and alphas with values between 1.85% and 2.41% and t-statistics between 3.53 and 4.44. The short-term reversal strategy still translates as short-term momentum to the emerging market setting. The return difference between the extreme one-month-lagged return deciles is 2.28% with a t-statistic of 5.91 and significantly positive alphas.
The conflicting evidence regarding the illiquidity premium that was uncovered in the univariate analyses is absent when firm size is kept stable across the Amihud’s illiquidity ratio and Zeros deciles. None of the return or alpha measures based on these two metrics are statistically different than zero. We also had found no robust relation between attributes such as idiosyncratic volatility, co-skewness and skewness earlier and these results translate to the bivariate setting as well.
For the three stock-specific left-tail risk measures, we find that the return and alpha metrics for the zero-cost strategy are all positive but statistically insignificant with t-statistics between 0.47 and 1.66. For hybrid tail risk, we observe a generally decreasing pattern of returns across the deciles although the return increases from 57 to 86 basis points from Portfolio 9 to 10. Despite this increase, the returns and alphas to the zero-cost strategy are all negative and statistically insignificant except for AF alpha. Again, there is no relation between downside beta and expected equity returns. Finally, we observe that lottery-like stocks continue to demand higher one-month-ahead returns after the dependent sorts. The return and alpha measures for the zero-cost strategy based on MAX1 and MAX5 vary between 0.96% and 1.91% with t-statistics between 1.77 and 2.76.
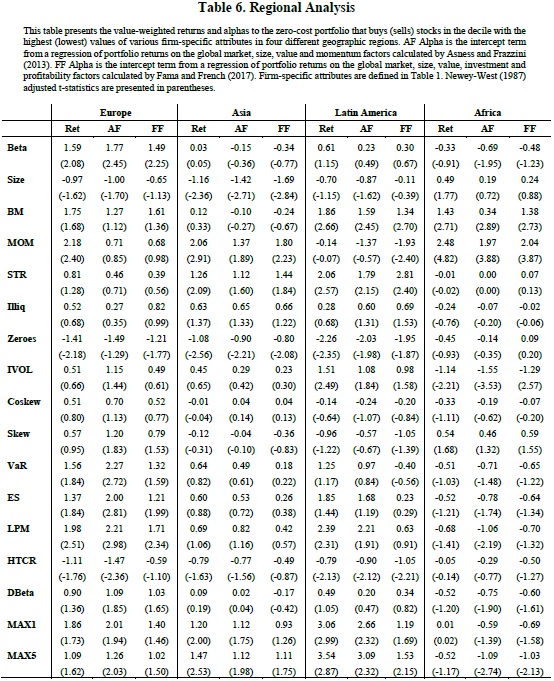
We observed that the firm size, book-to-market and momentum anomalies presented themselves significantly in the overall sample of emerging market equities. By looking at each region separately, we see that these significant relations generally do not show up uniformly in each region and the results encountered in the overall sample are driven by specific regions. For example, although the zero-cost portfolio formed by sorting stocks based on their market value of equity generates a significant return of -1.16% per month with a tstatistic of -2.36 in Asia, no such pattern exists for the other regions. The book-to-market effect seems to be driven by equities in the Latin America and Africa regions. The momentum effect is robust across Europe, Asia and Africa with statistically significant monthly zero-cost portfolio returns of 2.18%, 2.06% and 2.48%, respectively. Table 3 also revealed that the shortterm reversal and lottery demand anomalies produced returns with opposite signs to those expected from U.S. studies in the overall sample. We find that both results are driven mostly by Asian and Latin American countries. The zero-cost portfolio strategy based on STR produces returns of 1.26% and 2.06% with t-statistics of 2.09 and 2.57 in Asia and Latin America, respectively. The zero-cost portfolio strategy based on MAX1 produces returns of 1.20% and 3.06% with t-statistics of 2.00 and 2.99 in Asia and Latin America, respectively.
Although we did not find significant relations between the other firm-specific attributes and future equity returns in our overall emerging market sample, it is possible to observe some predictive power associated with these attributes when we focus on individual regions. First, we find a significantly positive relation between market beta and one-month-ahead equity returns in Europe with a return of 1.59% (t-statistic = 2.08) to the zero-cost portfolio and significant alphas. Second, we find that the illiquidity measure based on non-trading days has a significantly negative relation with one-month-ahead returns in all regions except Africa and IVOL has a significantly positive relation with one-month-ahead returns in Latin America. Third, zero-cost portfolio strategies based on all three stock-specific left-tail risk measures produce significantly positive returns and alphas between 1.21% and 2.27% in Europe. A similar relation is observed in Latin America when LPM is used as the stock-specific left-tail risk measure. Finally, we find that hybrid tail risk is negatively priced in Europe and Latin America.
These results speak to the importance of accounting for regional differences in the patterns pertaining to the cross-section of equity returns."
Are you looking for more strategies to read about? Check http://quantpedia.com/Screener
Do you want to see performance of trading systems we described? Check http://quantpedia.com/Chart/Performance
Do you want to know more about us? Check http://quantpedia.com/Home/About
Follow us on:
Facebook: https://www.facebook.com/quantpedia/
Twitter: https://twitter.com/quantpedia
Share onLinkedInTwitterFacebookRefer to a friend