Momentum and Reversal Combined with Volatility Effect in Stocks
Folks from Quantopian did a new independent analysis of a strategy we have in our database. An article is written by Jeremy Muhia and is focused on Momentum and Reversal Combined with Volatility Effect in Stocks (Strategy #155):
https://www.quantopian.com/posts/do-momentum-and-reversals-coexist
(click on a "View Notepad" button to see a longer analysis)
The original academic paper is written by Jason Wei of the University of Toronto. He proposes a theory that momentum and reversals coexist and that volatility is a strong predictor of performance in a cross-section for both anomalies. Wei's research is detailed in the paper titled “Do momentum and reversals coexist?” and states that rather than assuming momentum and reversals as separate phenomena, the two occur simultaneously. Further, Wei also studies return predictability along the volatility (and size) dimension. Wei’s research documents that for large-cap/ low-volatility stocks, reversals prevail while large-cap/high-volatility stocks experience momentum.
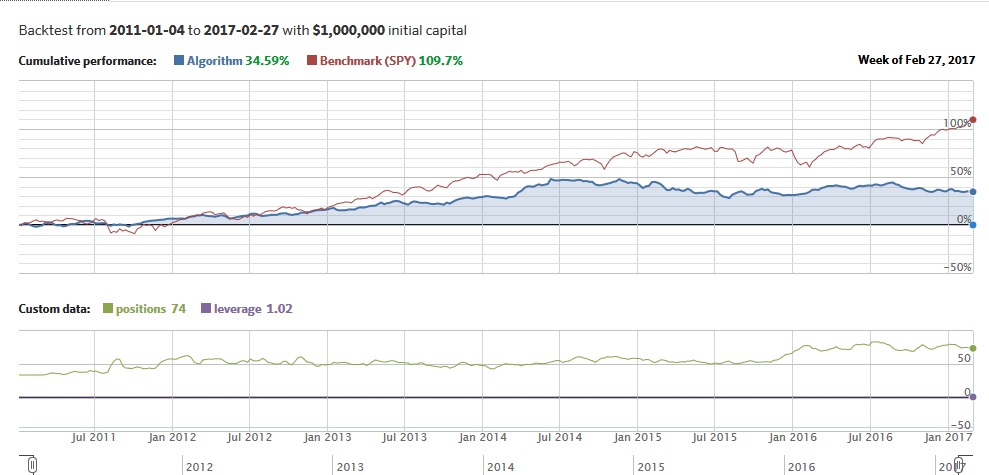
Jeremy Muhia from Quantopian performed an independent analysis of a resultant long-short strategy (investor goes long high volatility winners and goes short low volatility losers) during last 6 years (an out of sample period from 2011 until 2017). Overall, the performance of a simple long-short strategy is below the market and equity curve looks flat during last 2+years . But, it has to be noted (like in the previous analysed reversal strategy) that this strategy is long/short compared to just long-only equity benchmark (which is the SPY ETF). Strategy has a Sharpe ratio 0.66 (not very spectacular, but not very bad either) and Beta of 0.02 (low correlation to overall market).
So does it make sense to implement it? It depends. Flat equity curve during last 2-3 years can indicate strategy's deterioration. But we believe a longer backtest is probably necessary to have a better understanding. As such episodes of underperformance could be easily just a temporary and longer backtest can show how strategy performed during more business cycles. Overall, we really like Jason Wei's research idea of looking at several sorts/dimensions at the same time (past long/short performance+past volatility+company's size).
The final OOS equity curve:
Thanks for the analysis Jeremy.
You may also check 1st, 2nd, 3rd or 4th article of Quantpedia & Quantopian Trading Strategy Series if you liked the current article…
Share onLinkedInTwitterFacebookRefer to a friend