We’ve already analyzed tens of thousands of financial research papers and identified more than 700 attractive trading systems together with hundreds of related academic papers.
Browse Strategies- Unlocked Screener & 300+ Advanced Charts
- 700+ uncommon trading strategy ideas
- New strategies on a bi-weekly basis
- 2000+ links to academic research papers
- 500+ out-of-sample backtests
- Design multi-factor multi-asset portfolios
Upgrade subscription
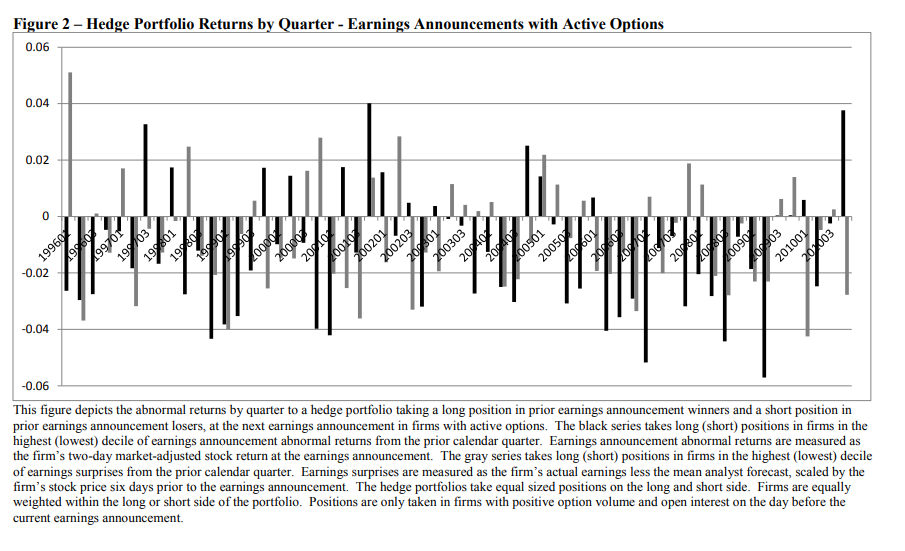
The post-earnings announcement drift (the tendency of stocks to drift in the direction of earnings announcement surprise during next quarter) is a well-known effect many times analyzed in academic literature. However, recent research speculates that maybe it is known too much.
Arbitrageurs started to exploit this anomaly, and it seems that the effect reversed in most liquid stocks. Research paper by Milian shows that stocks which had the worst return during past earning announcement deliver substantially better return during the days around the next earnings announcement. Classical PEAD (post-earnings announcement drift) literature examines mainly quarterly returns; therefore, it is probable that PEAD still holds. However, Milian’s work shows a way how to profit from traders’ over-reaction to a classical anomaly.
Fundamental reason
The academic paper speculates that it seems that due to their well-documented history of apparently underreacting to earnings news, investors are now overreacting to earnings announcement news. However, classical PEAD (post-earnings announcement drift) literature examines mainly quarterly portfolio returns while this academic paper focuses on 2-days return; therefore, it is probable that PEAD still holds and both anomalies exist concurrently.
- Unlocked Screener & 300+ Advanced Charts
- 700+ uncommon trading strategy ideas
- New strategies on a bi-weekly basis
- 2000+ links to academic research papers
- 500+ out-of-sample backtests
- Design multi-factor multi-asset portfolios
Backtest period from source paper
1996-2010
Confidence in anomaly's validity
Moderately Strong
Indicative Performance
40.32%
Notes to Confidence in Anomaly's Validity
OOS back-test shows slightly negative performance. It looks, that strategy’s alpha is deteriorating in the out-of-sample period.
Notes to Indicative Performance
per annum, annualized (aritmethically) daily return of 0.32%, daily return is estimated as 1/4 of 2-day return 1.29%, data from table 4 panel A, daily return is lowered to 1/4 as it can be expected that portfolio would not be held every day (earnings announcements are distributed sporadically during calendar year)
Period of Rebalancing
Daily
Notes to Period of Rebalancing
Notes to Estimated Volatility
Number of Traded Instruments
4
Notes to Number of Traded Instruments
estimated average number of stocks held during one day
Notes to Maximum drawdown
Complexity Evaluation
Complex strategy
Notes to Complexity Evaluation
Financial instruments
stocks
Simple trading strategy
The investment universe consists of all stocks from NYSE, AMEX, and NASDAQ with active options market (so mostly large-cap stocks). Each day investor selects stocks which would have earnings announcement during the next working day. He then checks the abnormal performance of these stocks during the previous earnings announcement. Investor goes long decile of stocks with the lowest abnormal past earnings announcement performance and goes short stocks with the highest abnormal past performance. Stocks are held for two days, and the portfolio is weighted equally.
Hedge for stocks during bear markets
Not known - Source and related research papers don’t offer insight into the correlation structure of the proposed trading strategy to equity market risk; therefore, we do not know if this strategy can be used as a hedge/diversification during the time of market crisis. The strategy is built as a long-short, but it can be split into two parts. The long leg of the strategy is surely strongly correlated to the equity market; however, the short-only leg might be used as a hedge during bad times. Rigorous backtest is, however, needed to determine return/risk characteristics and correlation.
Out-of-sample strategy's implementation/validation in QuantConnect's framework
(chart+statistics+code)