We’ve already analyzed tens of thousands of financial research papers and identified more than 700 attractive trading systems together with hundreds of related academic papers.
Browse Strategies- Unlocked Screener & 300+ Advanced Charts
- 700+ uncommon trading strategy ideas
- New strategies on a bi-weekly basis
- 2000+ links to academic research papers
- 500+ out-of-sample backtests
- Design multi-factor multi-asset portfolios
Upgrade subscription
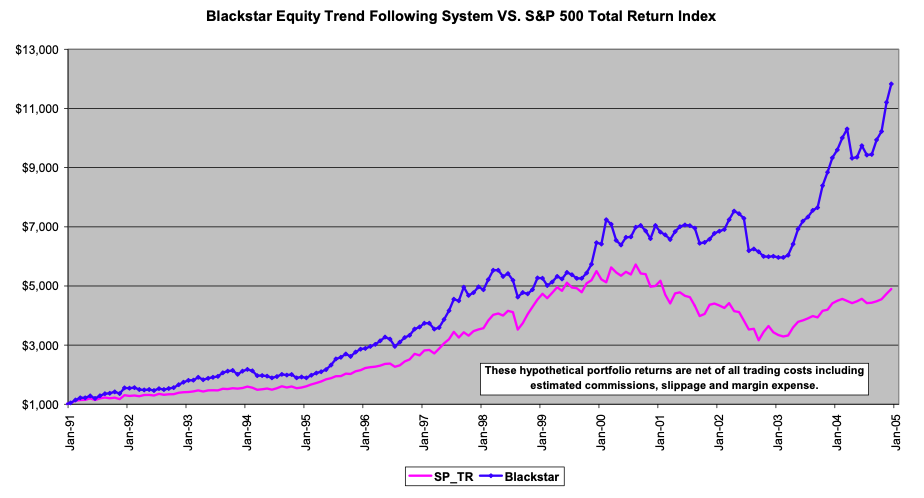
Trend-following is one of the oldest trading techniques, and trend-following systems belong to the standard repertoire of investors and traders. Many times it has been successfully used in futures markets. But does it work on stocks?
Research shows it does, and it performs well for such a simple strategy. There are many trend-following systems with different rules, but all systems have a common attribute. They try to buy growing assets, although “grow/trend” could be defined in many ways. We present a research paper documenting a simple trend-following system on stocks which uses a new all-time high as entry condition and ATR as a trailing stop.
* Are you interested in systematic quantitative factor ETFs? Here is a link to the Alpha Architect Value Momentum Trend ETF (strategy background), our partner, which combines international equities’ value, momentum, and trend factors. *
Fundamental reason
Behavioral biases (investors herding, under- and over-reaction, etc.) create a non-normal return distribution on financial markets. Trend-following systems cut the left tail of the long-tail distribution. This characteristic creates improved risk/return characteristics of trend-following systems when compared to a diversified buy&hold approach.
- Unlocked Screener & 300+ Advanced Charts
- 700+ uncommon trading strategy ideas
- New strategies on a bi-weekly basis
- 2000+ links to academic research papers
- 500+ out-of-sample backtests
- Design multi-factor multi-asset portfolios
Backtest period from source paper
1983-2004
Confidence in anomaly's validity
Strong
Indicative Performance
19.3%
Notes to Confidence in Anomaly's Validity
Notes to Indicative Performance
per annum, data from table on page 13
Period of Rebalancing
Daily
Estimated Volatility
15.6%
Notes to Period of Rebalancing
Notes to Estimated Volatility
data from table on page 12
Number of Traded Instruments
1000
Notes to Number of Traded Instruments
more or less, it depends on investor’s need for diversification and number of stocks which satisfy system’s entry conditions
Notes to Maximum drawdown
data from table on page 13
Complexity Evaluation
Complex strategy
Notes to Complexity Evaluation
Financial instruments
stocks
Simple trading strategy
The investment universe consists of US-listed companies. A minimum stock price filter is used to avoid penny stocks, and a minimum daily liquidity filter is used to avoid stocks that are not liquid enough. The entry signal occurs if today’s close is greater than or equal to the highest close during the stock’s entire history. A 10-period average true range trailing stop is used as an exit signal. The investor holds all stocks which satisfy the entry criterion and are not stopped out. The portfolio is equally weighted and rebalanced daily. Transaction costs of 0.5% round-turn are deducted from each trade to account for estimated commission and slippage.
Hedge for stocks during bear markets
No - The selected strategy is designed as a long-only; therefore, it can’t be used as a hedge against market drops as a lot of strategy’s performance comes from equity market premium (as the investor holds equities, therefore, his correlation to the broad equity market is very very high).
Related Dataset
Finage US & Global Stock Data all in one place – Stock data in real-time streaming and historical API, 18 years of historical stock data API for all stock exchanges with last price, OHLCV, aggregate, LV1 and LV2 market depth data + Financial Fundamentals data will empower your website with stock quote charts, stock news, market status, and company details via stock API.
Out-of-sample strategy's implementation/validation in QuantConnect's framework
(chart+statistics+code)