The next tool we introduce is the Correlation Analysis. This report allows you to review the correlation of your model portfolio to a variety of systematic and market factors. The Correlation Table shows the correlations between assets of your model portfolio. Furthermore, you can analyze the Average Intra-Correlation over the last few years.
Commodity futures gained a lot of popularity among financial investors over the past few decades. This phenomenon, also known as the financialization of commodities, has changed the behavior and correlation structure between commodities and the general stock market. In this section, we argue that a similar thing may be happening right now to cryptos.
We review various portfolios and analyze whether the crypto is starting to integrate into the financial system. The first portfolio we select is 50% BTC (Bitcoin) and 50% QQQ (Invesco Nasdaq 100 ETF).
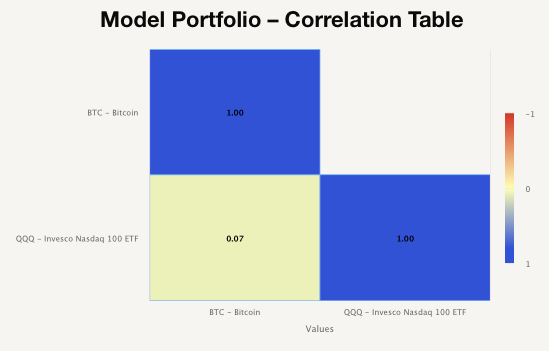
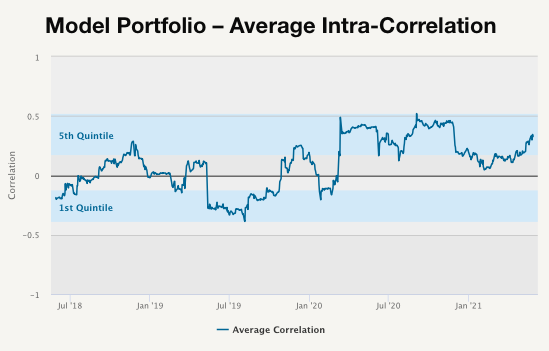
The figure above shows that the correlation between BTC and QQQ is 7%, which is not very high. However, as we can see in the figure below, the Average Intra-Correlation of this portfolio during the last year is very high and almost always in the top quintile. Additionally, we can see that the trend is growing, suggesting that the BTC’s and QQQ’s correlation is rising.
Another portfolio we analyze is 50% BTC (Bitcoin) and 50% ARKK (ARK Innovation ETF), which represents small innovative companies. ARKK is not in Quantpedia’s pool of strategies, so we upload it as a custom equity curve. The following chart represents the correlation between BTC and ARKK.
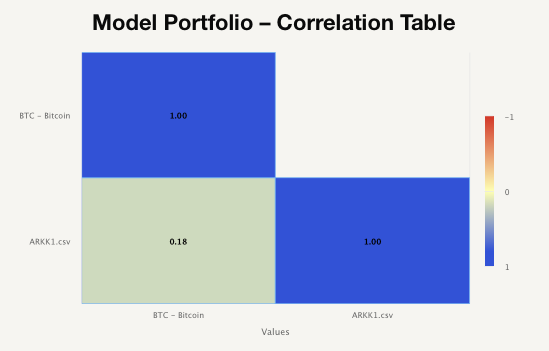
As we can see, the correlation between ARKK and BTC is higher than the correlation between QQQ and BTC. However, it is still pretty low. The next figure shows how the average intra-correlation evolved over time.
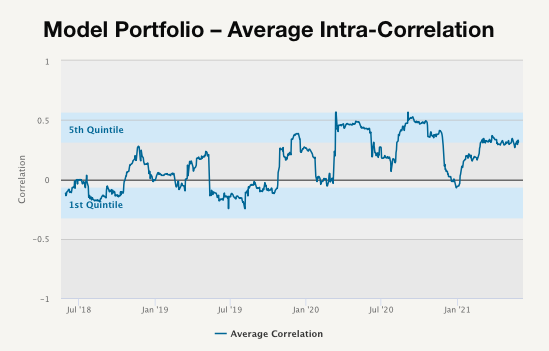
This figure shows that even though the average intra-correlation is not steadily growing, the trend is once again rising. We could argue that there is evidence supporting our hypothesis. The behavior and correlation structure between cryptos and the general stock market is changing.
Lastly, we take a look at an equally-weighted portfolio consisting only of cryptos. This portfolio includes BTC (Bitcoin), ETH (Ethereum), ADA (Cardano), XRP (Ripple), ABCH.SW (Bitcoin Cash ETP), LTC (Litecoin), XLM (Stellar), ETCG (Ethereum Classic), EOS (EOS), XMR (Monero). The following figure shows the correlation table of all the assets.
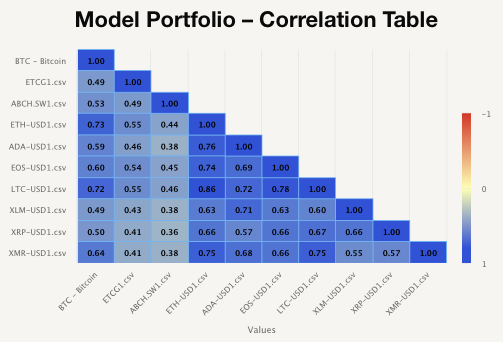
As we can see, the lowest correlation of 36% is between XRP and ABCH.SW and the highest correlation of 78% is between LTC and EOS. Overall, we can say that all the cryptos in our portfolio are highly correlated. Let’s look at the chart below to see how the average intra-correlation evolves in time.
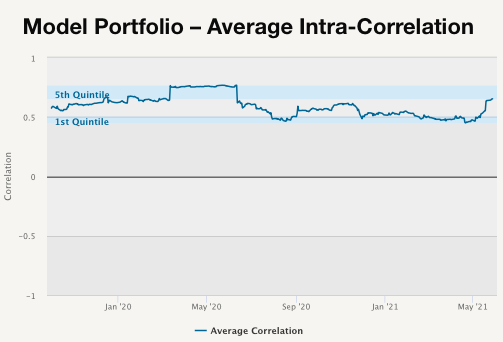
This figure shows that over the last year, the average intra-correlation is around 50% or higher. So lastly, let’s look at some of the market factors.
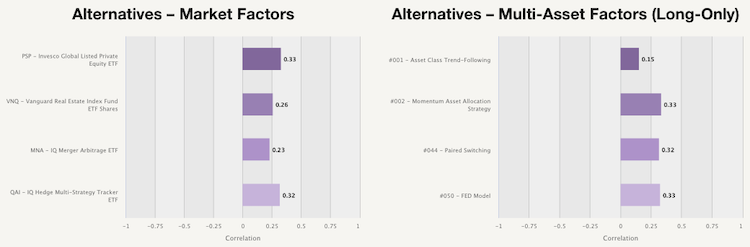
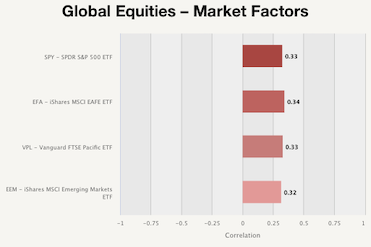
As we can see, our purely crypto portfolio holds a significant correlation to numerous global equities and alternatives. This supports our hypothesis even further, and we can say that talking about the financialization of cryptos is not entirely of the table.
Interested? Then subscribe to Quantpedia Pro and try how our analytics and reporting significantly saves time spent on quantitative research. Or check Quantpedia Explains if you would like to see more case studies.