This Crisis Analysis case study article is a very short introduction to the Crisis Analysis report, which is part of the Quantpedia Pro offering. The report allows you to review your portfolio’s performance during 15 significant crisis periods over the last 20+ years. The report is split into two sections; the first one includes six longer time periods with significant stock market’s drawdowns. The second section contains nine short-term shocks (like the 9/11 attacks, the 2010 flash crash etc.). Each scenario shows the performance of your custom model portfolio and the S&P 500 Index’s benchmark performance, plus a short description of the selected event.
To illustrate the function of this report, we picked three simple model portfolios and we will walk you through some of the findings.
The first model portfolio consists of 100% XLU ETF (Utilities Select Sector SPDR Fund). It’s a defensive ETF, meaning it should offer a slightly better performance during crisis periods than our S&P 500 Index benchmark; however, its behaviour would still be highly correlated.
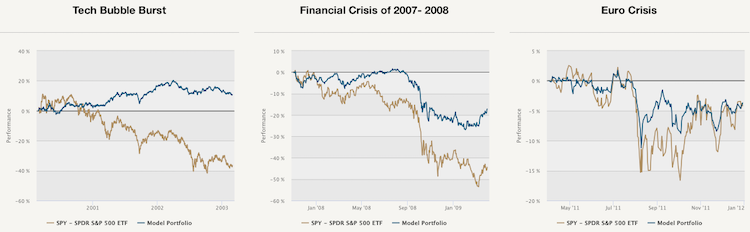
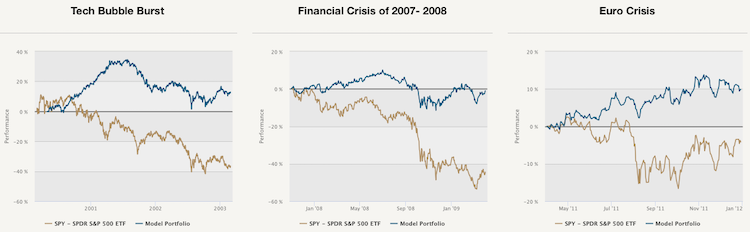
The first figure shows the performance of our strategy (in this case XLU ETF) in comparison to the benchmark S&P 500 Index during three of the long-term crisis periods. As we can see, the XLU ETF performed slightly better during the Tech Bubble Burst and the Financial Crisis of 2007-2008. Additionally, it performed significantly better during the Euro Crisis.
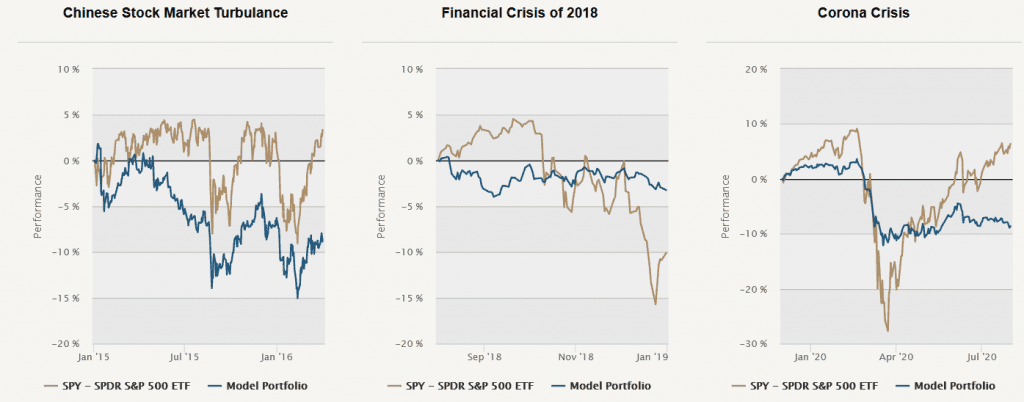
The performance of the XLU is more mixed during the more recent periods, but the defensive nature of XLU is still visible during the market correction at the end of 2018.
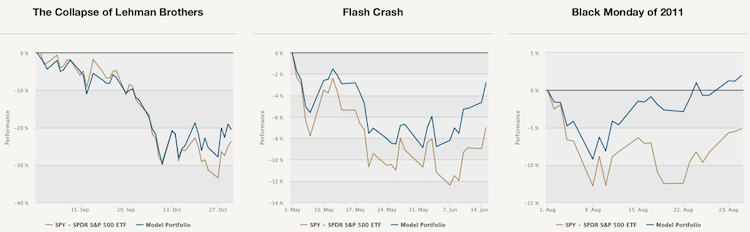
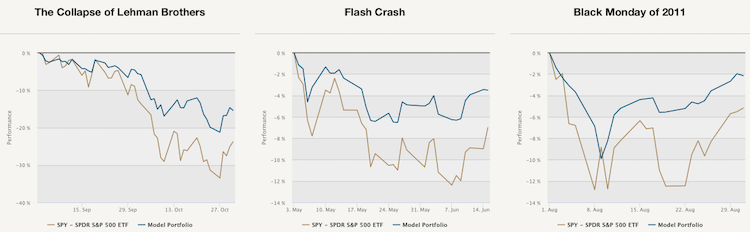
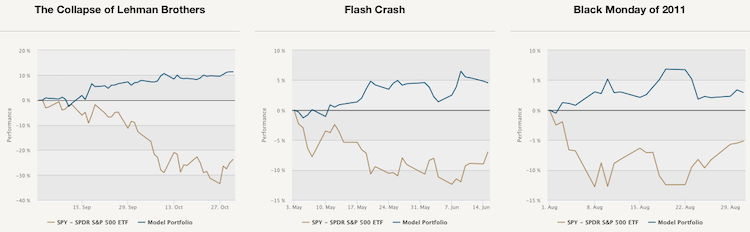
The second figure shows the performance of our strategy compared to the benchmark S&P 500 Index during three of the short-term crisis periods (out of nine we monitor). XLUs performance is almost identical to SPYs performance during The Collapse of Lehman Brothers. However, XLU significantly outperformed the benchmark in the other two situations.
The second model portfolio we analyze consists of 100% of the #005 FX Carry Trade strategy. This strategy is probably the most well-known currency trading/investment strategy. So, let’s take a look at its performance during crisis periods.
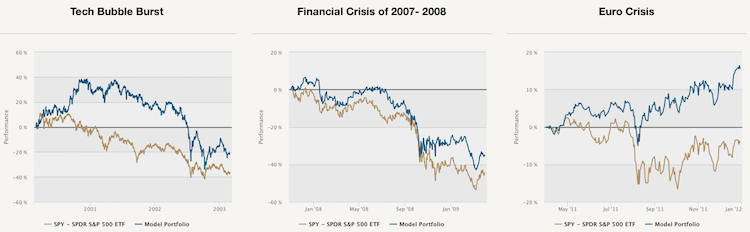
The figure below shows the performance of our strategy (in this case #005 FX Carry Trade) compared to the benchmark S&P 500 Index during three of the long-term crisis periods. As we can see, the FX Carry Trade performed much better during the Tech Bubble Burst and the Financial Crisis of 2007-2008. It also performed slightly better than the benchmark during the Euro Crisis.
Once again, the performance of the Carry strategy is more mixed during the more recent periods, especially in the recent coronavirus crisis period.
The second figure shows the performance of the #005 FX Carry Trade strategy compared to the benchmark S&P 500 Index during three of the short-term crisis periods. FX Carry Trade outperformed the benchmark in all three situations. But still, FX Carry Trade performance is in its behaviour similar to the first model portfolio, which held XLU ETF – the correlation to the S&P 500 Index benchmark is still high.
The last model portfolio we picked for this analysis consists of 100% of the #281 – Skewness Effect in Commodities strategy. Academic studies explain the skewness effect in all assets by investors willing to pay a higher price and earn a lower expected return on assets with lottery-like payoffs. Let’s now take a look at how this strategy performs during the crisis.
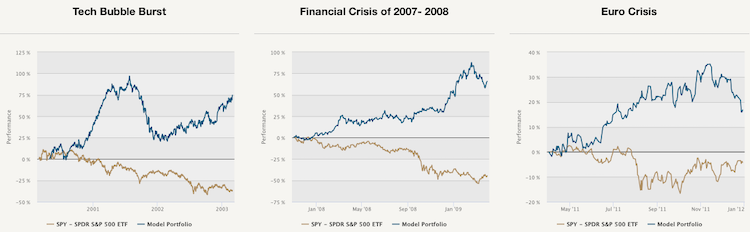
The first figure shows our portfolio compared to the benchmark during the long-term periods. As we can see, our portfolio not only performed better than the benchmark, its performance is growing in all three scenarios of older crisis.
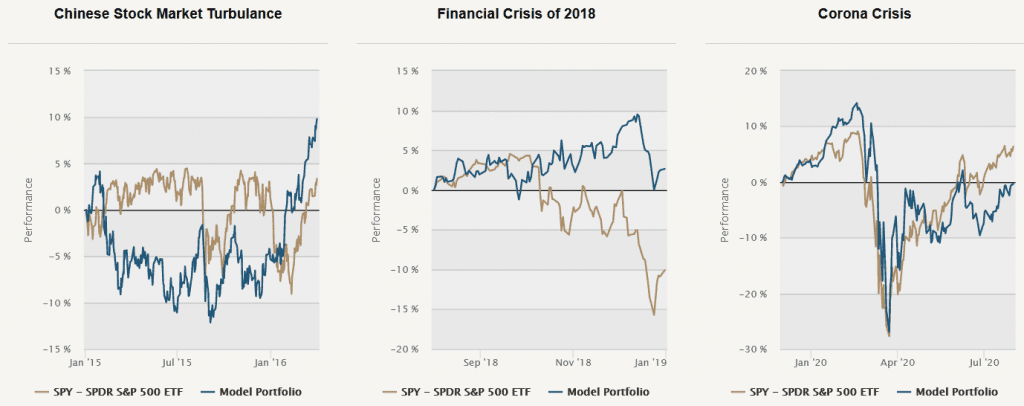
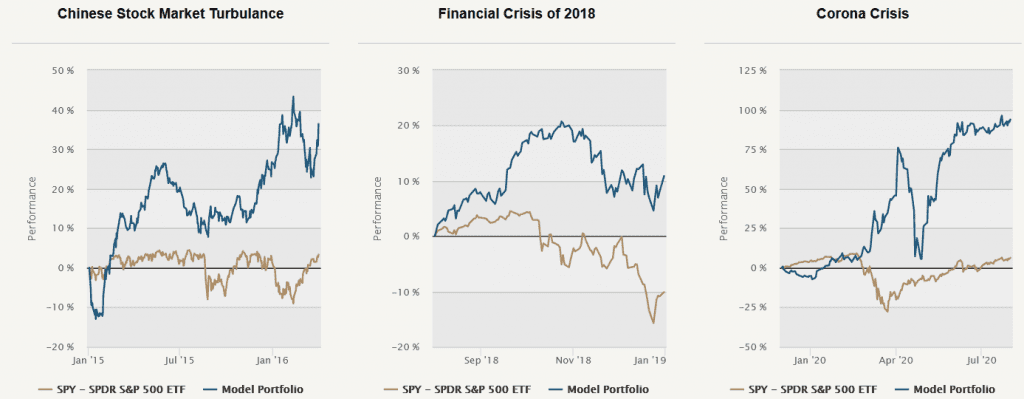
The Skewness strategy shows profitable behaviour also during the more recent crisis periods.
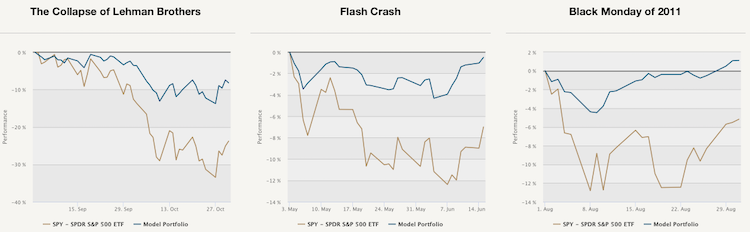
The figure below shows the performance during three short-term crises (out of nine periods we monitor in this section). As we can see, the performance is growing even during these time periods. The Skewness strategy not just outperforms the benchmark S&P 500 Index during crisis but can probably serve as a hedge.
Now, it could be interesting to see how would a model portfolio created by combining all three of these strategies behave during times of crisis. So lastly, let’s look at an equally-weighted portfolio consisting of XLU ETF (Utilities Select Sector SPDR Fund), #005 FX Carry Trade and #281 – Skewness Effect in Commodities.
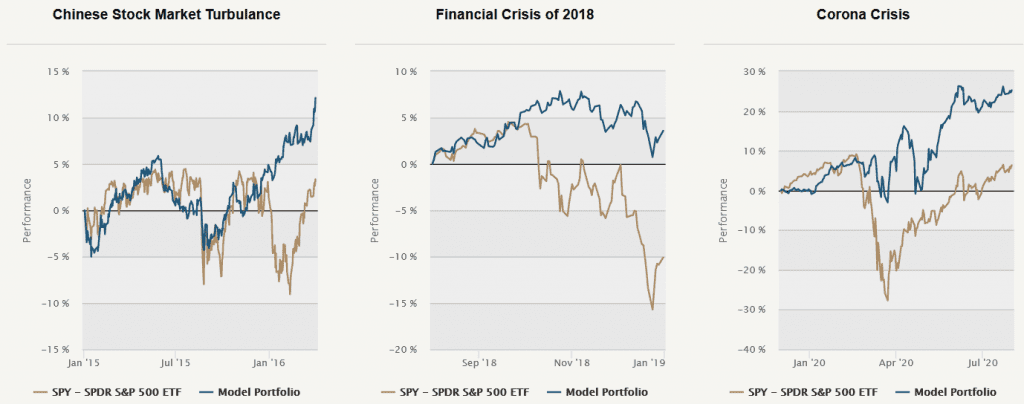
Looking at the figure above, we can say that our portfolio performs well during all six of the long-term crisis periods.
Additionally, the figure below shows the performance of our model portfolio during the short-term crisis periods. As we can see, the portfolio performed well even during the short-term crises. The combination of hedging Skewness strategy and the Carry trade strategy and XLU ETF has a smoother equity curve with lower drawdowns during crisis periods.
Overall, the Crisis Analysis tool will help you to understand the behaviour of your custom model portfolio during times of crisis.
Interested? Then subscribe to Quantpedia Pro and try how our analytics and reporting significantly saves time spent on quantitative research. Or check Quantpedia Explains if you would like to see more case studies.