Quantpedia Pro is the new advanced extension of the Quantpedia Premium service. In this case study, we walk you through one of the many features of this extension. We decided to step in the shoes of a Portfolio Manager and pick a few portfolios from our pool of 300+ Quantpedia strategies and 100+ passive market factors in the Portfolio Manager tab to further analyse them through the tools Quantpedia Pro offers.
Seasonality Analysis
The tool we choose for this case study is the Seasonality Analysis. This report investigates your model portfolio‘s performance during the significant market-action periods like – days of economic announcements, FOMC meeting days, etc. It allows you to understand how your portfolio performs and reacts to various calendar events and decide whether an increase or decrease in exposure during those periods is appropriate.
To demonstrate the added value of this tool, we start by picking a portfolio that consists of 100% equities (in the form of SPY ETF) in Portfolio Manager. As we all know, there are many seasonal anomalies in stocks, and a few of them are illustrated in the figure below.
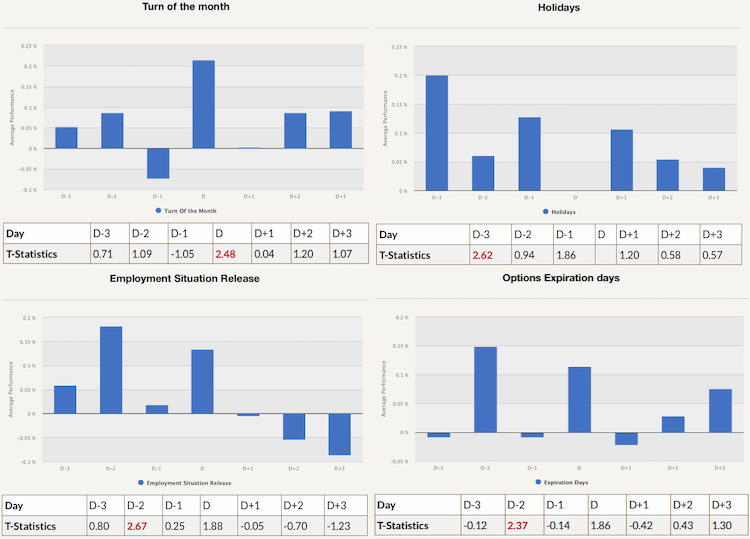
It is well documented that stock prices tend to increase during the last four days and the first three days of each month. As we can see in the top-left chart, there is a significant performance at the Turn of the Month period (mainly during the first day of the month).
The top-right chart shows performance around public US holidays. The Pre-Holiday Effect is a well-studied calendar anomaly in equities. It documents the tendency for a stock market to gain on the trading days leading up to holidays. Research shows that market return during pre-holiday days is often more than ten times larger than the average return during regular trading days. As we can see, SPY ETFs performance is positive all three days before the Holidays.
The bottom left chart presents performance during the days around Employment Situation Release. This day is the day when the Bureau of Labor Statistics (BLS) publishes its monthly employment report. Research shows that there’s a strong and direct connection between the unemployment rate and the stock market. And as we can see, SPYs performance is positive two days before this day and during announcement day.
Lastly, the bottom right chart shows the performance of SPY around the Option Expiration days. The expiration date for listed stock options in the U.S. is the Friday before the third Saturday of each month. On months that the Friday falls on a holiday, the expiration date is on Thursday immediately before. The closer an option gets to its expiration day, the faster it loses value. Options trading can be volatile and unpredictable on the expiration day. However, large-cap stocks with actively traded options tend to have substantially higher average weekly returns during the week before options expiration.
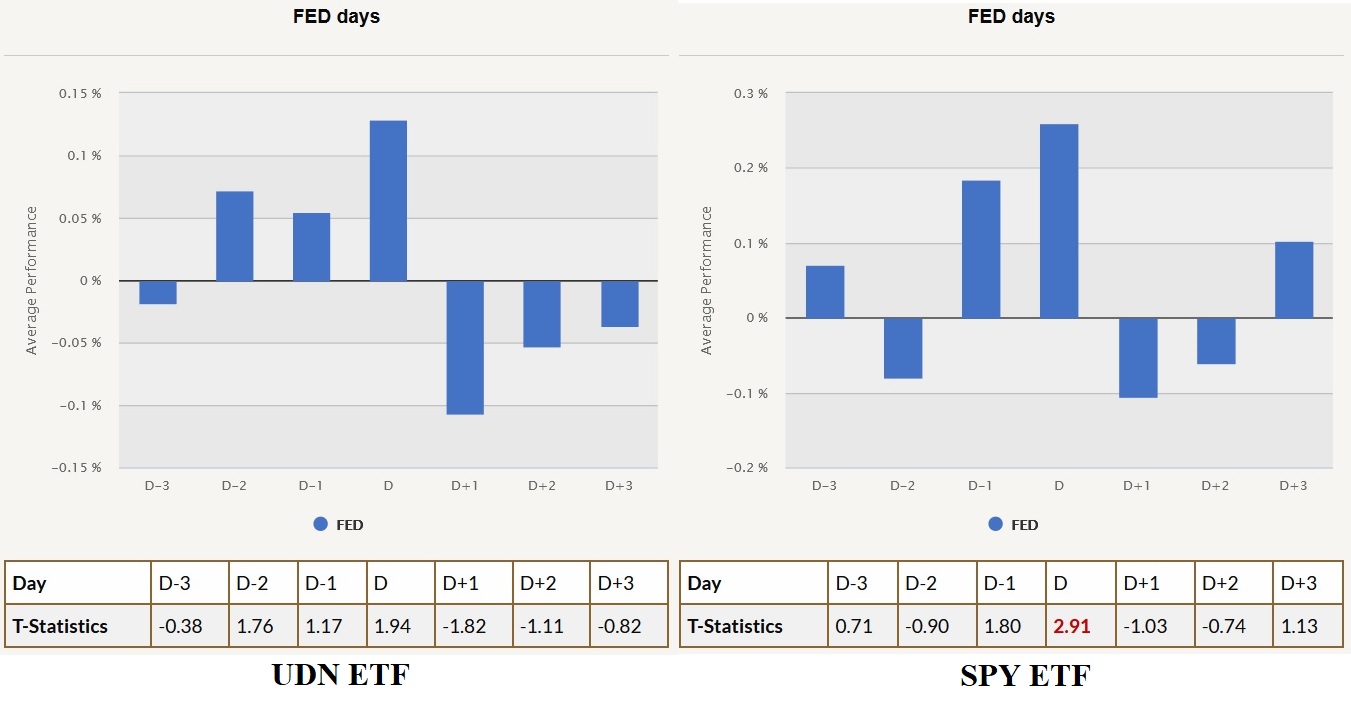
Another asset class that might be interesting to analyse is currencies. Unfortunately, there is not a lot of research done about seasonality in currencies. So, let’s choose Invesco DB US Dollar Index Bearish Fund (UDN), which holds short dollar exposure against the basket of foreign currencies and analyse its seasonal performance. We can see that the average performance of the short dollar position is very similar to long stocks during days around the Federal Reserve Open Market Committee meetings.
On the one hand, this tool can be used to prove your hypothesis. On the other hand, it can also identify new anomalies. For example, let’s pick an asset from whole another asset class, such as commodities. Let’s look at one of the most traded commodities: gold (proxies by GLD ETF) and its seasonal performance.
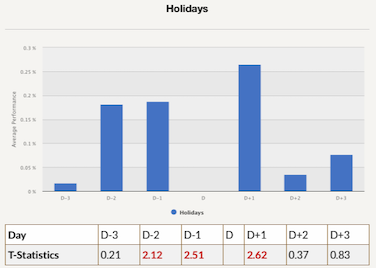
As we can see, there are three days around the public US holidays with significantly high average performance, which is entirely new anomaly, not described in any academic research.
Interested? Then subscribe to Quantpedia Pro and try how our analytics and reporting significantly saves time spent on quantitative research. Or check Quantpedia Explains if you would like to see more case studies.