Volatility effect

News Implied VIX Since The Year 1890

9.May 2019

We present an interesting academic paper with a methodology that allows estimating VIX (volatility risk) since the year 1890 …

Authors: Manela, Moreira

Title: News Implied Volatility and Disaster Concerns

Link: https://papers.ssrn.com/sol3/papers.cfm?abstract_id=2382197

Abstract:

We construct a text-based measure of uncertainty starting in 1890 using front-page articles of the Wall Street Journal. News implied volatility (NVIX) peaks during stock market crashes, times of policy-related uncertainty, world wars and financial crises. In US post-war data, periods when NVIX is high are followed by periods of above average stock returns, even after controlling for contemporaneous and forward-looking measures of stock market volatility. News coverage related to wars and government policy explains most of the time variation in risk premia our measure identifies. Over the longer 1890-2009 sample that includes the Great Depression and two world wars, high NVIX predicts high future returns in normal times, and rises just before transitions into economic disasters. The evidence is consistent with recent theories emphasizing time variation in rare disaster risk as a source of aggregate asset prices fluctuations.

Notable quotations from the academic research paper:

"This paper aims to quantify this “spirit of the times”, which after the dust settles is forgotten, and only hard data remains to describe the period. Specifically, our goal is to measure people’s perception of uncertainty about the future, and to use this measurement to investigate what types of uncertainty drive aggregate stock market risk premia.

We start from the idea that time-variation in the topics covered by the business press is a good proxy for the evolution of investors’ concerns regarding these topics.

We estimate a news-based measure of uncertainty based on the co-movement between the front-page coverage of the Wall Street Journal and options-implied volatility (VIX). We call this measure News Implied Volatility, or NVIX for short. NVIX has two useful features that allow us to further our understanding of the relationship between uncertainty and expected returns:

(i) it has a long time-series, extending back to the last decade of the nineteen century, covering periods of large economic turmoil, wars, government policy changes, and crises of various sorts;

(ii) its variation is interpretable and provides insight into the origins of risk variation.

The first feature enables us to study how compensation for risks reflected in newspaper coverage has fluctuated over time, and the second feature allows us to identify which kinds of risk were important to investors.

We rely on machine learning techniques to uncover information from this rich and unique text dataset. Specifically, we estimate the relationship between option prices and the frequency of words using Support Vector Regression. The key advantage of this method over Ordinary Least Squares is its ability to deal with a large feature space. We find that NVIX predicts VIX well out-of-sample, with a root mean squared error of 7.48 percentage points (R2 = 0.19). When we replicate our methodology with realized volatility instead of VIX, we find that it works well even as we go decades back in time, suggesting newspaper word-choice is fairly stable over this period.
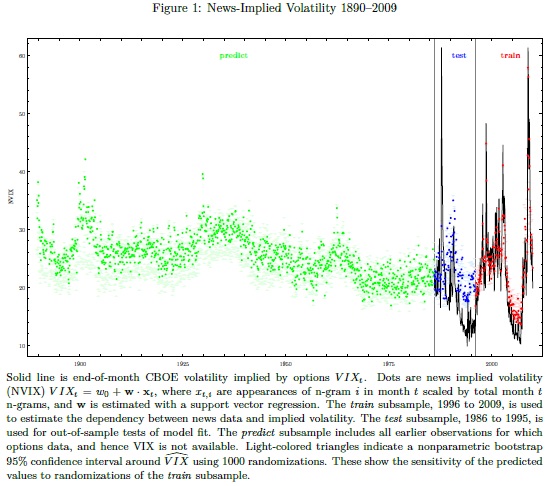
News Based VIX Index

We study whether fluctuations in NVIX encode information about equity risk premia. We begin by focusing on the post-war period commonly studied in the literature for which high-quality stock market data is available. We find strong evidence that times of greater investor uncertainty are followed by times of above average stock market returns. A one standard deviation increase in NVIX predicts annualized excess returns higher by 3.3 percentage points over the next year and 2.9 percentage points annually over the next two years.

Interpretability, a key feature of the text-based approach, enables us to investigate what type of news drive the ability of NVIX to predict returns. We decompose the text into five categories plausibly related (to a varying degree) to disaster concerns: war, financial intermediation, government policy, stock markets, and natural disasters. We find that a large part of the variation in risk premia is related to wars (53%) and government policy (27%). A substantial part of the time-series variation in risk premia NVIX identifies is driven by concerns tightly related to the type of events discussed in the rare disasters literature."


Are you looking for more strategies to read about? Check http://quantpedia.com/Screener

Do you want to see a performance of trading systems we described? Check http://quantpedia.com/Chart/Performance

Do you want to know more about us? Check http://quantpedia.com/Home/About


Follow us on:

Facebook: https://www.facebook.com/quantpedia/

Twitter: https://twitter.com/quantpedia


Continue reading

Better Rebalancing Strategy for Static Asset Allocation Strategies

13.March 2019

An interesting financial academic paper which analyzes an alternative approach to rebalancing of static asset allocation strategies:

Authors: Granger, Harvey, Rattray, Van Hemert

Title: Strategic Rebalancing

Link: https://papers.ssrn.com/sol3/papers.cfm?abstract_id=3330134

Abstract:

A mechanical rebalancing strategy, such as a monthly or quarterly reallocation towards fixed portfolio weights, is an active strategy. Winning asset classes are sold and losers are bought. During crises, when markets are often trending, this can lead to substantially larger drawdowns than a buy-and-hold strategy. Our paper shows that the negative convexity induced by rebalancing can be substantially mitigated, taking the popular 60-40 stock-bond portfolio as our use case. One alternative is an allocation to a trend-following strategy. The positive convexity of this overlay tends to counter the impact on drawdowns of the mechanical rebalancing strategy. The second alternative we call strategic rebalancing, which uses smart rebalancing timing based on trend-following signals – without a direct allocation to a trend-following strategy. For example, if the trend-following model suggests that stock markets are in a negative trend, rebalancing is delayed.

Notable quotations from the academic research paper:

"A pure buy-and-hold portfolio has the drawback that the asset mix tends to drift over time and, as such, is untenable for investors who seek diversification. However, a stock-bond portfolio that regularly rebalances tends to underperform a buy-and-hold portfolio at times of continued outperformance of one of the assets. Using a simple two-period model, we explain the main intuition behind this effect: rebalancing means selling (relative) winners, and if winners continue to outperform, that detracts from performance.

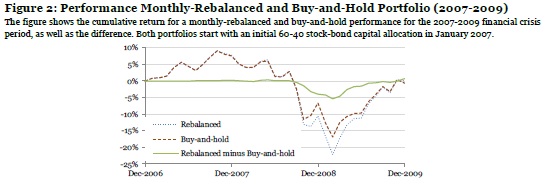
As stocks typically have more volatile returns than bonds, relative returns tend to be driven by stocks. Hence, of particular interest are episodes with continued negative (absolute and relative) stock performance, such as the 2007-2009 global financial crisis. In Figure 2, we contrast the monthly-rebalanced and buy-and-hold cumulative performance over the financial crisis period, where both start with an initial 60-40 stock-bond capital allocation. The maximum drawdown of the monthly-rebalanced portfolio is 1.2 times (or 5 percentage points) worse than that of the buy-and-hold portfolio, right at the time when financial markets turmoil is greatest.

Rebalanced and not rebalanced portfolio

In earlier work, Granger et al. (2014) formally show that rebalancing is similar to starting with a buy-and-hold portfolio and adding a short straddle (selling both a call and a put option) on the relative value of the portfolio assets. The option-like payoff to rebalancing induces negative convexity by magnifying drawdowns when there are pronounced divergences in asset returns. We show that time-series momentum (or trend) strategies, applied to futures on the same stock and bond markets, are natural complements to a rebalanced portfolio. This is because the trend payoff tends to mimic that of a long straddle option position, or exhibits positive convexity.

Trend exposure and portfolio drawdown

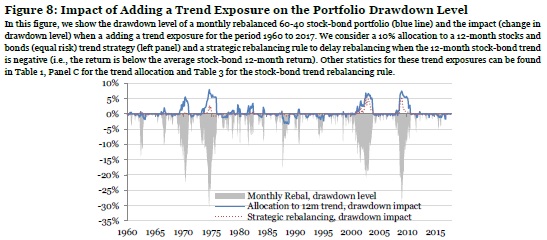
We evaluate how 1-, 3-, and 12-month trend strategies perform during the five worst drawdowns for the 60-40 stock-bond portfolio. Allocating 10% to a trend strategy and 90% to a 60-40 monthly-rebalanced portfolio improves the average drawdown by about 5 percentage points, compared to a 100% allocation to a 60-40 monthly rebalanced portfolio. The trend allocation has no adverse impact on the average return over our sample period. That is, while one would normally expect a drag on the overall (long-term) performance when allocating to a defensive strategy, in our sample, the trend-following premium earned offsets the cost (or insurance premium) paid.

An alternative to a trend allocation is strategically timing and sizing rebalancing trades, which we label strategic rebalancing. We first consider a range of popular heuristic rules, varying the rebalancing frequency, using thresholds, and trading only partially back to the 60-40 asset mix. Such heuristic rules reduce the average maximum drawdown level for the five crises considered by up to 1 percentage point. However, using strategic rebalancing rules based on either the past stock or past stock-bond relative returns gives improvements of 2 to 3 percentage points."


Are you looking for more strategies to read about? Check http://quantpedia.com/Screener

Do you want to see performance of trading systems we described? Check http://quantpedia.com/Chart/Performance

Do you want to know more about us? Check http://quantpedia.com/Home/About


Follow us on:

Facebook: https://www.facebook.com/quantpedia/

Twitter: https://twitter.com/quantpedia


Continue reading

Two Centuries of Global Factor Premiums

7.March 2019

Related to all major factor strategies (trend, momentum, value, carry, seasonality and low beta/volatility):

Authors: Baltussen, Swinkels, van Vliet

Title: Global Factor Premiums

Link: https://papers.ssrn.com/sol3/papers.cfm?abstract_id=3325720

Abstract:

We examine 24 global factor premiums across the main asset classes via replication and new-sample evidence spanning more than 200 years of data. Replication yields ambiguous evidence within a unified testing framework with methods that account for p-hacking. The new-sample evidence reveals that the large majority of global factors are strongly present under conservative p-hacking perspectives, with limited out-of-sample decay of the premiums. Further, utilizing our deep sample, we find global factor premiums to be not driven by market, downside, or macroeconomic risks. These results reveal strong global factor premiums that present a challenge to asset pricing theories.

Notable quotations from the academic research paper:

"In this paper we study global factors premiums over a long and wide sample spanning the recent 217 years across equity index (but not single securities), bond, currency, and commodity markets.

The first objective of this study is to robustly and rigorously examine these global factor premiums from the perspective of ‘p-hacking’.

We take as our starting point the main global return factors published in the Journal of Finance and the Journal of Financial Economics during the period 2012-2018: time-series momentum (henceforth ‘trend’), cross-sectional momentum (henceforth ‘momentum’), value, carry, return seasonality and betting-against-beta (henceforth ‘BAB’). We examine these global factors in four major asset classes: equity indices, government bonds, commodities and currencies, hence resulting in a total of 24 global return factors.4

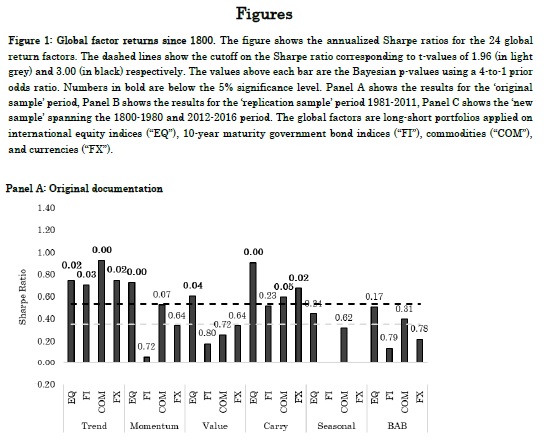
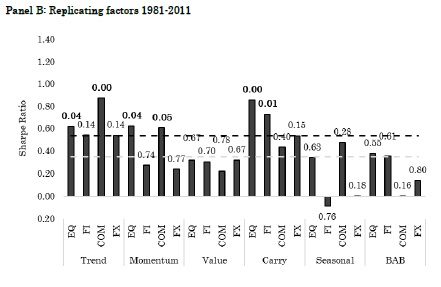
We work from the idea that these published factor premiums could be influenced by p-hacking and that an extended sample period is useful for falsification or verification tests. Figure 1, Panel A summarizes the main results of these studies.

Global factor strategies

Shown are the reported Sharpe ratio’s in previous publications, as well as the 5% significance cutoff in the grey-colored dashed line. In general, the studies show evidence on the global factor premiums, with 14 of the 22 factors (return seasonality is not tested in bonds and currencies) displaying significant Sharpe ratio’s at the conventional 5% significance level.

Global factor strategies 1981-20111

Further, most of the studies have differences in, amongst others, testing methodologies, investment universes and sample periods, choices that introduce degrees of freedom to the researcher. To mitigate the impact of such degrees of freedom, we reexamine the global return factors using uniform choices on testing methodology and investment universe over their average sample period (1981-2011). Figure 1, Panel B shows the results of this replicating exercise. We find that Sharpe ratios are marginally lower, with 12 of the 24 factor premiums being significant at the conventional 5% level.

Global factor strategies 1981-2011


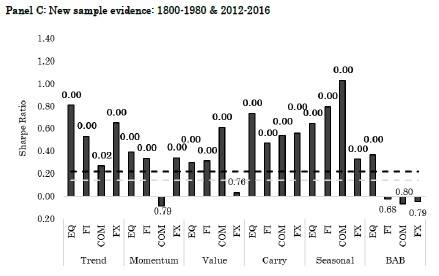
The second objective of this study is to provide rigorous new sample evidence on the global return factors. To this end, we construct a deep, largely uncovered historical global database on the global return factors in the four major asset classes. This data consists of pre-sample data spanning the period 1800- 1980, supplemented with post-sample data from 2012-2016, such that we have an extensive new sample to conduct further analyses. If the global return factors were unintentionally the result of p-hacking, we would expect them to disappear for this new sample period.

Our new sample findings reveal consistent and ubiquitous evidence for the large majority of global return factors. Figure 1, Panel C summarizes our main findings by depicting the historical Sharpe ratio’s in the new sample period. In terms of economic significance, the Sharpe ratios are substantial, with an average of 0.41. Remarkably, in contrast to most out-of-sample studies we see very limited ‘out-of-sample’ decay of factor premiums.

In terms of statistical significance and p-hacking perspectives, 19 of the 24 t-values are above 3.0,19 Bayesian p-values are below 5%, and the break-even prior odds generally need to be above 9,999 to have less than 5% probability that the null hypothesis is true."


Are you looking for more strategies to read about? Check http://quantpedia.com/Screener

Do you want to see performance of trading systems we described? Check http://quantpedia.com/Chart/Performance

Do you want to know more about us? Check http://quantpedia.com/Home/About


Follow us on:

Facebook: https://www.facebook.com/quantpedia/

Twitter: https://twitter.com/quantpedia


Continue reading

Fund Flows of Active Funds Significantly Affect Value and Size Factors

27.February 2019

A new academic paper related to:

#25 – Size Factor
#26 – Value (Book-to-Market) Factor

Authors: Hung, Song, Xiang

Title: Fragile Factor Premia

Link: https://papers.ssrn.com/sol3/papers.cfm?abstract_id=3312837

Abstract:

We demonstrate that returns and volatilities of the Fama-French size and value factors are significantly determined by non-fundamental flow-induced trading from actively managed equity mutual funds. Mutual fund flows are largely ignorant about systematic risks. These non-fundamental shifts in demand induce large return heterogeneity within and across the Fama-French size and book-to-market portfolios. We show that aggregate mutual fund flow- induced trades across the size and book-to-market spectrum significantly influence the size and value premia, followed by large subsequent reversals. We also find that the expected volatilities of mutual funds’ flow-induced trades strongly predict future factor volatilities. Our results highlight the importance of non-fundamental demand shocks in determining factor premia and factor volatilities.

Notable quotations from the academic research paper:

"Mutual fund trading has a considerable price impact on individual stocks. However, some more recent work suggests that mutual fund investors are largely ignorant about systematic risks, when allocating capitals among mutual funds. Empirically, it remains unclear how trades induced by the non-fundamental mutual fund flows impact returns and volatilities of size and value, the two prominent factors. This paper aims to fi ll this gap.

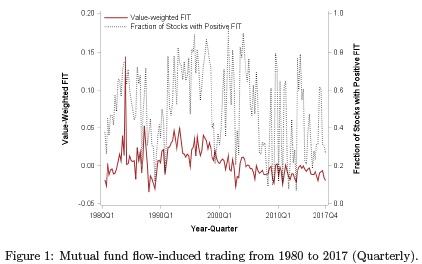
In our study, we use a bottom-up approach and estimate mutual fund flow-induced trading (FIT) for each stock-quarter from 1980 to 2017. In a nutshell, FIT measures the magnitude of flow-driven trading by the aggregate equity mutual fund industry on a particular stock in a given quarter. We use FIT rather than the entire realized trading of mutual funds because FIT only captures those trades that are driven by the demand shifts from mutual fund investors, which are largely ignorant about fundamentals

Fund flows

Our main fi ndings are as follows.

We fi nd that returns of the six FF size and book-to-market portfolios are largely determined by the uninformed mutual fund flow-induced trades. Within each of the six FF portfolios, stocks with higher FIT have higher return performance.

Mutual funds' flow-driven trades can even revert the positive size and value premia. That is, within the same book-to-market portfolios, we find large-cap stocks with above-median FIT outperform small-cap stocks with below-median FIT. Within the same size portfolios, growth stocks with above-median FIT outperform value stocks with below-median FIT.

Value & Size Factor

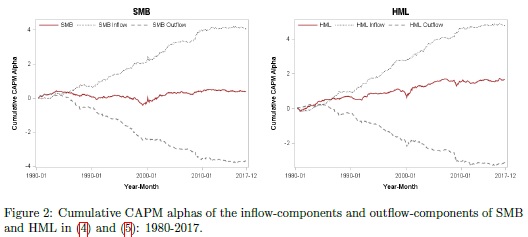
We decompose the value minus growth returns (HML) into two components: (i) value-inflow minus growth-outflow returns (HMLInflow) and (ii) value-outflow minus growth-inflow (HMLOutflow). We decompose the small minus big returns (SMB) into the sum of (i) small-inflow minus big-outflow returns (SMBInflow) and (ii) small-outflow minus big-inflow returns (SMBOutflow). Figure 2 report the average monthly returns and alphas of SMB, HML, and their inflow and outflow components.

In sum, we find that the size premium is due to the component of small-inflow stocks minus big-outflow stocks, while the value premium is due to the component of value-inflow stocks minus growth-outflow stocks."


Are you looking for more strategies to read about? Check http://quantpedia.com/Screener

Do you want to see performance of trading systems we described? Check http://quantpedia.com/Chart/Performance

Do you want to know more about us? Check http://quantpedia.com/Home/About


Follow us on:

Facebook: https://www.facebook.com/quantpedia/

Twitter: https://twitter.com/quantpedia


Continue reading

ETFs Increase Correlation of International Equity Markets

4.January 2019

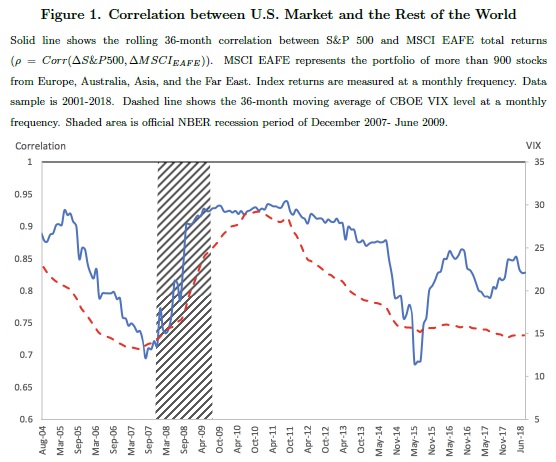
Everybody can see that international equity markets are highly correlated (and especially during past 10-15 years). A new interesting financial research paper shows that ETF arbitrage mechanism is one of the key channels through which U.S. shocks propagate to local economies leading to increased return correlation with the U.S. market:

Authors: Filippou, Gozluklu, Rozental

Title: ETF Arbitrage and International Correlation

Link: https://papers.ssrn.com/sol3/papers.cfm?abstract_id=3287417

Abstract:

Assets under management of exchange-traded funds (ETF) have been growing significantly, yet the majority of ETF trades still occur on U.S. exchanges. We show that investment decisions of both institutional and retail investors when trading international country ETFs are mostly driven by shocks related to U.S. fundamentals, measured by VIX, rather than local country risks. Investors react only to negative news about local economies. When U.S. economic uncertainty increases, investors leave the country ETF market and switch to Cash ETF products. We demonstrate that ETF arbitrage mechanism is one of the key channels through which U.S. shocks propagate to local economies leading to increased return correlation with the U.S. market both in time-series and cross-sectional dimensions. We find that countries with stronger ETF price-discovery and lower limits to arbitrage tend to have a higher comovement with the U.S. market.

Notable quotations from the academic research paper:

"Signi ficant innovations in financial products made international investments increasingly possible. Over the recent years, exchange-traded funds experienced a double-digit growth in assets under management. Nevertheless, the short-run interdependence of trading across major international ETFs and its association with local and global risk aversion remain understudied. While the majority of earlier studies focuses on direct eff ects of ETFs on the underlying securities in the basket that it tracks, we examine the indirect e ffect of ETF trading as a transmission mechanism of U.S. market shocks to foreign country equity markets.

We provide a view that as the U.S. accommodates the largest share of ETF global trading volume, its market conditions directly impact the decisions of country ETF investors. We show that international ETF market participants trade based on shocks related to U.S. fundamentals rather than local ones, and propagate those shocks to local markets. The shock transmission is performed via ETF arbitrage. We argue that such arbitrage activity is one of the few mechanisms responsible for increasing correlation between the U.S. market and the rest of the world.

This high cross-country correlation limits the ability of investors to cheaply diversify U.S. risk via international ETF investments. In addition, ETFs often provide an easier access to less integrated emerging markets or to countries were direct investments are costly (e.g., Brazil). However, the transmission of U.S. shocks to those markets limits the diversi fication bene ts of emerging market strategies.

correlation

We fi rst test the hypothesis whether country ETF investors react to changes in the U.S. rather than local economic uncertainty, as measured by CBOE Volatility Index (VIX). To this end, we compute order imbalances of retail investors (e.g., Boehmer, Jones, and Zhang, 2017), and trades of di fferent size, capturing high frequency trading (HFT) and institutional trades. Focusing on a large cross-section of 41 countries, we find strong association between ETF order imbalances and U.S. VIX, indicating that international investment decisions are mainly driven by the latter measure, rather than its local counterparts. For example, an increase in the U.S. VIX results in a selling pressure in the country ETF market. Such result is robust to di fferent volatility regimes and is consistent across di fferent types of investors. Asymmetric response analysis confi rms that country ETF investors only react to positive changes in local VIX, which correspond to negative news in the local markets. Moreover, we observe that, when reacting to an increase in U.S. uncertainty, investors switch to safer assets such as cash equivalent ETFs. We also find that investors respond to changes in U.S. political uncertainty di fferently than to economic uncertainty – they leave the U.S. stock market and buy international country-level ETFs. However, they do not react to local political uncertainty and the economic eff ect of political risk is much smaller than of changes in U.S. VIX.

In order to access the impact of ETF arbitrage on correlation of country returns with the U.S. market, we regress daily innovations in such correlation on a proxy for ETF arbitrage during di fferent volatility regimes. We provide time-series evidence that during periods of high volatility in the U.S., an increase in the arbitrage activity by the authorized participant (AP) (as measured by net share creation/redemption) results in an increase in innovation in such daily correlation. We argue that during periods of high volatility in the U.S. market, it is harder for investors to distinguish between noise and fundamental component of the order flow. Consequently, based on wake-up call hypothesis investor may treat U.S. shocks as relevant to their own country and consume such shocks via ETF arbitrage.

We also explain cross-country variation in return correlation with the U.S. market. According to Ben-David, Franzoni, and Moussawi (2018), non-fundamental shocks must be reversed over time. This suggests that if all shocks transmitted from ETF market to local economies were non-fundamental, ETF arbitrage would not contribute towards increased correlation. In contrast, if the price deviation from the NAV is due to faster incorporation of fundamental information in ETF market, then arbitrage should a ffect returns of underlying index, and such e ffect should not be reverted. If such fundamental information is common both to U.S. and local market, one should observe a higher correlation between them.

Consistent with the literature, we argue that ETF transmits both fundamental and noise shocks to the underlying economies. We show that countries that have a higher degree of price discovery in their ETFs have on average a higher correlation with the U.S. market. In these markets fundamental information gets incorporated into ETF prices faster than in the Net Asset Value (NAV), and therefore, market makers closely follow and learn from changes in ETF prices. This is the case when derivative securities price the underlying assets, rather than the other way around. In addition, in order for fundamental shocks to get transmitted to underlying markets, the authorised participants (AP) must engage in arbitrage activity. We find that the lower the limits to ETF arbitrage the higher is the correlation between a country and the U.S. market. Neither the international trade channel nor the business cycles alter this result."


Are you looking for more strategies to read about? Check http://quantpedia.com/Screener

Do you want to see an overview of our database of trading strategies? Check https://quantpedia.com/Chart

Do you want to know how we are searching new strategies? Check https://quantpedia.com/Home/How

Do you want to know more about us? Check http://quantpedia.com/Home/About


Follow us on:

Facebook: https://www.facebook.com/quantpedia/

Twitter: https://twitter.com/quantpedia
Continue reading
Subscription Form

Subscribe for Newsletter

 Be first to know, when we publish new content
logo
The Encyclopedia of Quantitative Trading Strategies

Log in

QuantPedia
Privacy Overview

This website uses cookies so that we can provide you with the best user experience possible. Cookie information is stored in your browser and performs functions such as recognising you when you return to our website and helping our team to understand which sections of the website you find most interesting and useful.