Volatility effect

Pre-Election Drift in the Stock Market

23.January 2020

There are many calendar / seasonal anomalies by which we can enhance our strategies to gain more return. One of the least frequent but still very interesting anomalies is for sure the Pre-Election Drift in the stock market in the United States. This year is the election year, and public discussion is getting more heated. The current president of the United States and candidate for re-election, Donald Trump, is a peculiar figure who split the population of the United States into two parts, ones who hate him and those who love him. We can probably expect volatile market moves as we will move closer to this year’s presidential election. But this post will not be about politics but about trading. In this post, we will try to uncover a pattern in historical data that shows significant market moves a few days before elections…

Authors: Vojtko, Cisar

Title: Pre-Election Drift in the Stock Market

Continue reading

Why Did Trend-Following Underperform Last Decade?

20.December 2019

Trend-following funds and strategies were extremely popular after the 2008/2009 crisis. They offered attractive performance, and diversification properties made them a nice addition to investor’s portfolios. Ten years later, “trend-following strategy” is not such a popular word. Strategies didn’t blow-up, but their performance was far from spectacular. What are the main reasons for that? Is it an increased correlation among markets? Are trend rules inefficient? An important recent academic study written by Babu, Hoffman, Levine, Ooi, Schroeder, and Stamelos (all from AQR Capital Management) analyzes trend-following performance for each decade in the last 140 years and uses three distinct factors: the magnitude of market moves, the efficacy of trend-following strategies at capturing profitability from market moves, and the degree of diversification across trends in a trend-following portfolio. They show that it’s the first factor (a lack of large risk-adjusted market moves, positive or negative) that had the biggest impact in the last decade. This suggests that trend-following strategies should be able to deliver better performance in the future if the size of the market moves reverts to levels more consistent with the long-term historical distribution of returns…

Authors: Babu, Hoffman, Levine, Ooi, Schroeder, and Stamelos

Title: You Can’t Always Trend When You Want

Continue reading

Quantitative Easing Increases Connectedness of Equities and Commodities

25.November 2019

Quantitative Easing policy in the US triggered a massive inflow of liquidity to financial markets. This liquidity, combined with the growing popularity of commodities as an asset class, is a cause for a higher inter-connectedness among equity and commodities markets. A recent academic study written by  Ordu-Akkaya and Soytas shows that commodities are not such a good diversifier as they used to be in the past. Moreover, commodity markets are also affected, as periods of higher equity volatility impact commodities significantly more …

Authors: Ordu-Akkaya, Soytas

Title: Unconventional Monetary Policy and Financialization of Commodities

Continue reading

Impact of Currency Volatility on Momentum and Carry Factors

5.November 2019

What is the impact of volatility (and changes in volatility) on popular Currency Momentum and Currency Carry strategies? That’s the topic of recent academic study written by Duc Hong Hoang, which decomposes foreign exchange volatility into two components, namely, secular (long-term) and transitory or mean-reverting (short-term) components. Long term component captures business cycle effects, while short term volatility usually represents funding tightness or shocks. Carry trade strategy is linked (and therefore partially predictable) to long-run volatility while momentum reacts mainly to short-run risks.

Author: Hoang

Title: Long Run and Short Run Risk Premium in Currency Market

Continue reading

Media Attention and the Low Volatility Effect

18.August 2019

The low volatility factor is a well-known example of a stock trading strategy that contradicts the classical CAPM model. A lot of researchers are trying to come up with an explanation for driving forces behind the volatility effect. One such popular explanation is the ‘attention-grabbing’ hypothesis – which suggests that low-volatility stocks are ‘boring’ and therefore require a premium relative to ‘glittering’ stocks that receive a lot of investor attention. Research paper written by Blitz, Huisman, Swinkels and van Vliet tests this theory and concludes that ‘attention-grabbing’ hypothesis can't be used to explain outperformance of low volatility stocks.

Related to: #7 – Low Volatility Factor Effect in Stocks

Authors: Blitz, Huisman, Swinkels, van Vliet

Title: Media Attention and the Volatility Effect

Continue reading

News Implied VIX Since The Year 1890

9.May 2019

We present an interesting academic paper with a methodology that allows estimating VIX (volatility risk) since the year 1890 …

Authors: Manela, Moreira

Title: News Implied Volatility and Disaster Concerns

Link: https://papers.ssrn.com/sol3/papers.cfm?abstract_id=2382197

Abstract:

We construct a text-based measure of uncertainty starting in 1890 using front-page articles of the Wall Street Journal. News implied volatility (NVIX) peaks during stock market crashes, times of policy-related uncertainty, world wars and financial crises. In US post-war data, periods when NVIX is high are followed by periods of above average stock returns, even after controlling for contemporaneous and forward-looking measures of stock market volatility. News coverage related to wars and government policy explains most of the time variation in risk premia our measure identifies. Over the longer 1890-2009 sample that includes the Great Depression and two world wars, high NVIX predicts high future returns in normal times, and rises just before transitions into economic disasters. The evidence is consistent with recent theories emphasizing time variation in rare disaster risk as a source of aggregate asset prices fluctuations.

Notable quotations from the academic research paper:

"This paper aims to quantify this “spirit of the times”, which after the dust settles is forgotten, and only hard data remains to describe the period. Specifically, our goal is to measure people’s perception of uncertainty about the future, and to use this measurement to investigate what types of uncertainty drive aggregate stock market risk premia.

We start from the idea that time-variation in the topics covered by the business press is a good proxy for the evolution of investors’ concerns regarding these topics.

We estimate a news-based measure of uncertainty based on the co-movement between the front-page coverage of the Wall Street Journal and options-implied volatility (VIX). We call this measure News Implied Volatility, or NVIX for short. NVIX has two useful features that allow us to further our understanding of the relationship between uncertainty and expected returns:

(i) it has a long time-series, extending back to the last decade of the nineteen century, covering periods of large economic turmoil, wars, government policy changes, and crises of various sorts;

(ii) its variation is interpretable and provides insight into the origins of risk variation.

The first feature enables us to study how compensation for risks reflected in newspaper coverage has fluctuated over time, and the second feature allows us to identify which kinds of risk were important to investors.

We rely on machine learning techniques to uncover information from this rich and unique text dataset. Specifically, we estimate the relationship between option prices and the frequency of words using Support Vector Regression. The key advantage of this method over Ordinary Least Squares is its ability to deal with a large feature space. We find that NVIX predicts VIX well out-of-sample, with a root mean squared error of 7.48 percentage points (R2 = 0.19). When we replicate our methodology with realized volatility instead of VIX, we find that it works well even as we go decades back in time, suggesting newspaper word-choice is fairly stable over this period.
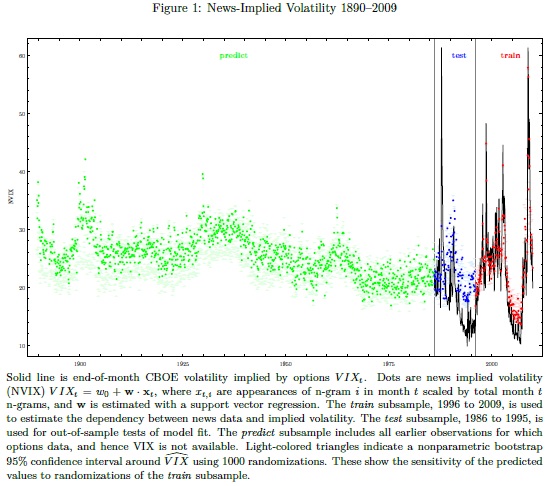
News Based VIX Index

We study whether fluctuations in NVIX encode information about equity risk premia. We begin by focusing on the post-war period commonly studied in the literature for which high-quality stock market data is available. We find strong evidence that times of greater investor uncertainty are followed by times of above average stock market returns. A one standard deviation increase in NVIX predicts annualized excess returns higher by 3.3 percentage points over the next year and 2.9 percentage points annually over the next two years.

Interpretability, a key feature of the text-based approach, enables us to investigate what type of news drive the ability of NVIX to predict returns. We decompose the text into five categories plausibly related (to a varying degree) to disaster concerns: war, financial intermediation, government policy, stock markets, and natural disasters. We find that a large part of the variation in risk premia is related to wars (53%) and government policy (27%). A substantial part of the time-series variation in risk premia NVIX identifies is driven by concerns tightly related to the type of events discussed in the rare disasters literature."


Are you looking for more strategies to read about? Check http://quantpedia.com/Screener

Do you want to see a performance of trading systems we described? Check http://quantpedia.com/Chart/Performance

Do you want to know more about us? Check http://quantpedia.com/Home/About


Follow us on:

Facebook: https://www.facebook.com/quantpedia/

Twitter: https://twitter.com/quantpedia


Continue reading

Subscribe for Newsletter

Be first to know, when we publish new content


    logo
    The Encyclopedia of Quantitative Trading Strategies

    Log in