
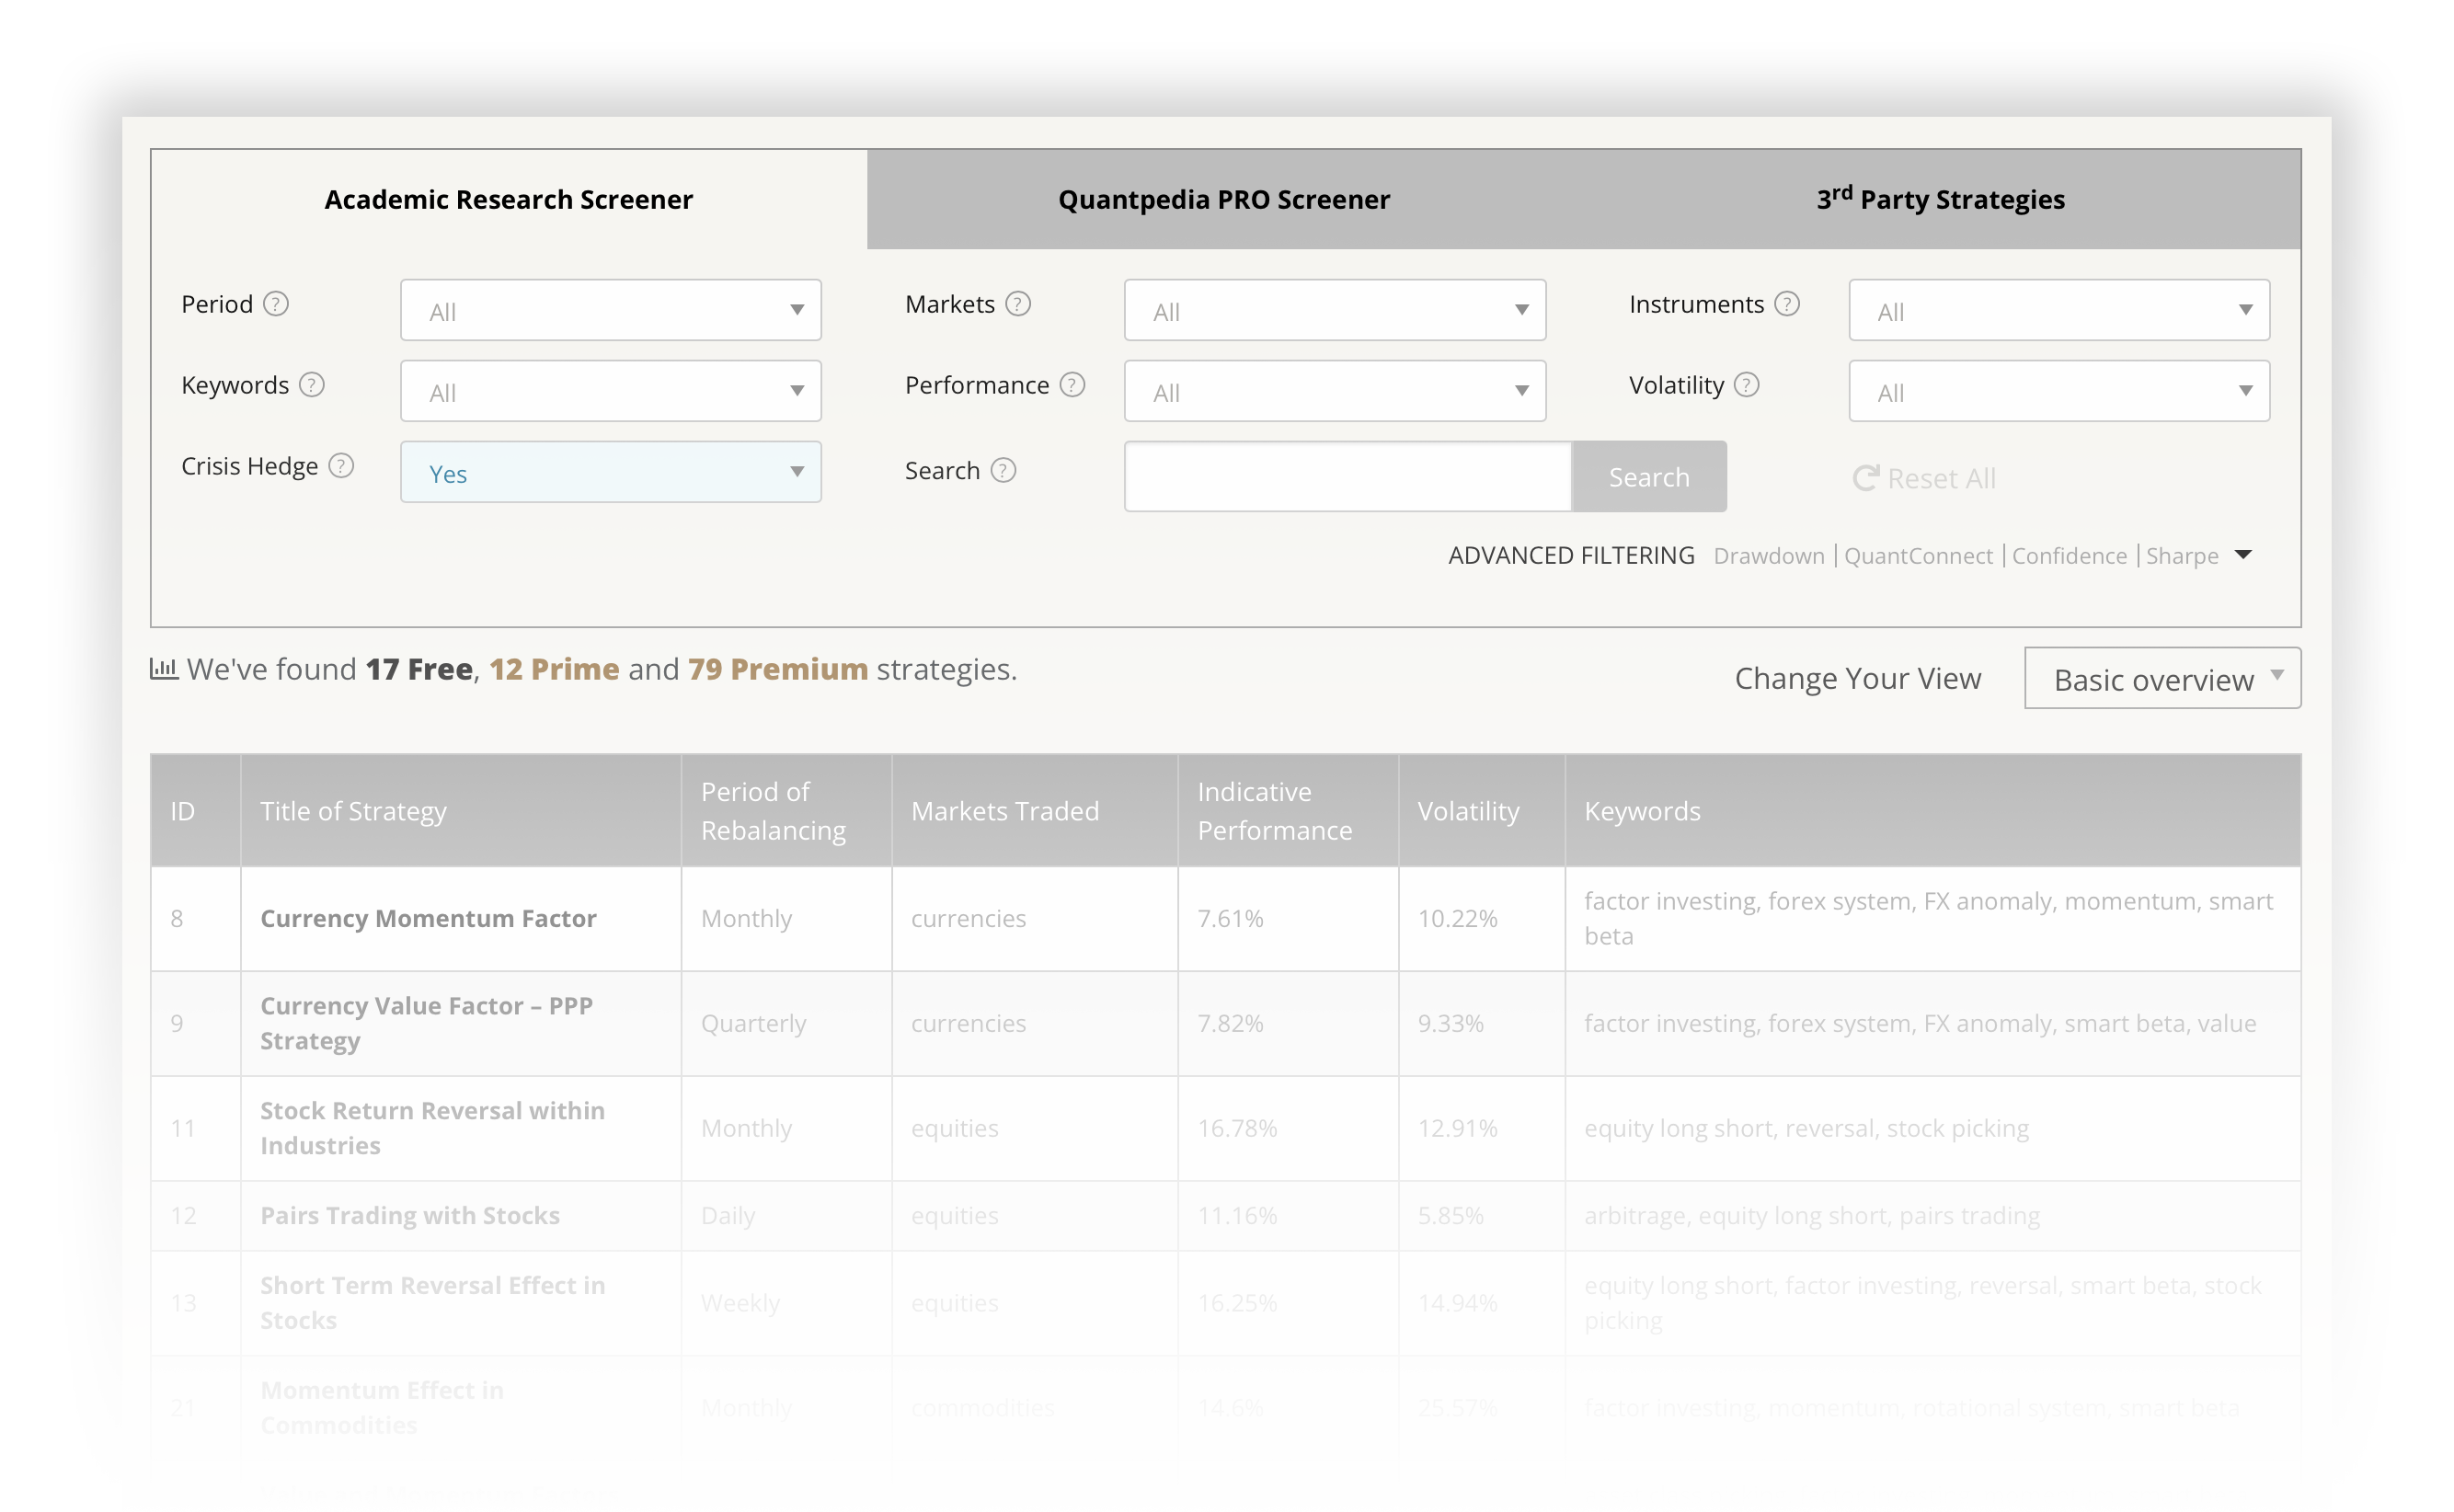
You will get access to an unrestricted Screener with over 700+ uncommon Premium trading strategy ideas. Complete with a short description, performance & risk characteristics, and links to source academic papers. New strategies are added to our database on a bi-weekly basis. Additionally, you will get over 2000+ links to academic research papers related to our Quantpedia strategies.
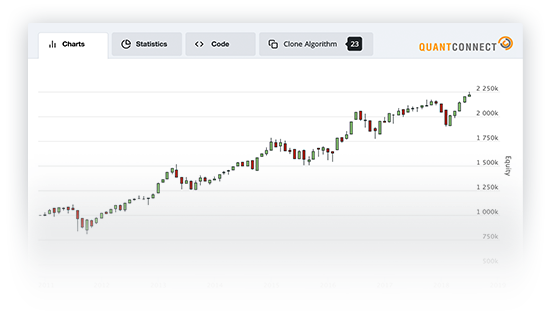

Moreover, you will have access to over 500+ out-of-sample backtests with equity curves, statistics and complete python code. Around 5+ new backtests are added into our database on a bi-weekly basis.

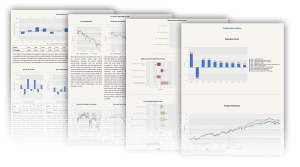
A powerful aspect of our Quantpedia offering is modeling and reporting tools. Over 300+ charts and tables in thematically focused reports in the Portfolio Analysis section offer an excellent opportunity to analyze and visualize your model portfolio and its performance, relationships, assembling, factor exposures, correlations, and market risks. New types of reports are added periodically every month.
Select your subscription plan
|
for PRIME
100+ Premium Strategies Essential Portfolio Modeling 1000s of Research Papers 30+ Quant Reports Regular New Features |
|
for PREMIUM
700+ Premium Strategies Essential Portfolio Modeling 1000s of Research Papers 30+ Quant Reports Regular New Features |
|
BEST VALUE for PRO
700+ Premium Strategies Full Portfolio Modeling 1000s of Research Papers 30+ Quant Reports Regular New Features |
View full feature comparison
| PRIME | PREMIUM | PRO | |
|---|---|---|---|
| Quantpedia Premium strategies | – access to 100+ essential Quantpedia Premium strategies (out of nearly 700+) – necessary tactical asset allocation, simple market timing and seasonality strategies |
– access to all 700+ Quantpedia Premium strategies & 1000s of papers – all arbitrage, asset allocation, stock picking, crypto, trend-following, and much much more |
– access to all 700+ Quantpedia Premium strategies & 1000s of papers – all arbitrage, asset allocation, stock picking, crypto, trend-following, and much much more |
| Database update | (irregularly) |
, regular updates – approximately 10-15 new strategies added on a monthly basis |
, regular updates – approximately 10-15 new strategies added on a monthly basis |
| Out-of-sample Screening | – included in ~600 Quantpedia Premium strategies – for approximately ~400 of them, the code and backtest are updated on a monthly basis |
||
| Portfolio Modeling | – 40 most used ETFs for asset allocation modeling and ~100 essential Quantpedia Premium strategies are available for portfolio modeling in Portfolio Manager |
– 40 most used ETFs for asset allocation modeling and ~100 essential Quantpedia Premium strategies are available for portfolio modeling in Portfolio Manager |
– over 200 most liquid ETFs, 40 cryptocurrencies, approximately 400 Quantpedia Premium strategies, ~100 3rd party factors (Fama & French etc.) |
| Reporting | 7 essential Quantpedia Pro reports included |
7 essential Quantpedia Pro reports included |
Complete list of all ~40 Quantpedia Pro reports |
| Reports | – Basic Overview – Correlation Analysis – Equity Crisis Analysis – ETF Replication – 100yrs Portfolio Analysis – One Day Shocks & Historical Events – 100yrs Market States Analysis |
– Basic Overview – Correlation Analysis – Equity Crisis Analysis – ETF Replication – 100yrs Portfolio Analysis – One Day Shocks & Historical Events – 100yrs Market States Analysis |
– Multi Factor Analysis Models – Equity, Bonds, Commodity Crisis Analysis & Hedging – Complementary Strategies, ETF Replications – Seasonality, Trend, Reversal, Automated Trading Edge Analysis – VaR, Correlation, Clustering, Monte Carlo, Kelly & Optimal F – Markowitz, CPPI, Risk Parity, Volatility Targeting – Cross Sectional & Time Series Momentum – Portfolio Factor Cycles, Market Phases Analysis – 100yrs Portfolio Analysis, Historical Events, 100yrs Market States Analysis – Portfolio Rebalancing, Strategy Grading |
| Upload & analysis of own equity curves | – users can upload an unrestricted number of their own equity curves for analysis |
||
| New Quantpedia Pro reports | – new Quantpedia Pro reports are regularly added on a monthly basis |
||
| Benchmarking | – custom benchmarks that consist of ETFs, Quantpedia Premium strategies and the user’s own equity curves can be built – benchmarks are then used in Quantpedia Pro reports |
||
| Market Overview | – gain insight into the current state of the broad universe of quantitative trading strategies |
||
| AI Chatbot | – personal quant assistent trained on our extensive database of Quantpedia strategies |
||
Would you like to buy more accounts for a whole team or whole company? Contact us for an enterprise pricing offer.
Once again, what’s the difference between Quantpedia Prime, Premium, and Quantpedia Pro?
The Quantpedia Prime plan is intended for aspirational quants and individual systematic investors. Users will get access to a subset of Quantpedia Premium trading strategies (100+) that are easier to execute and understand, plus access to essential modeling tools and Quantpedia Pro reports.
The Quantpedia Premium is a product for more adept quants, who will get unrestricted access to our Screener and, therefore, access to all Quantpedia Premium strategies (700+), complete with a short description, performance & risk characteristics, and links to source academic papers. Additionally, users will have access to the same essential portfolio modeling tools as in the case of Quantpedia Prime.
Quantpedia Pro is the analytical platform built on top of the Quantpedia Premium trading strategies. Therefore, only Quantpedia Pro users have access to all of the content available in Quantpedia Premium (all 700+ strategies) plus all additional advanced features, as unrestricted multi-factor multi-strategy portfolio builder with custom benchmarks and 30+ Quantpedia Pro reports like factor regression analysis, risk scenarios, VaR, clustering, Monte Carlo, tests of alternative weighting schemes etc..
How does the Portfolio Manager / Portfolio Analysis work?
Quantpedia Pro reports allow you to investigate your model multi-factor multi-strategy portfolios. You can create your portfolio in the Portfolio Manager section and examine over a 300+ different charts and tables in multiple quantitative reports in Portfolio Analysis section.
I do not want / can’t pay via credit or debit card or via PayPal. Is there any other option? Alternatively, do you accept cryptocurrency payments?
Just contact us via our contact form. We can send you an invoice and you can pay via bank/wire transfer. Alternatively, we accept cryptocurrency payments via PayPal, or you can contact us for other forms of crypto transactions.
I have Quantpedia Prime or Premium account, and I would like to upgrade it to a higher plan. How can I do it?
Just contact us via our contact form. We will send you a procedure for the upgrade. You will pay just the difference between the prices of the two selected plans.
What happens to my account at the end of my Prime / Premium / Pro period? Will my Prime / Premium / Pro expire, or will it be automatically renewed?
Your account will still exist after the end of your subscription period, but you will lose access to all our Prime / Premium / Pro content (Premium strategies, back-tests, etc.). Your Prime / Premium / Pro subscription will NOT be automatically renewed after the end of the pre-paid period.
I have a question which is not in FAQ.
Just send it to us via contact form, we answer all questions…