![]()
![]()
![]()
![]()
![]()
![]()
![]()
![]()
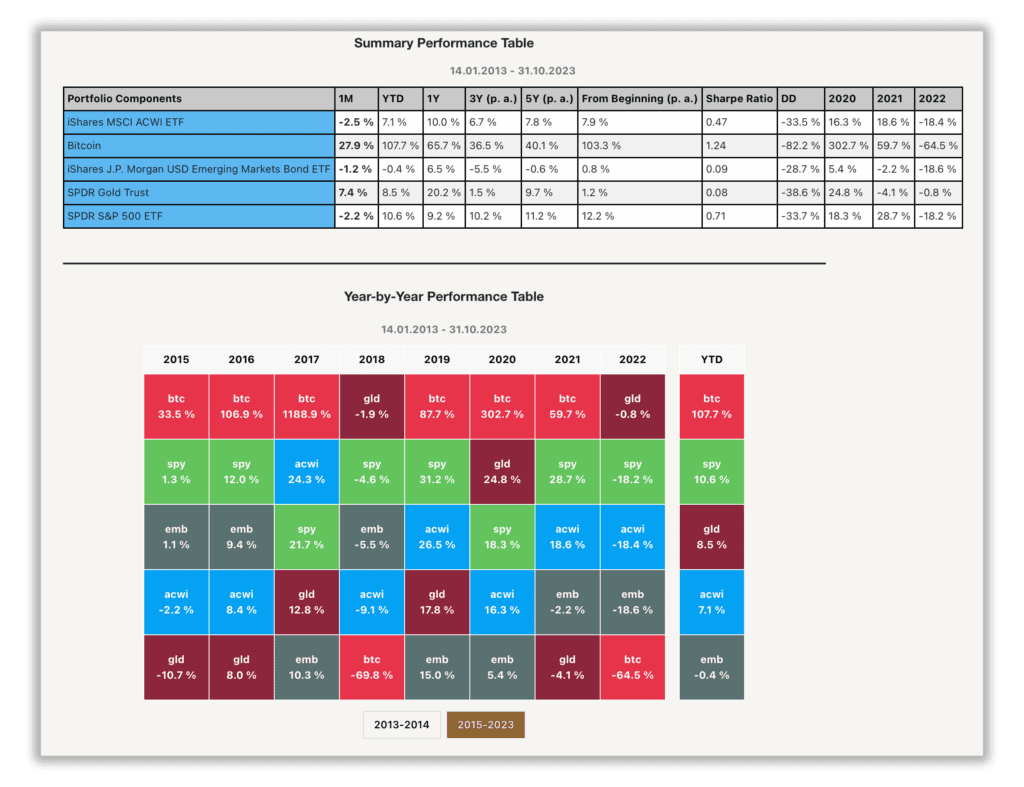
Quantpedia Pro platform gives you the opportunity to investigate your model multi-factor multi-strategy portfolios in hundreds of different charts and tables in over 40 quantitative reports in our Portfolio Analysis section.
Essential
Reports
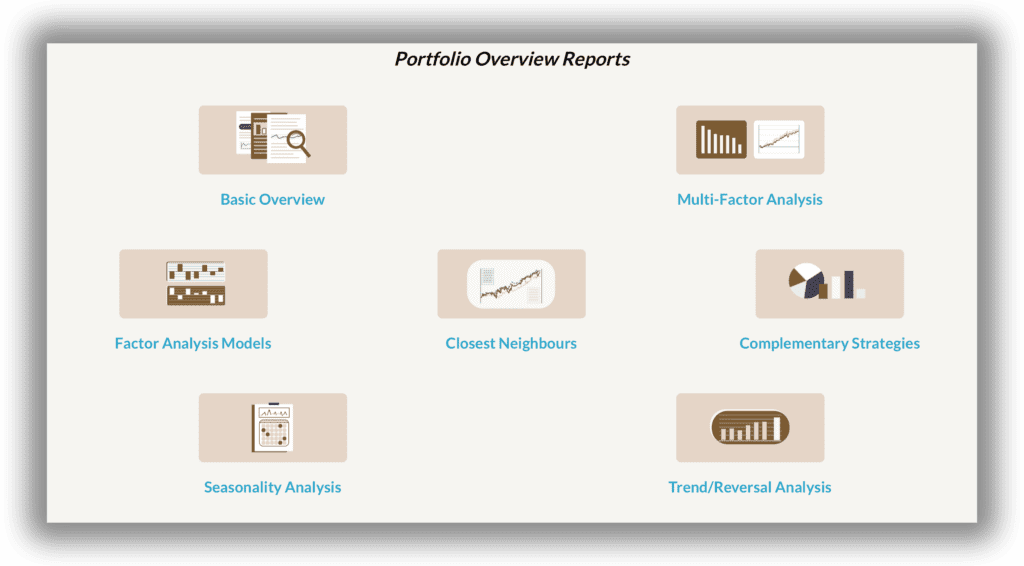
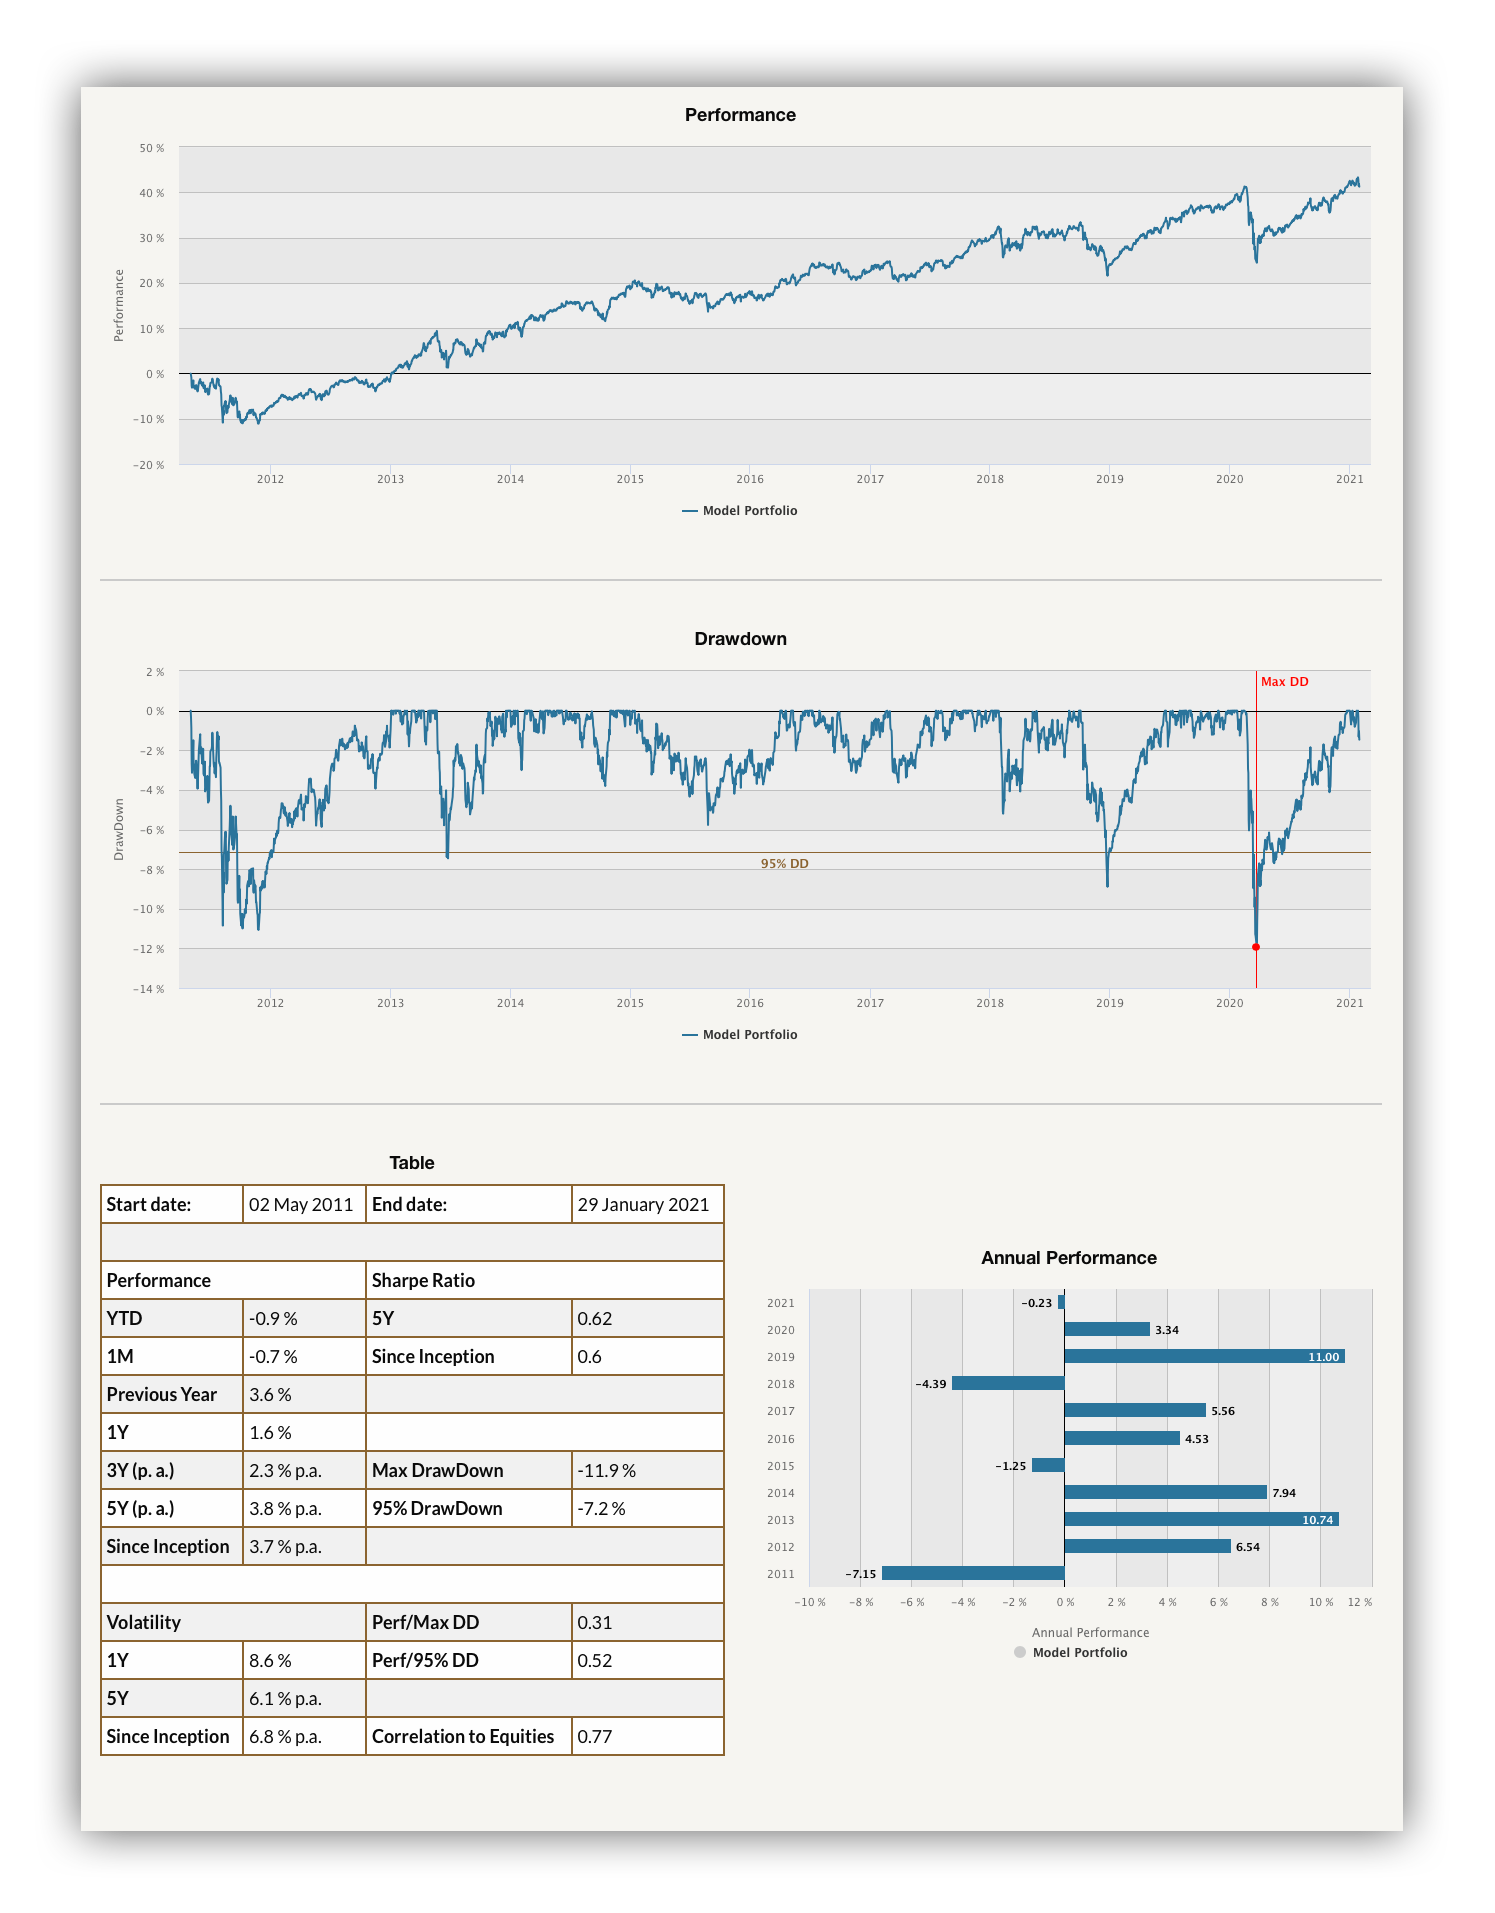
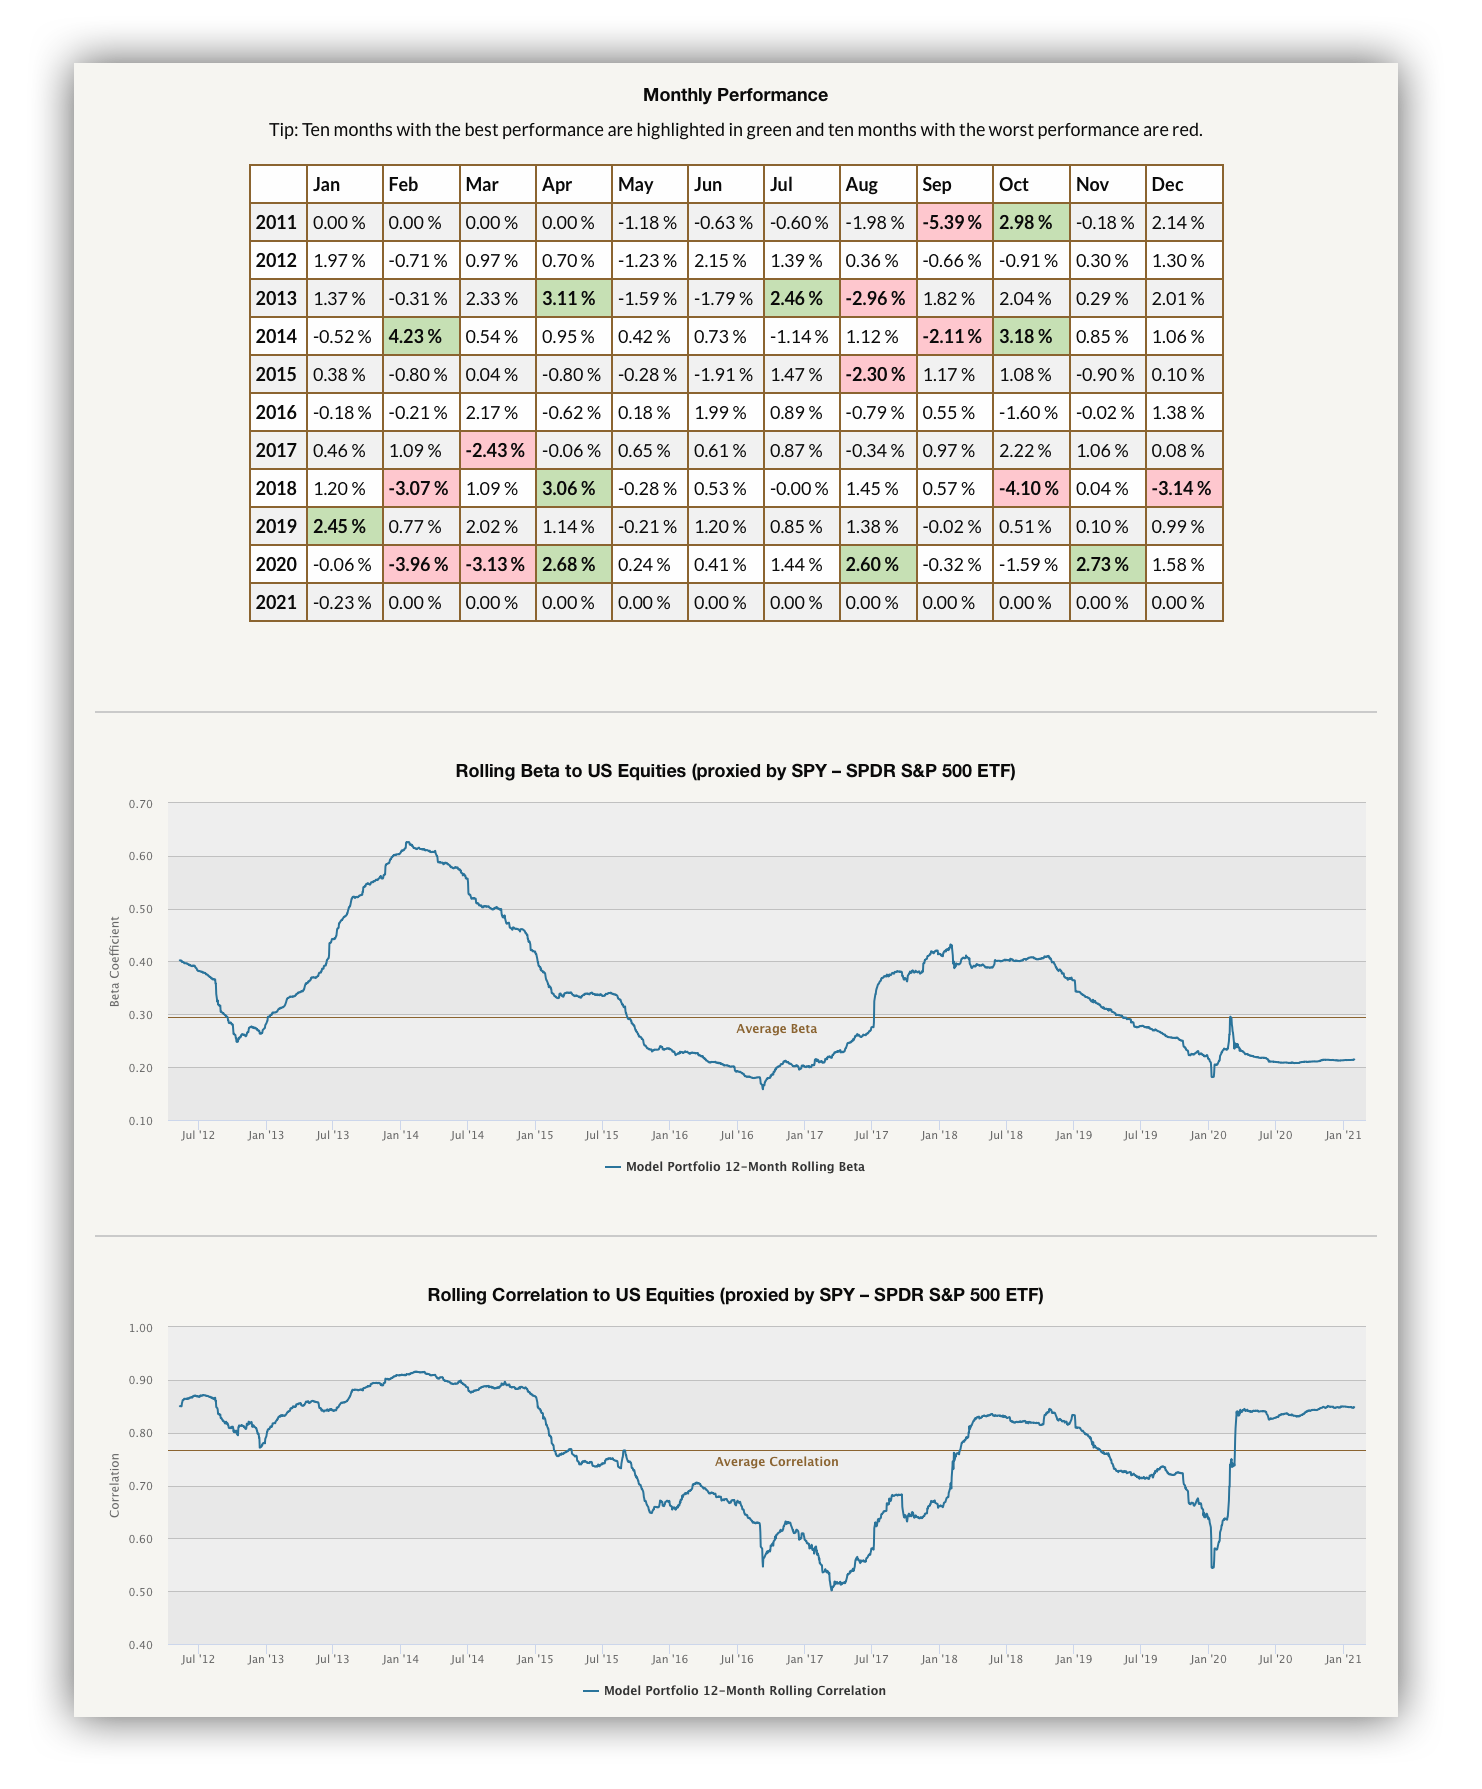
Portfolio Overview Reports
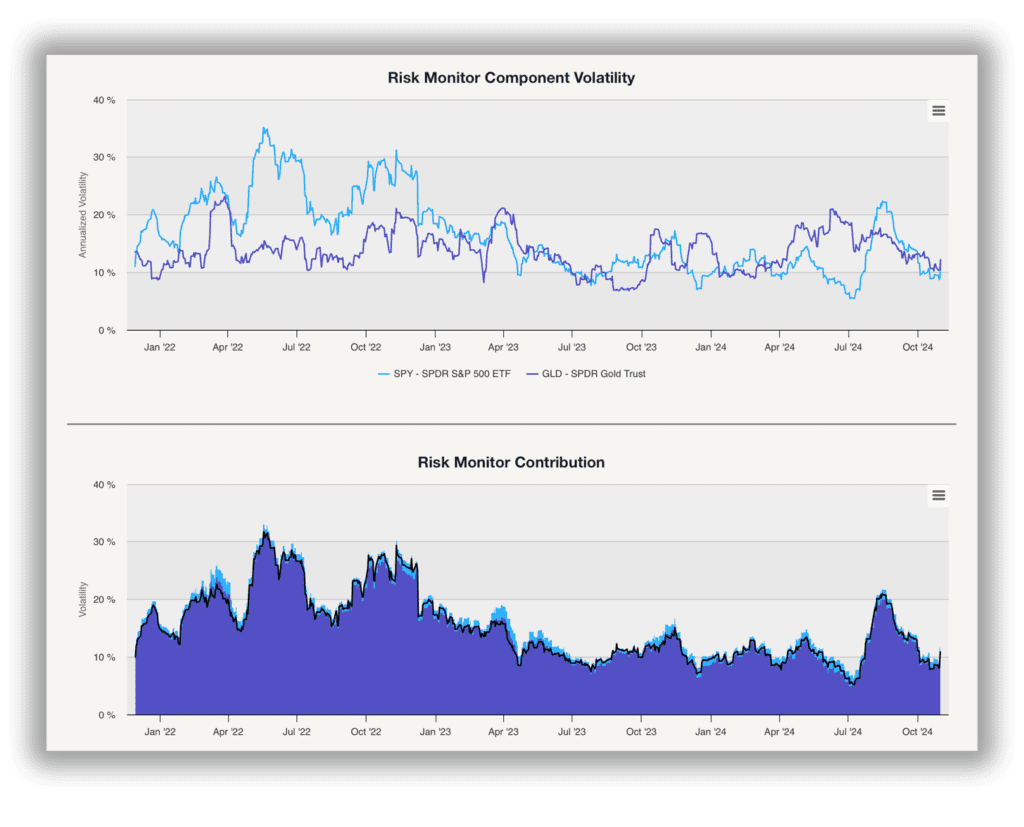
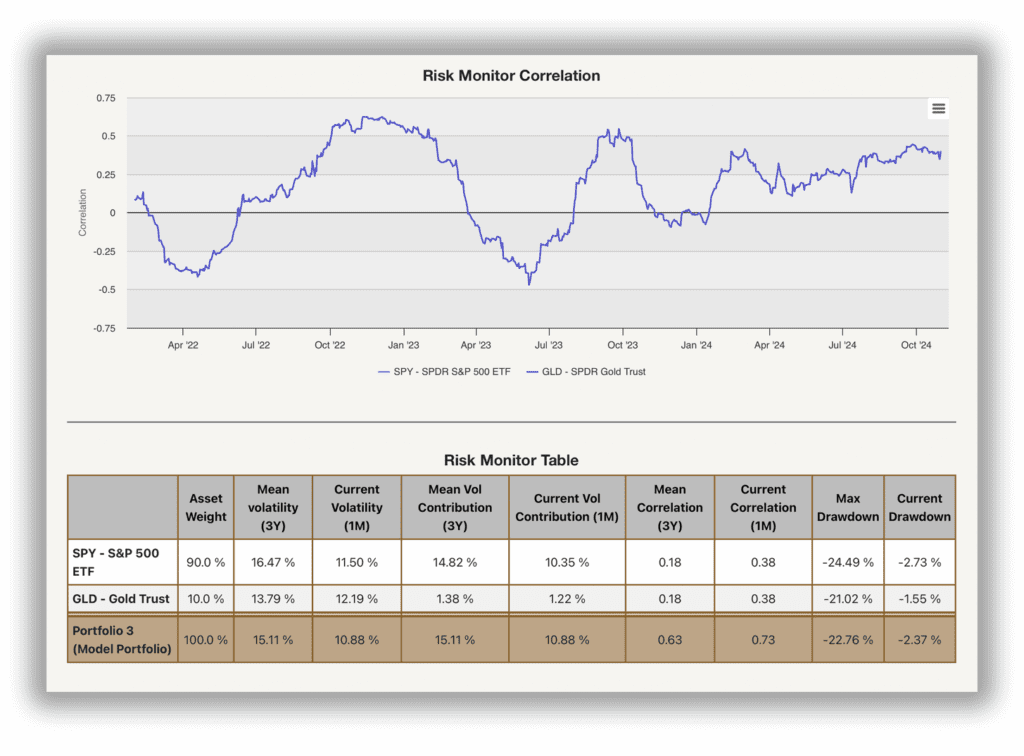
Risk Management Reports


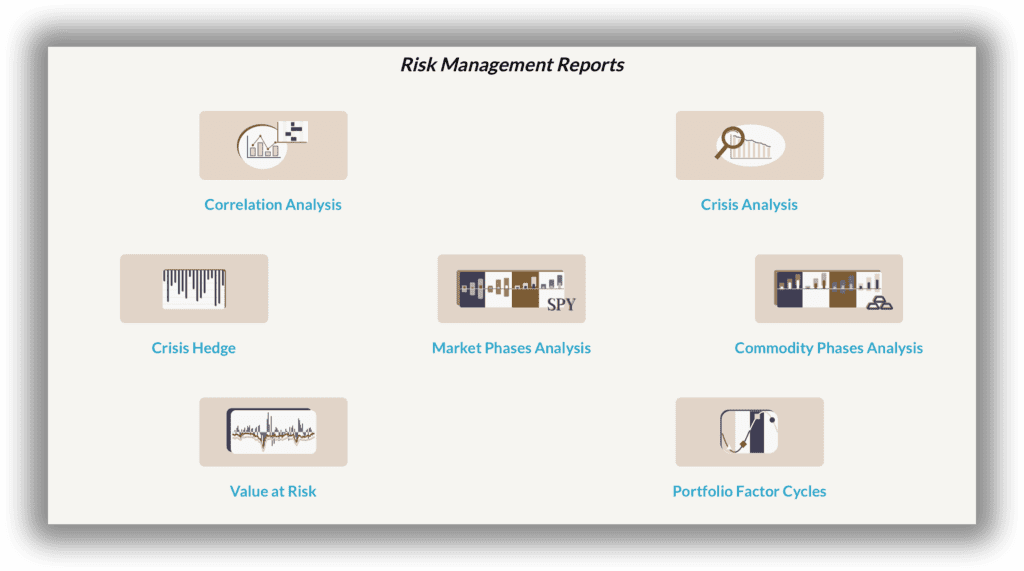
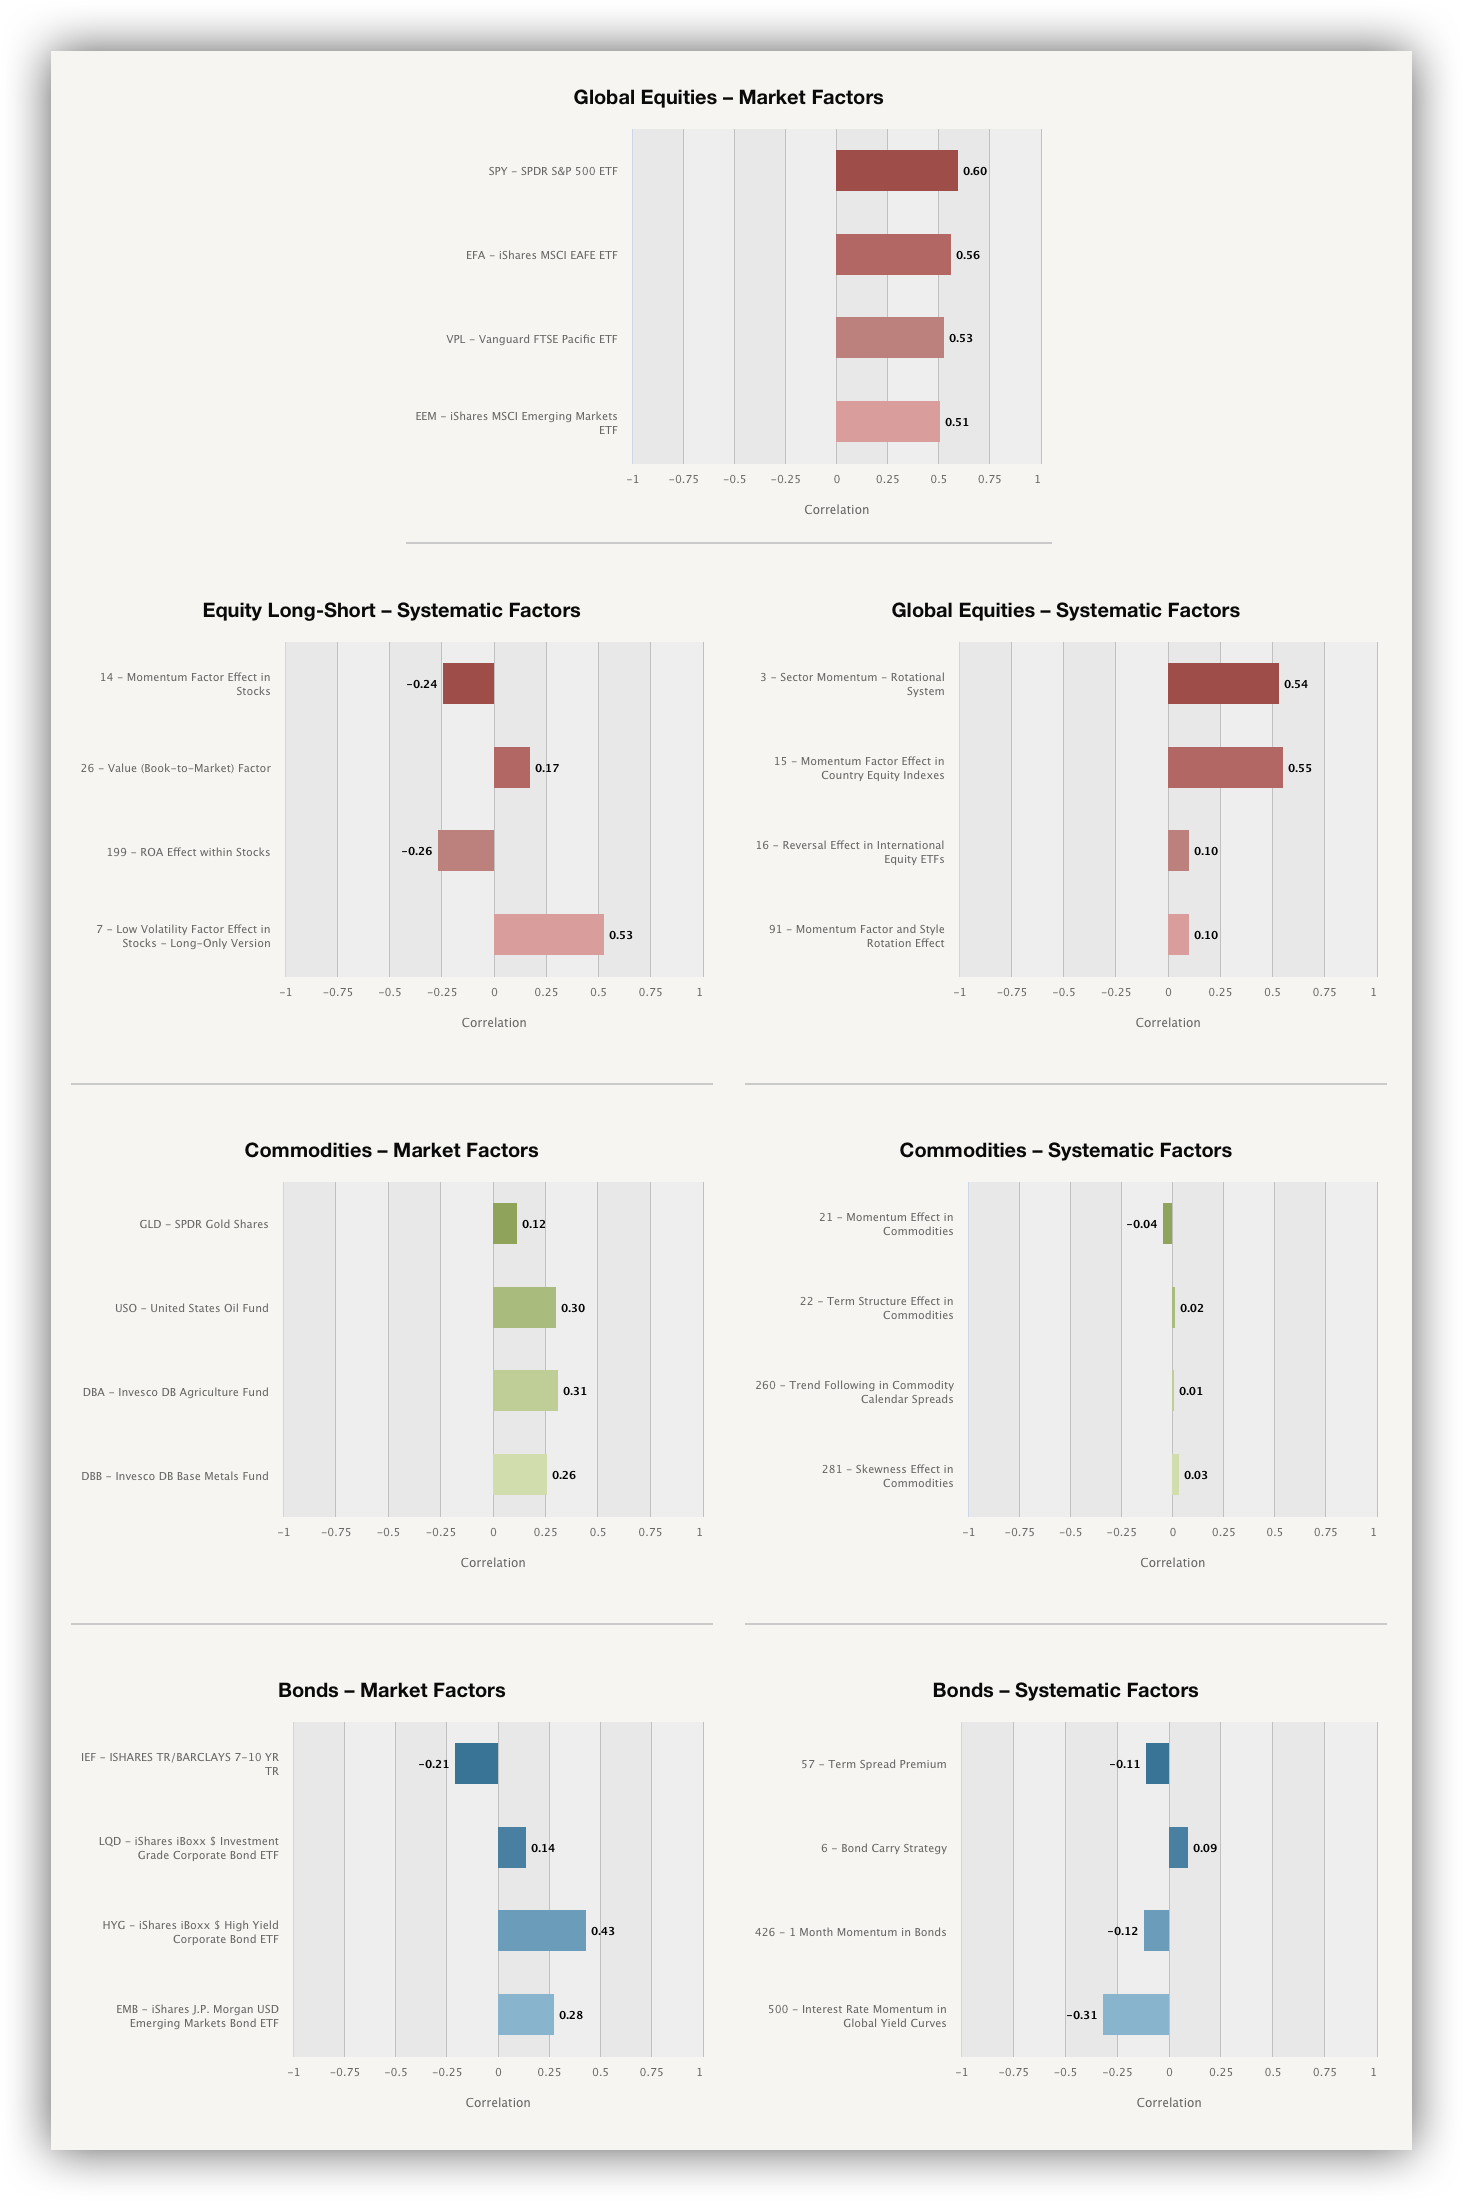
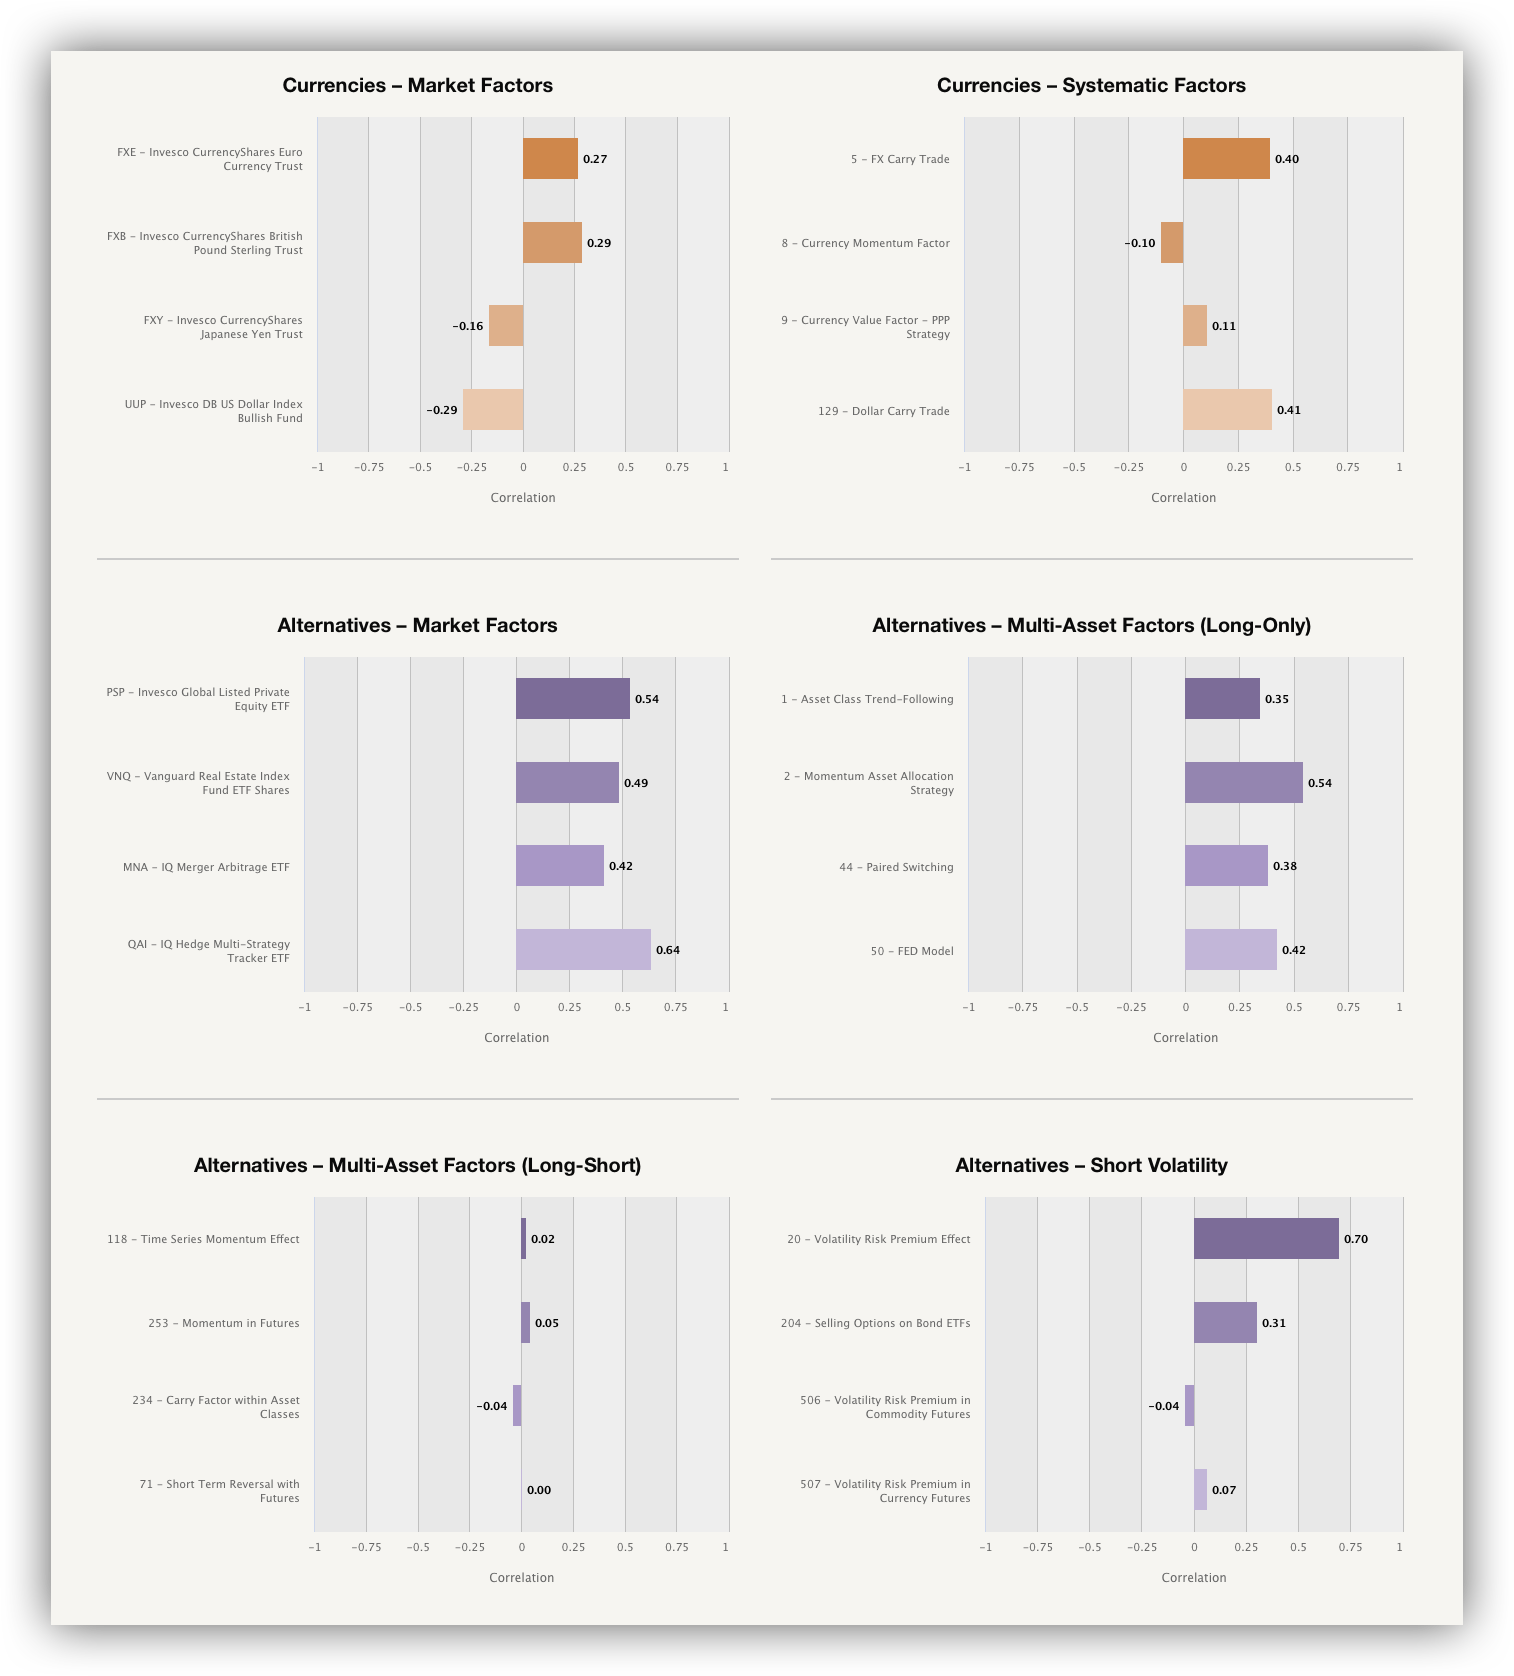
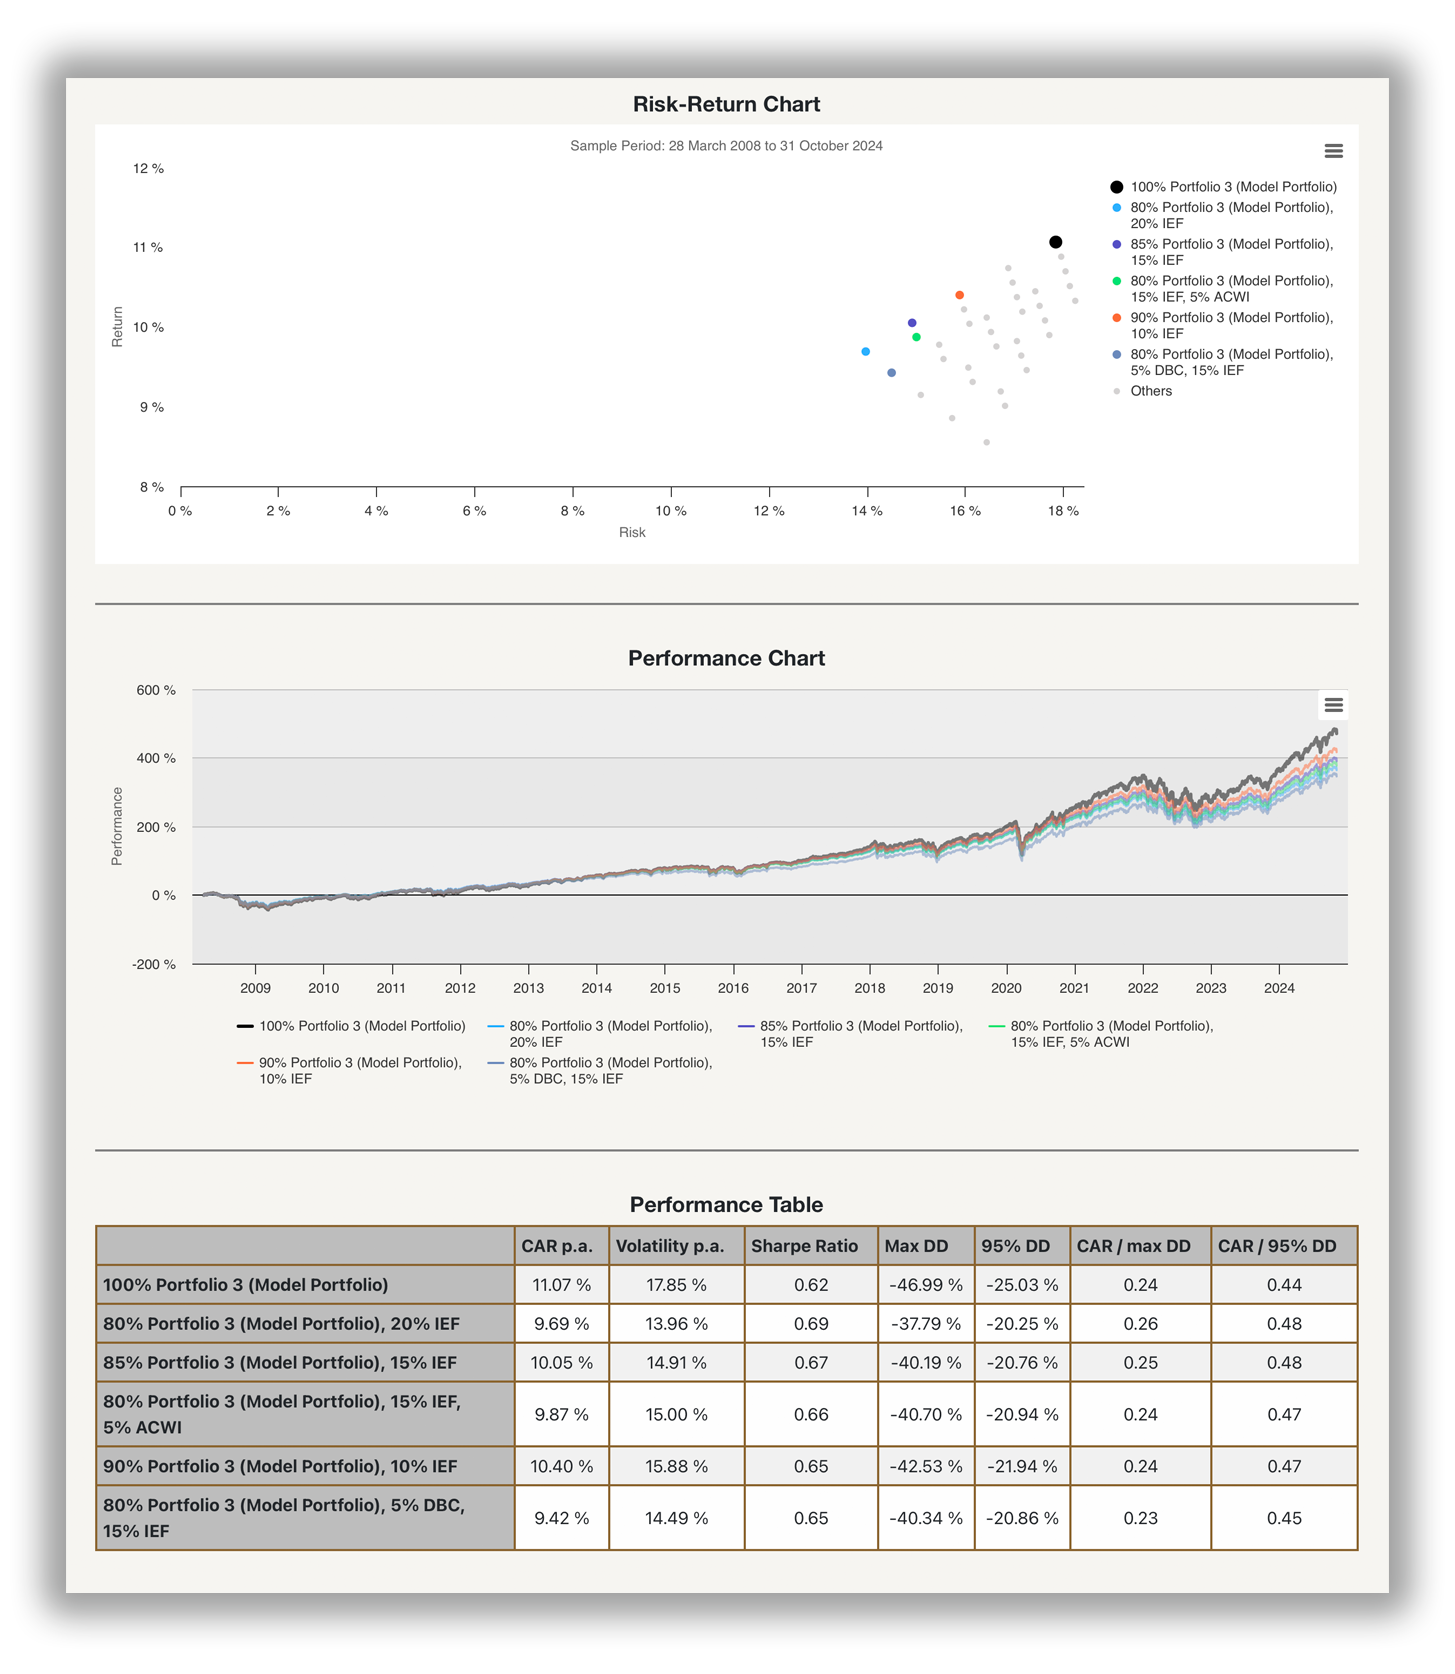
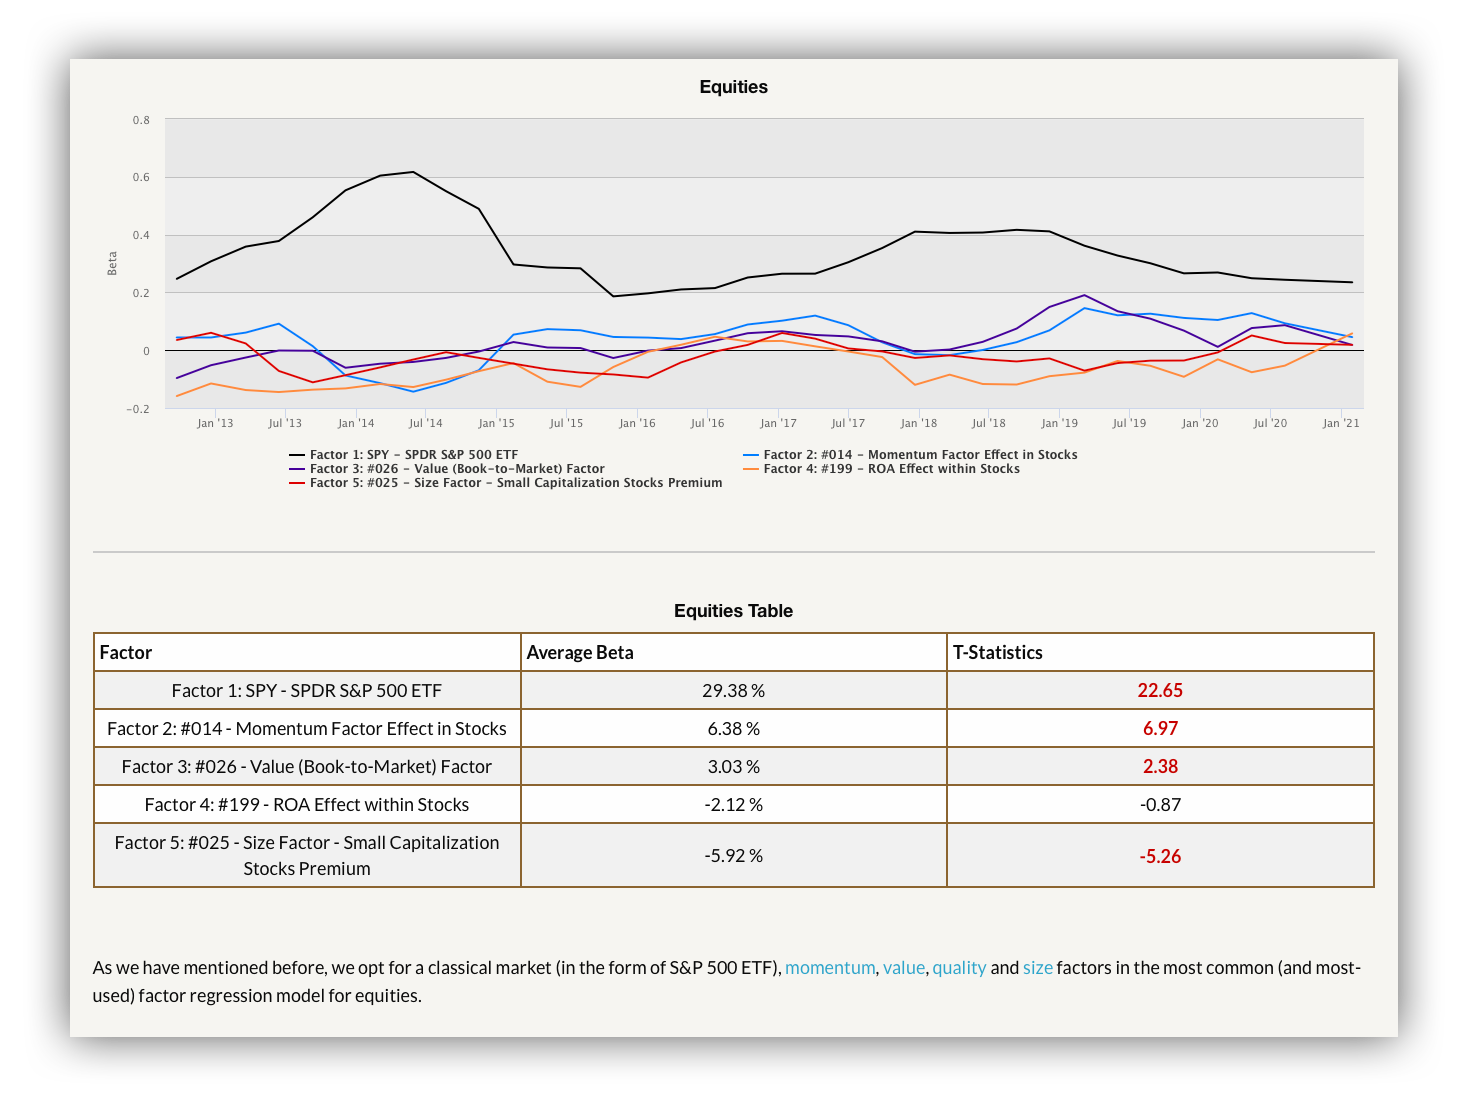
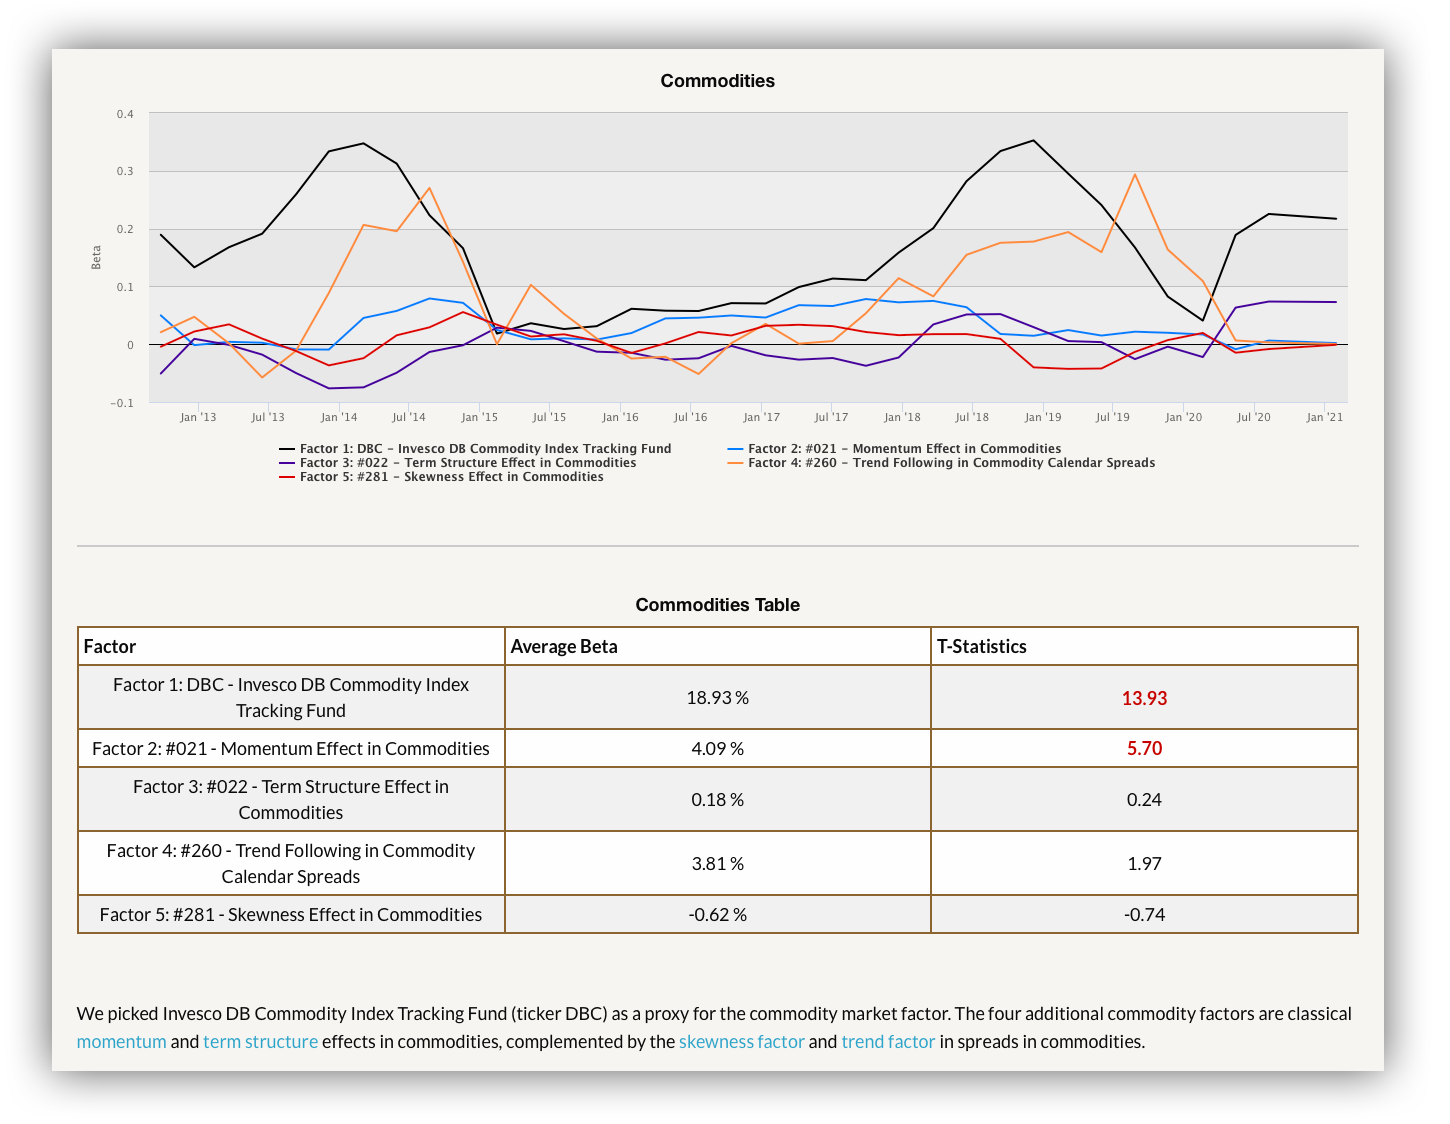
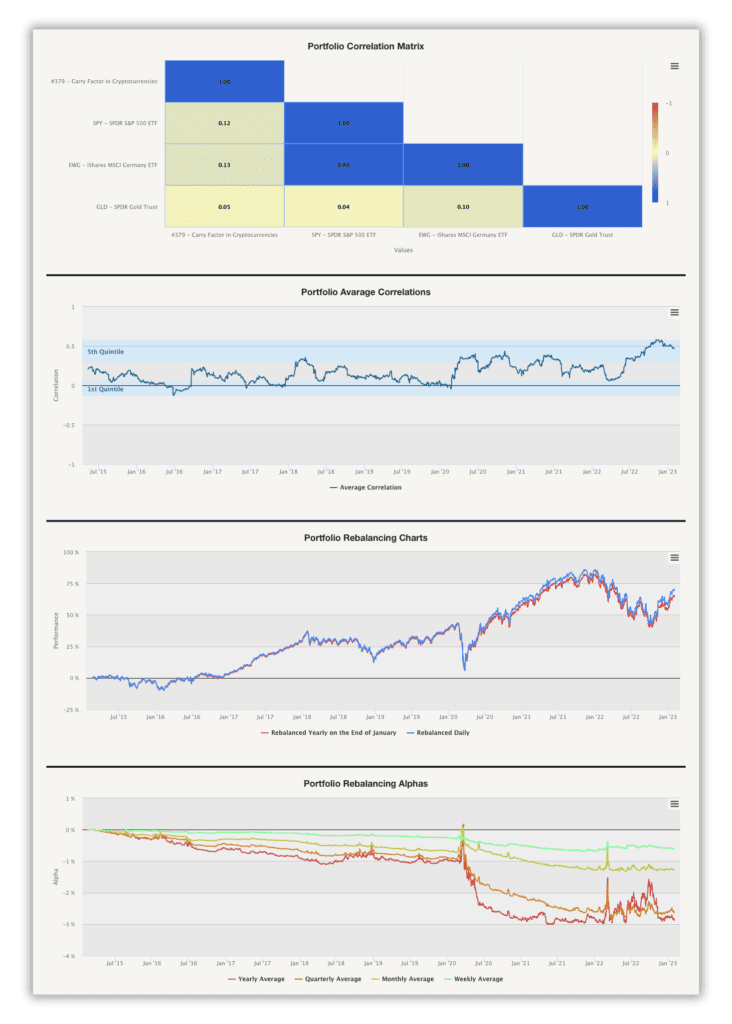
Correlation Analysis – review your portfolio’s correlation structure in connection with the most common market and systematic equity, fixed income, currency, commodity, and alternative factors. Visit correlation analysis case study subpage to learn more.

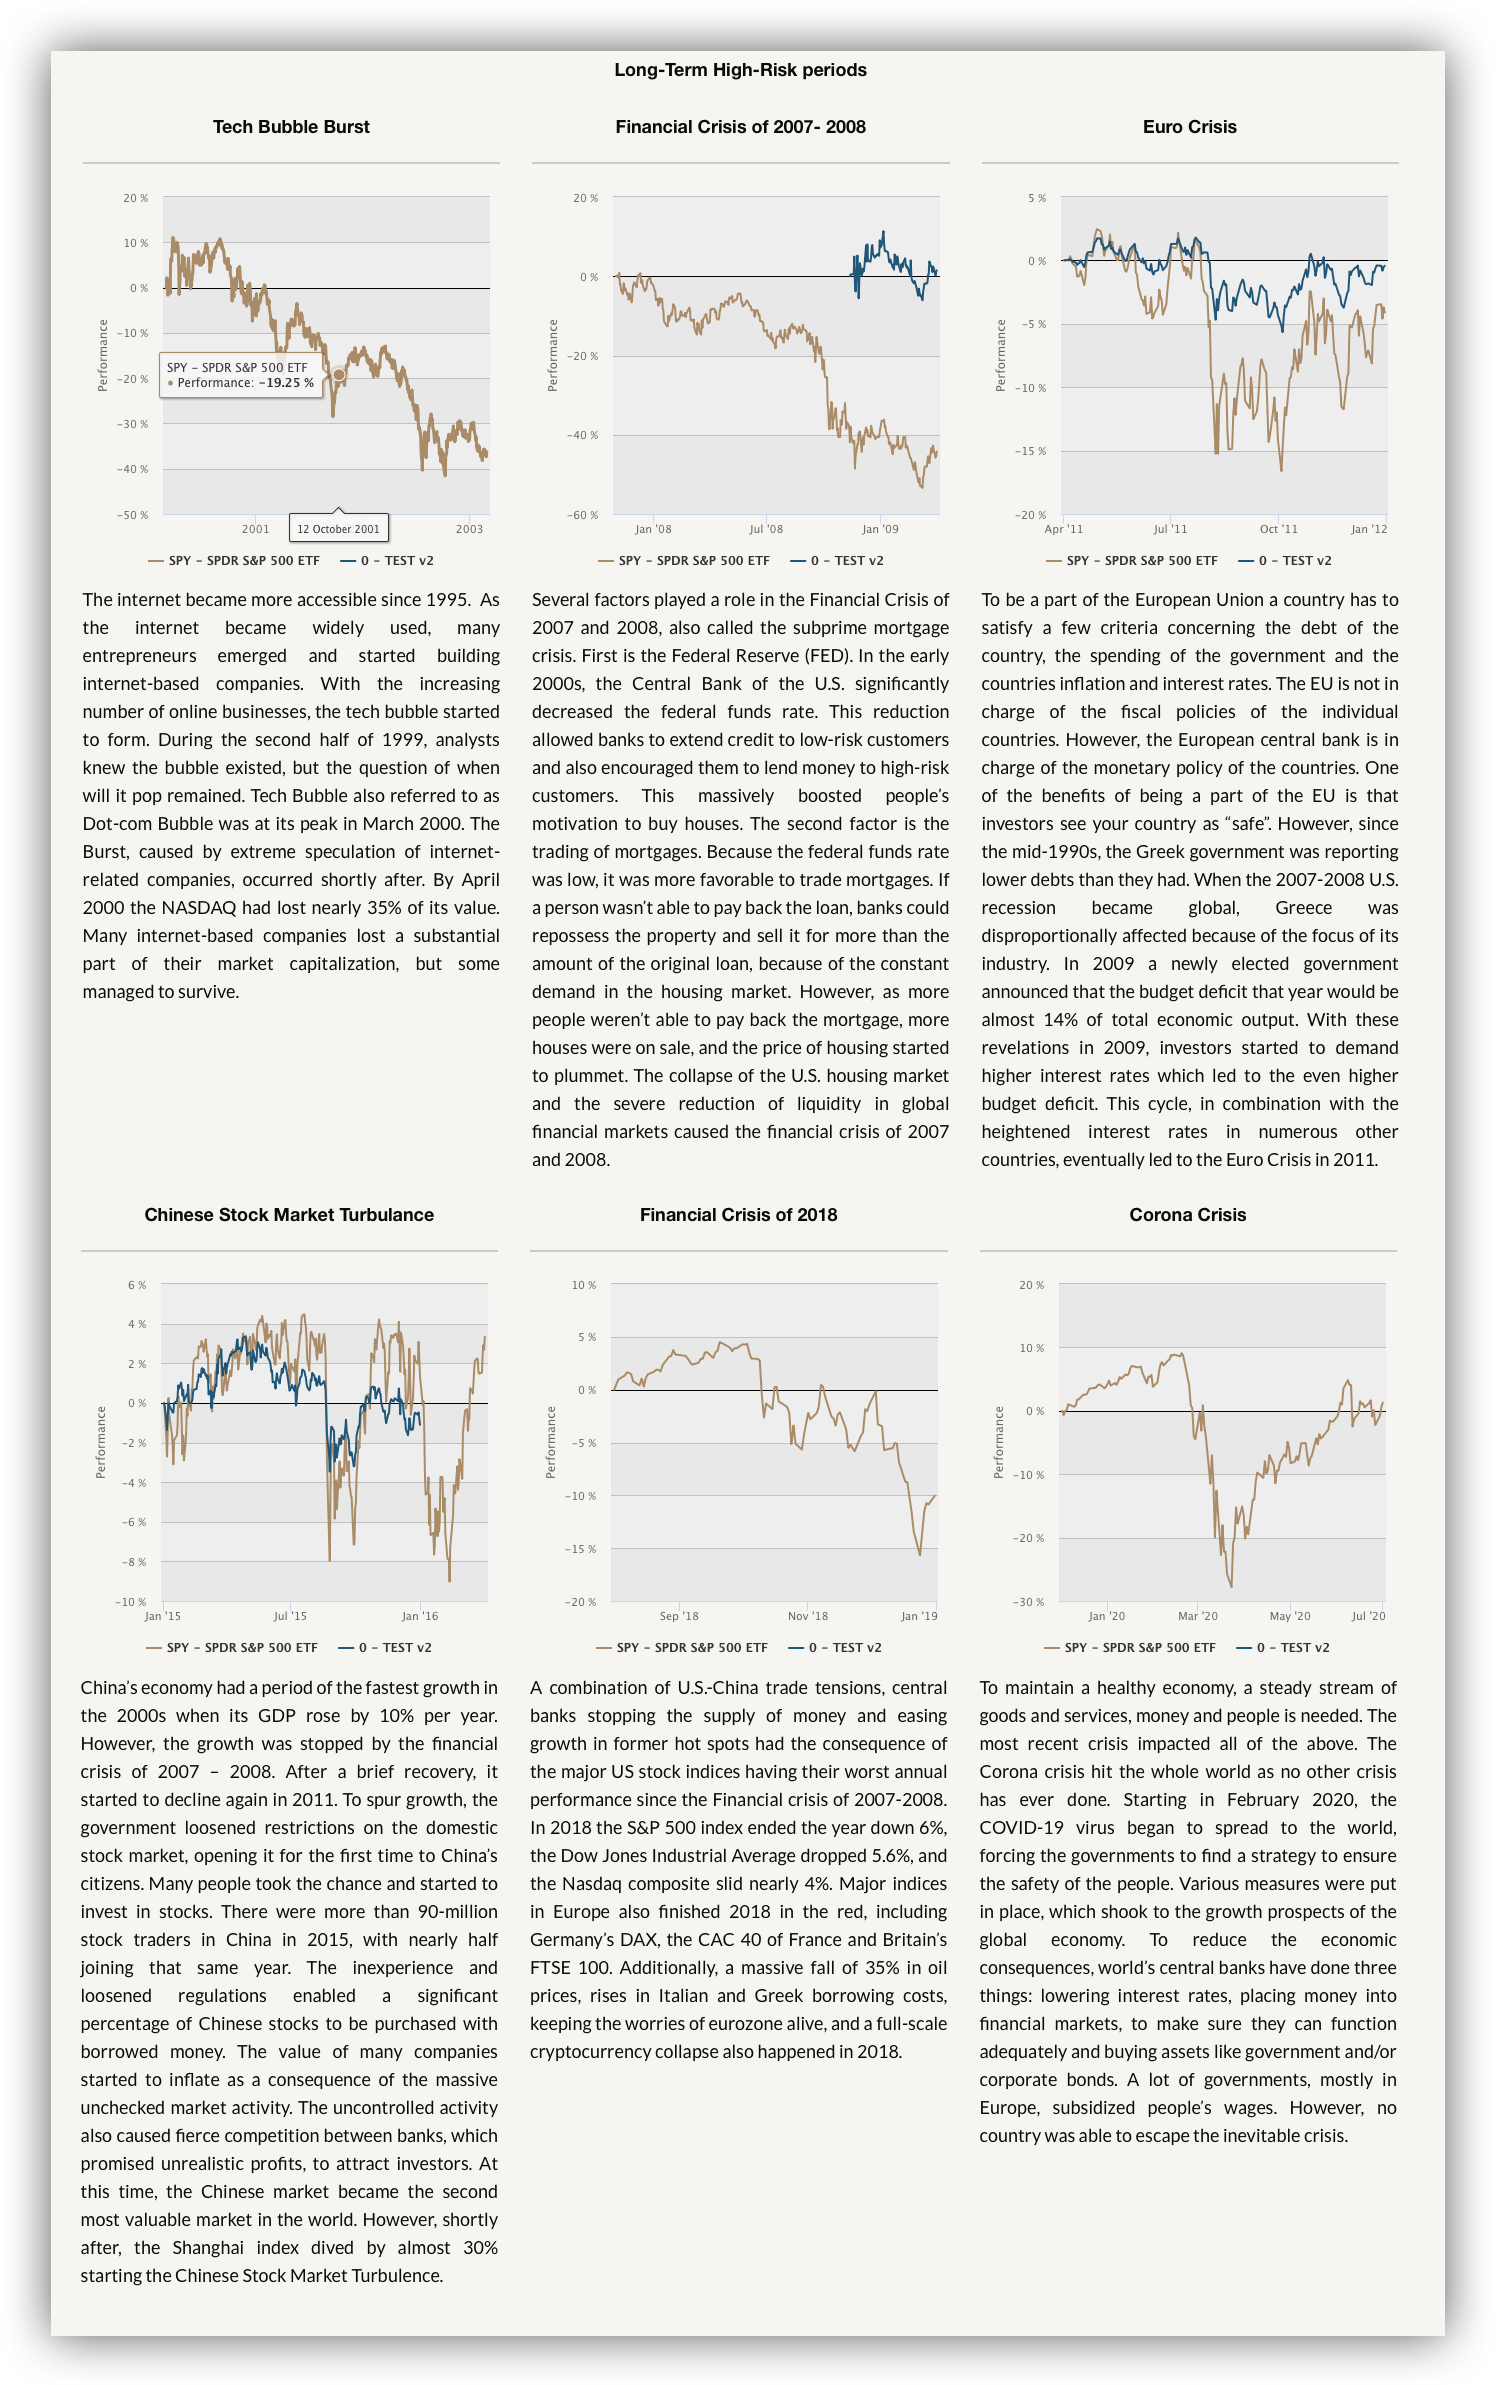
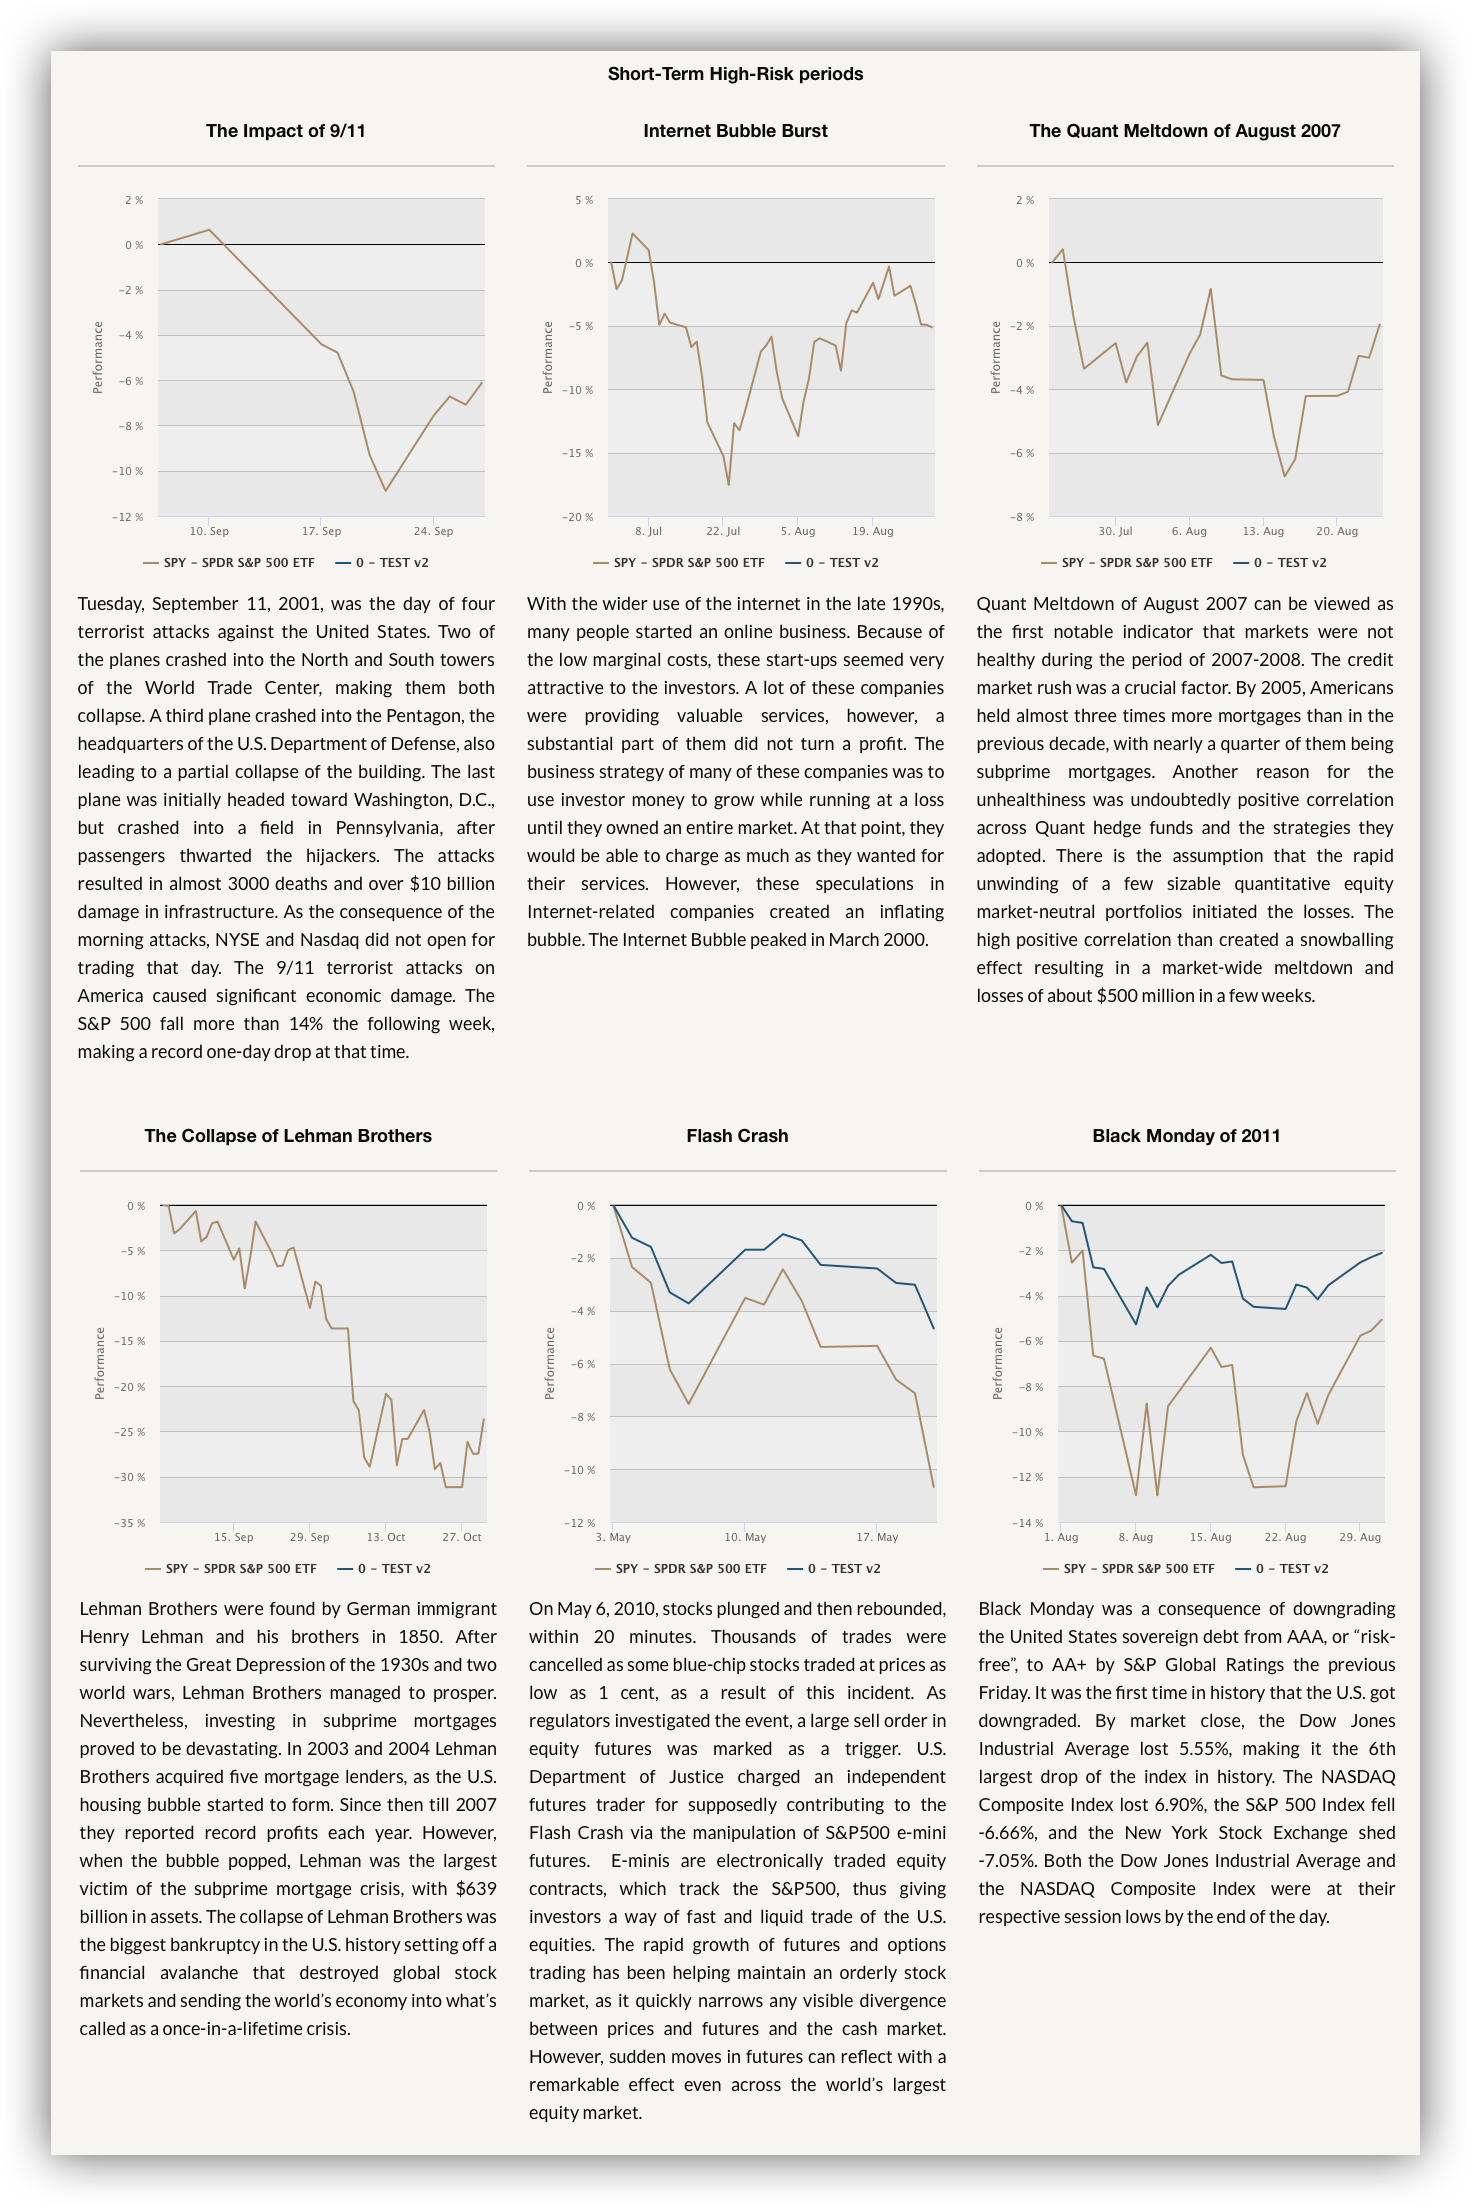
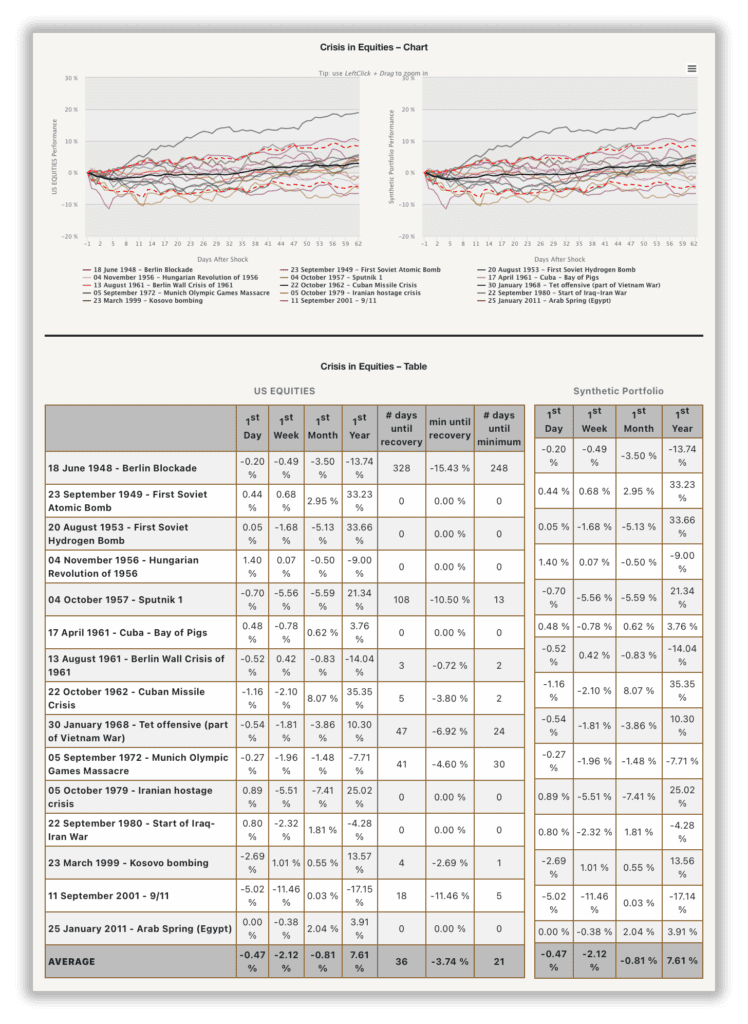
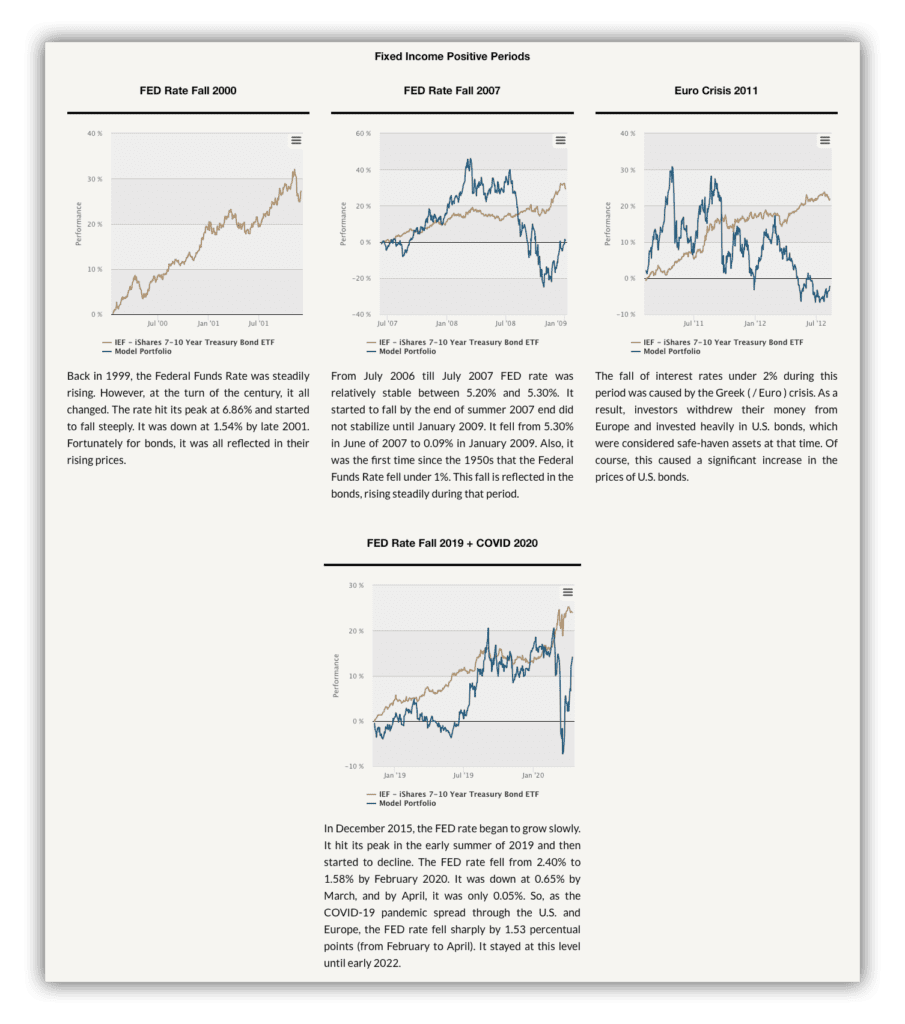
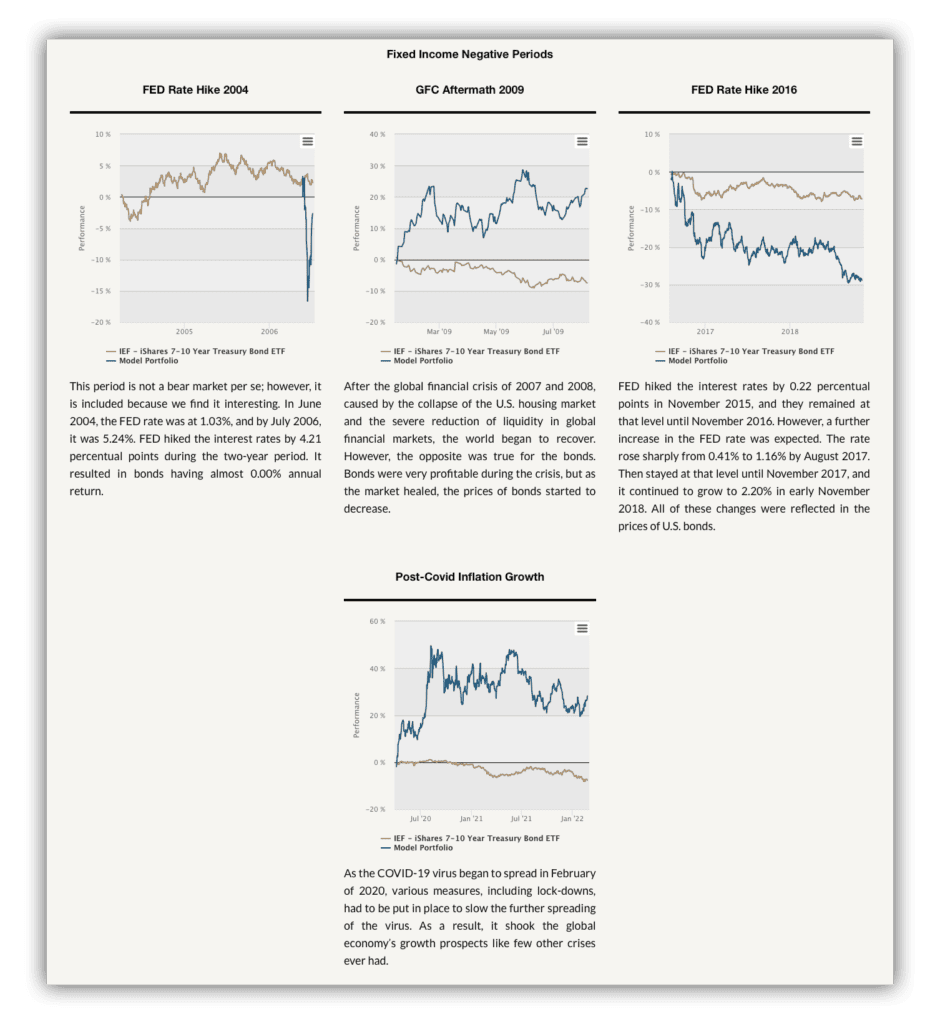
Equity Crisis Analysis – is a risk-management report that allows you to review your portfolio’s performance during 15 significant crisis periods over the last 20+ years. Visit crisis analysis case study subpage to learn more.


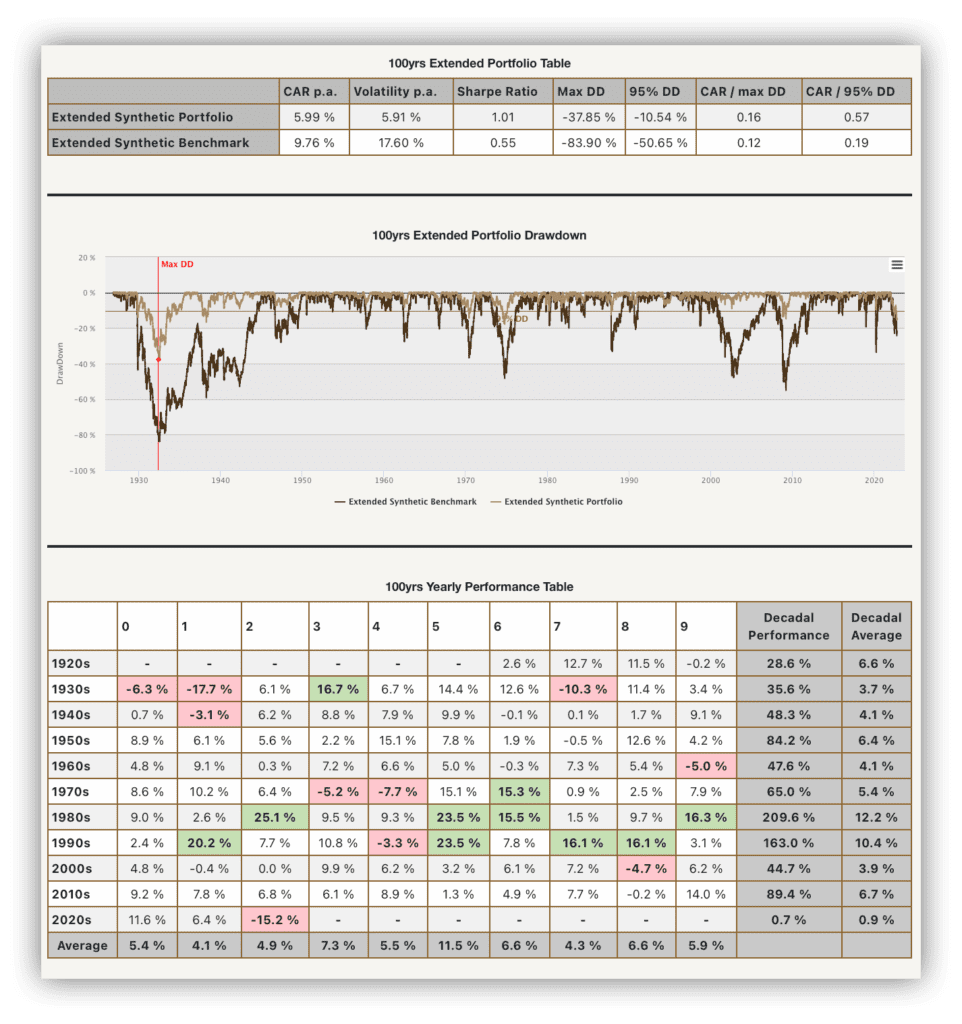
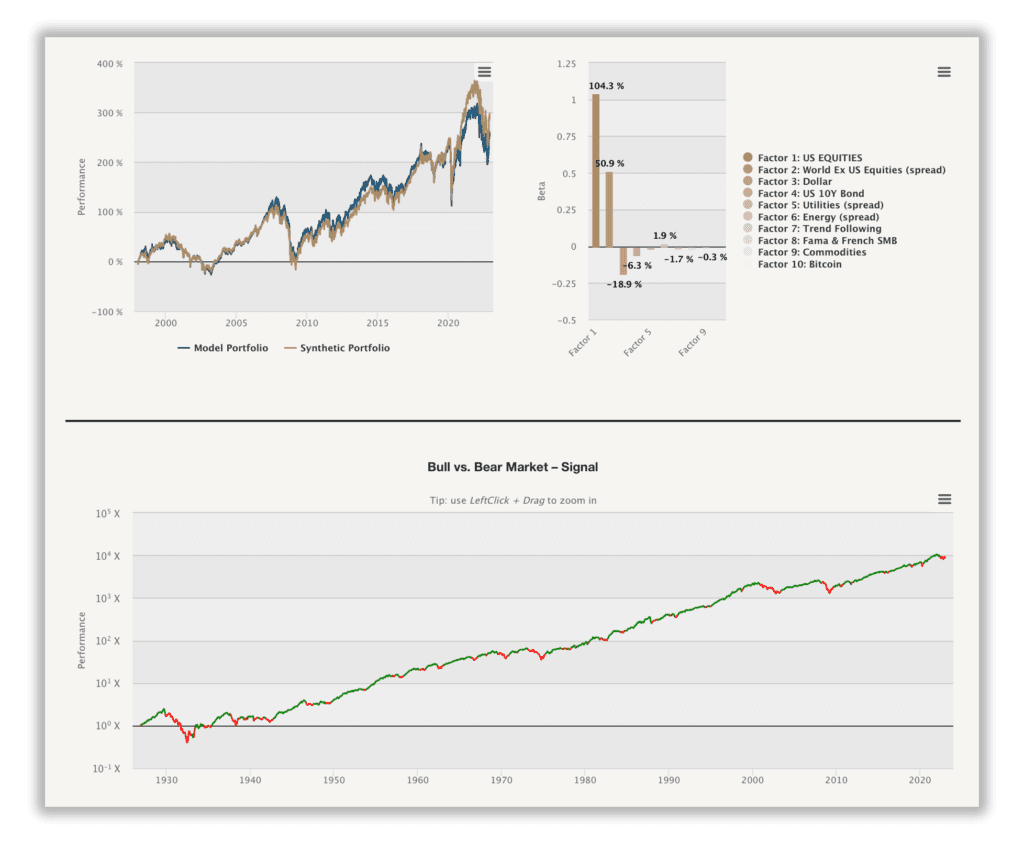
100yrs Portfolio Analysis – report’s primary purpose is to allow our clients to review the hypothetical performance of your model portfolio during a very long historical period, accurately since 1926. We use our state-of-the-art multifactor model to create a synthetic portfolio that tries to match the performance of the selected model portfolio and its benchmark designed in Portfolio Manager.

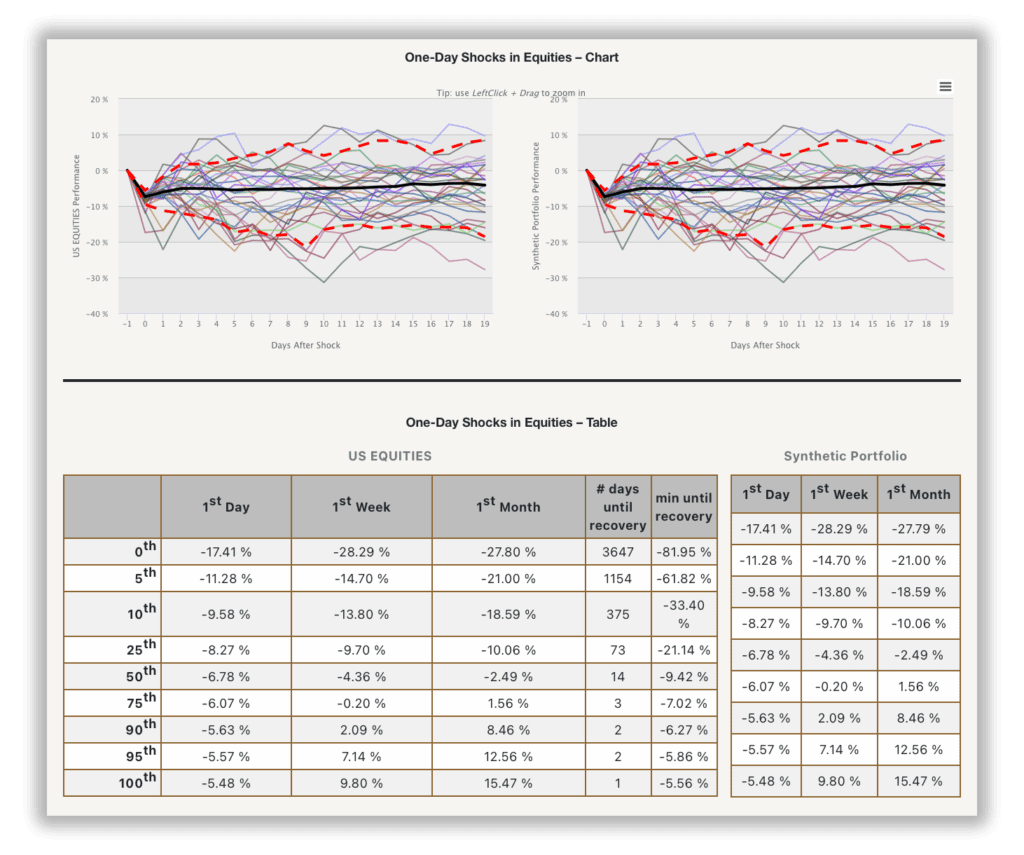
One-Day Shocks & Historical Event Analysis – report will allow you to review the market performance of 3 different assets: US equities, 10Y treasury bonds, and commodities, after the 30 worst one-day shocks in each asset over the last century plus after the starts of major wars, international crises, and deterioration of US presidents’ health. The following report is based on the research article The Worst One-Day Shocks and The Biggest Geopolitical Events of the Past Century.

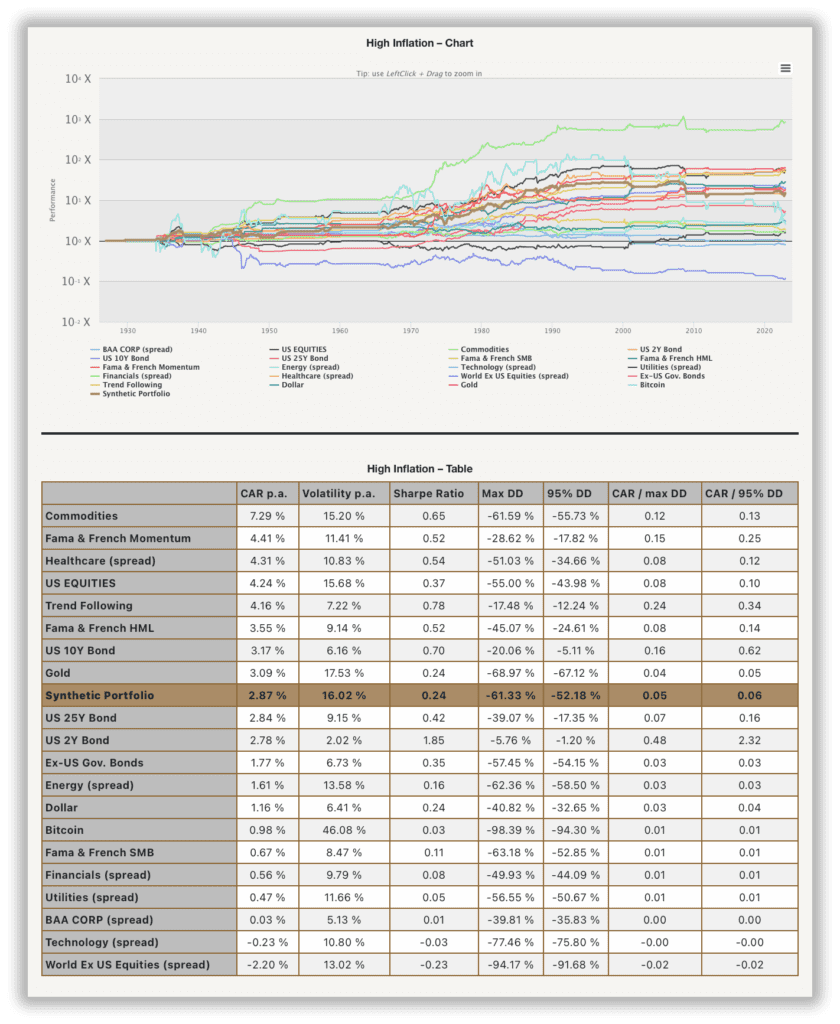
100yrs Market States Analysis – report aims to show how sensitive your Model Portfolio is to various market states, be it periods of bull/bear markets, rising/falling interest rates, or high/low inflation. The report uses the out-of-sample methodology for the definition and calculation of the performance of the model portfolio and all investment factors described in the following article.

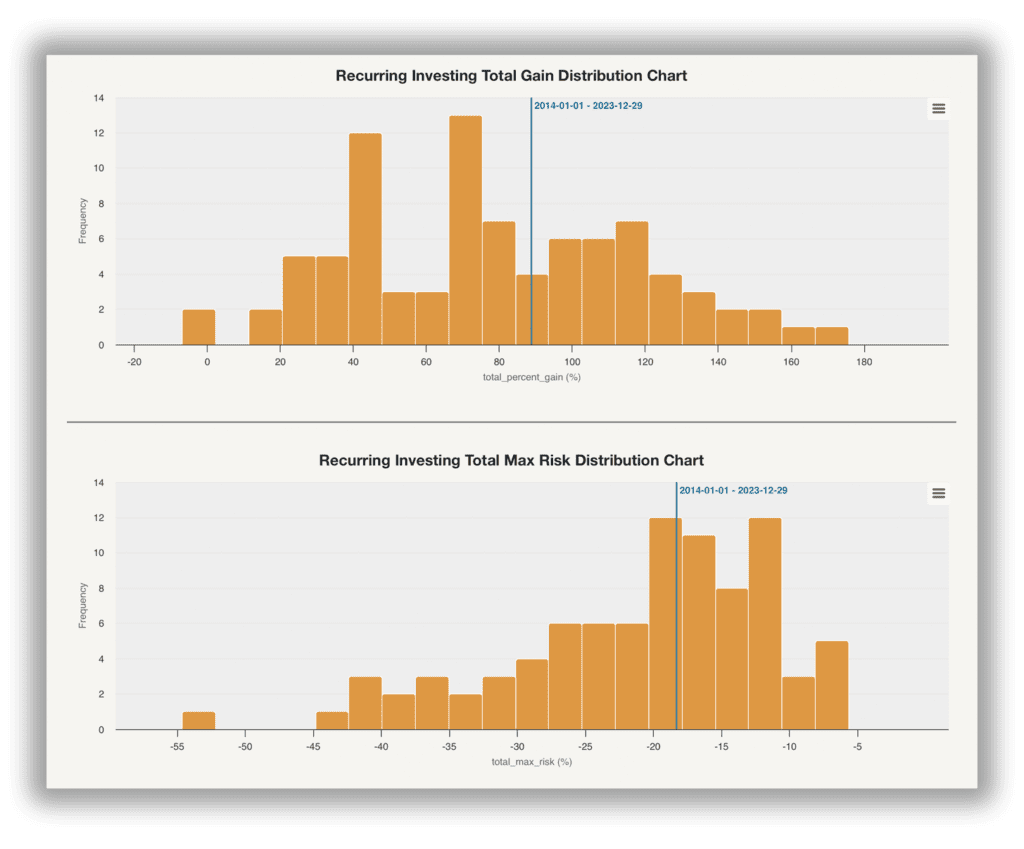
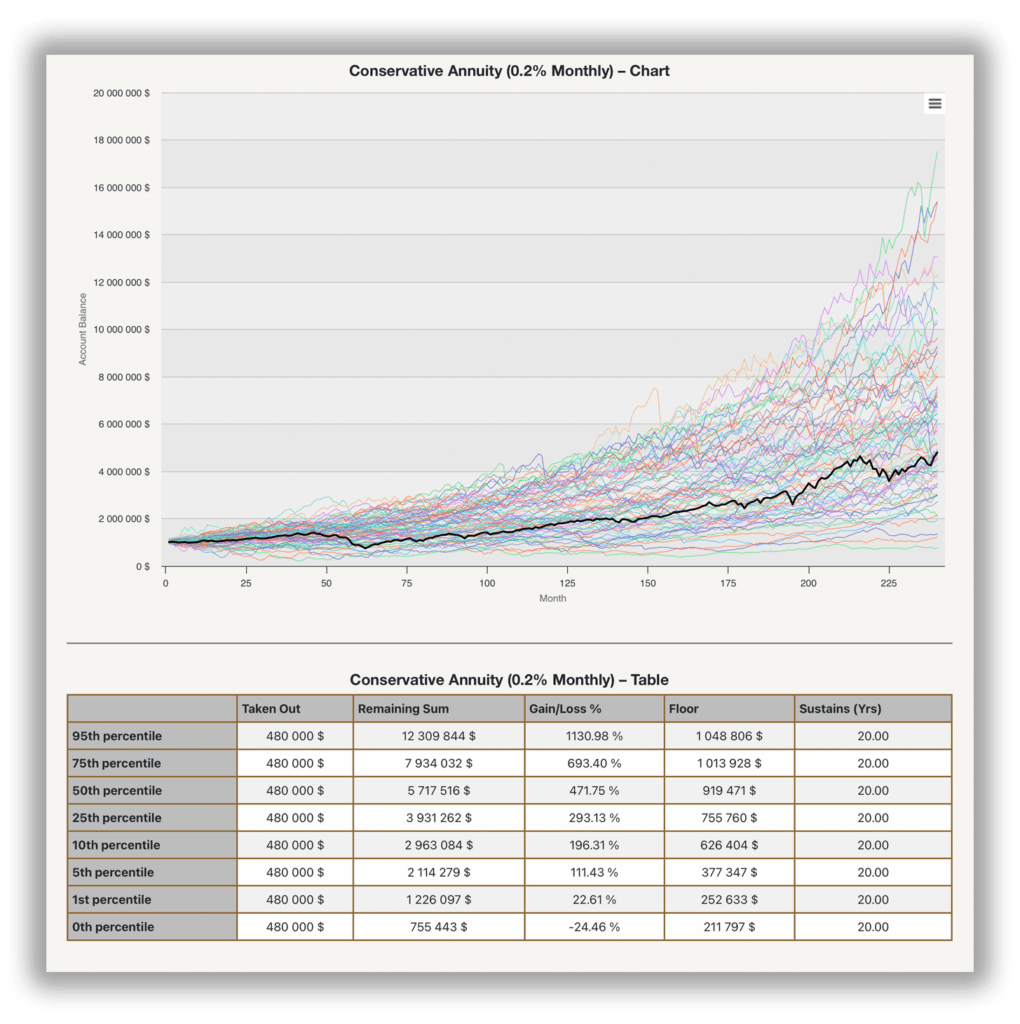
Savings Plan Analysis Report – helps users evaluate how periodic savings impact their portfolio’s growth over time. It shows the potential outcome of monthly investments, highlighting key metrics like final value, gains, and risk, empowering users to make informed decisions and optimize their savings strategy for long-term success.


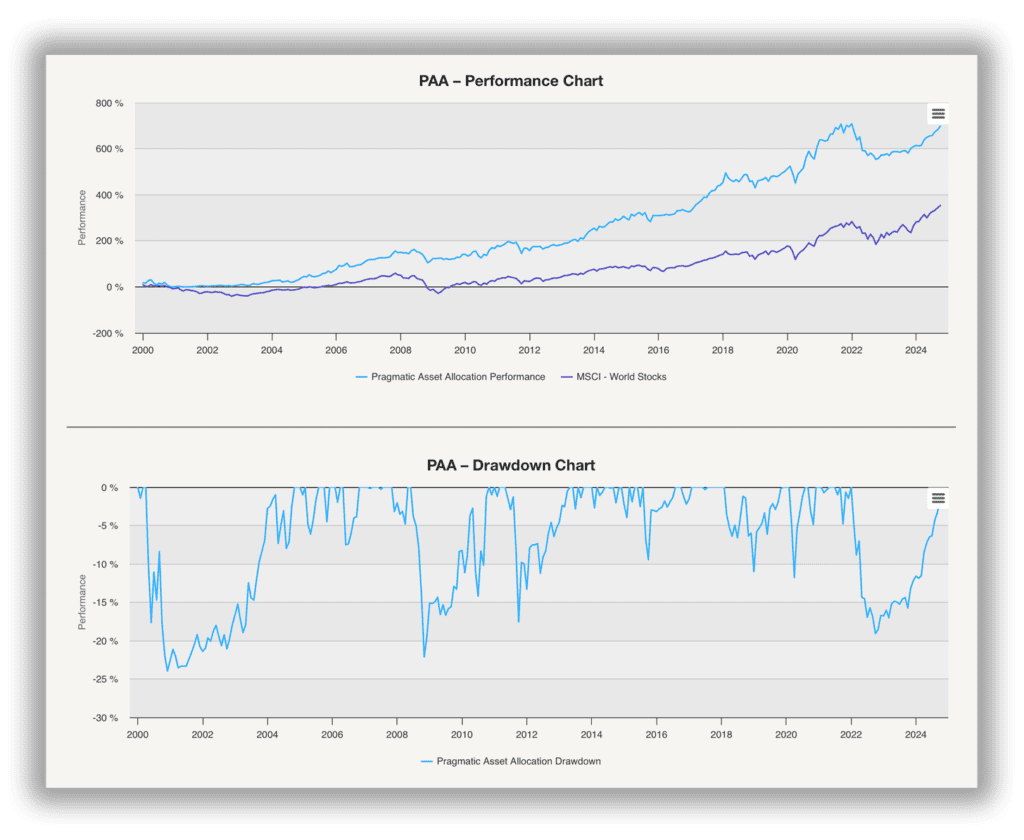
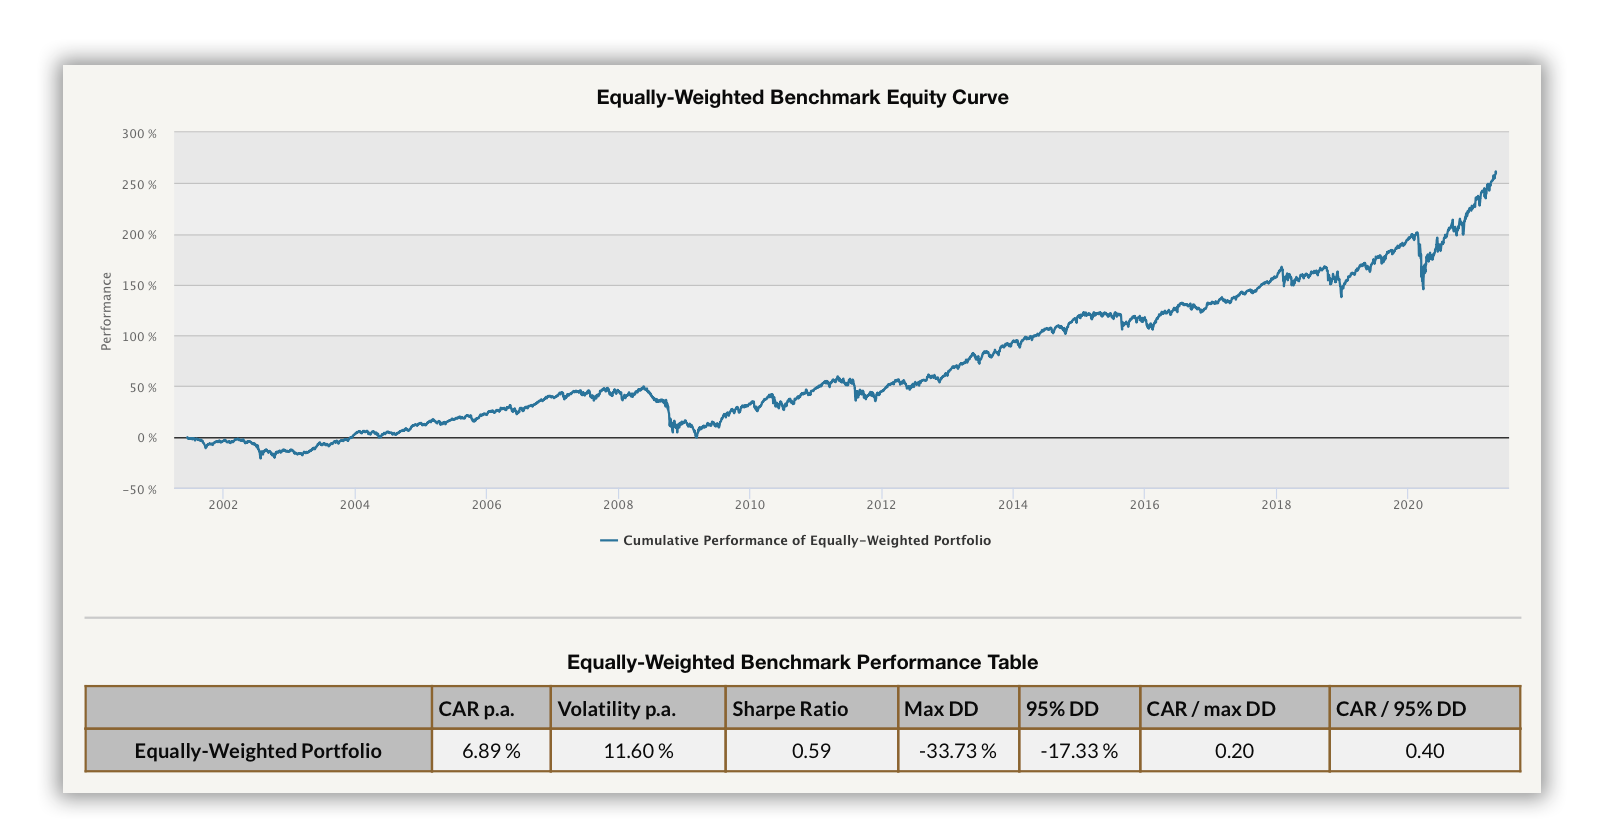
Pragmatic Asset Allocation Report – is useful for assessing the performance and attractiveness of major global asset classes. It provides insights into portfolio composition, recent changes, and future allocations, helping users make informed decisions based on a diversified, tax-efficient strategy with low turnover.


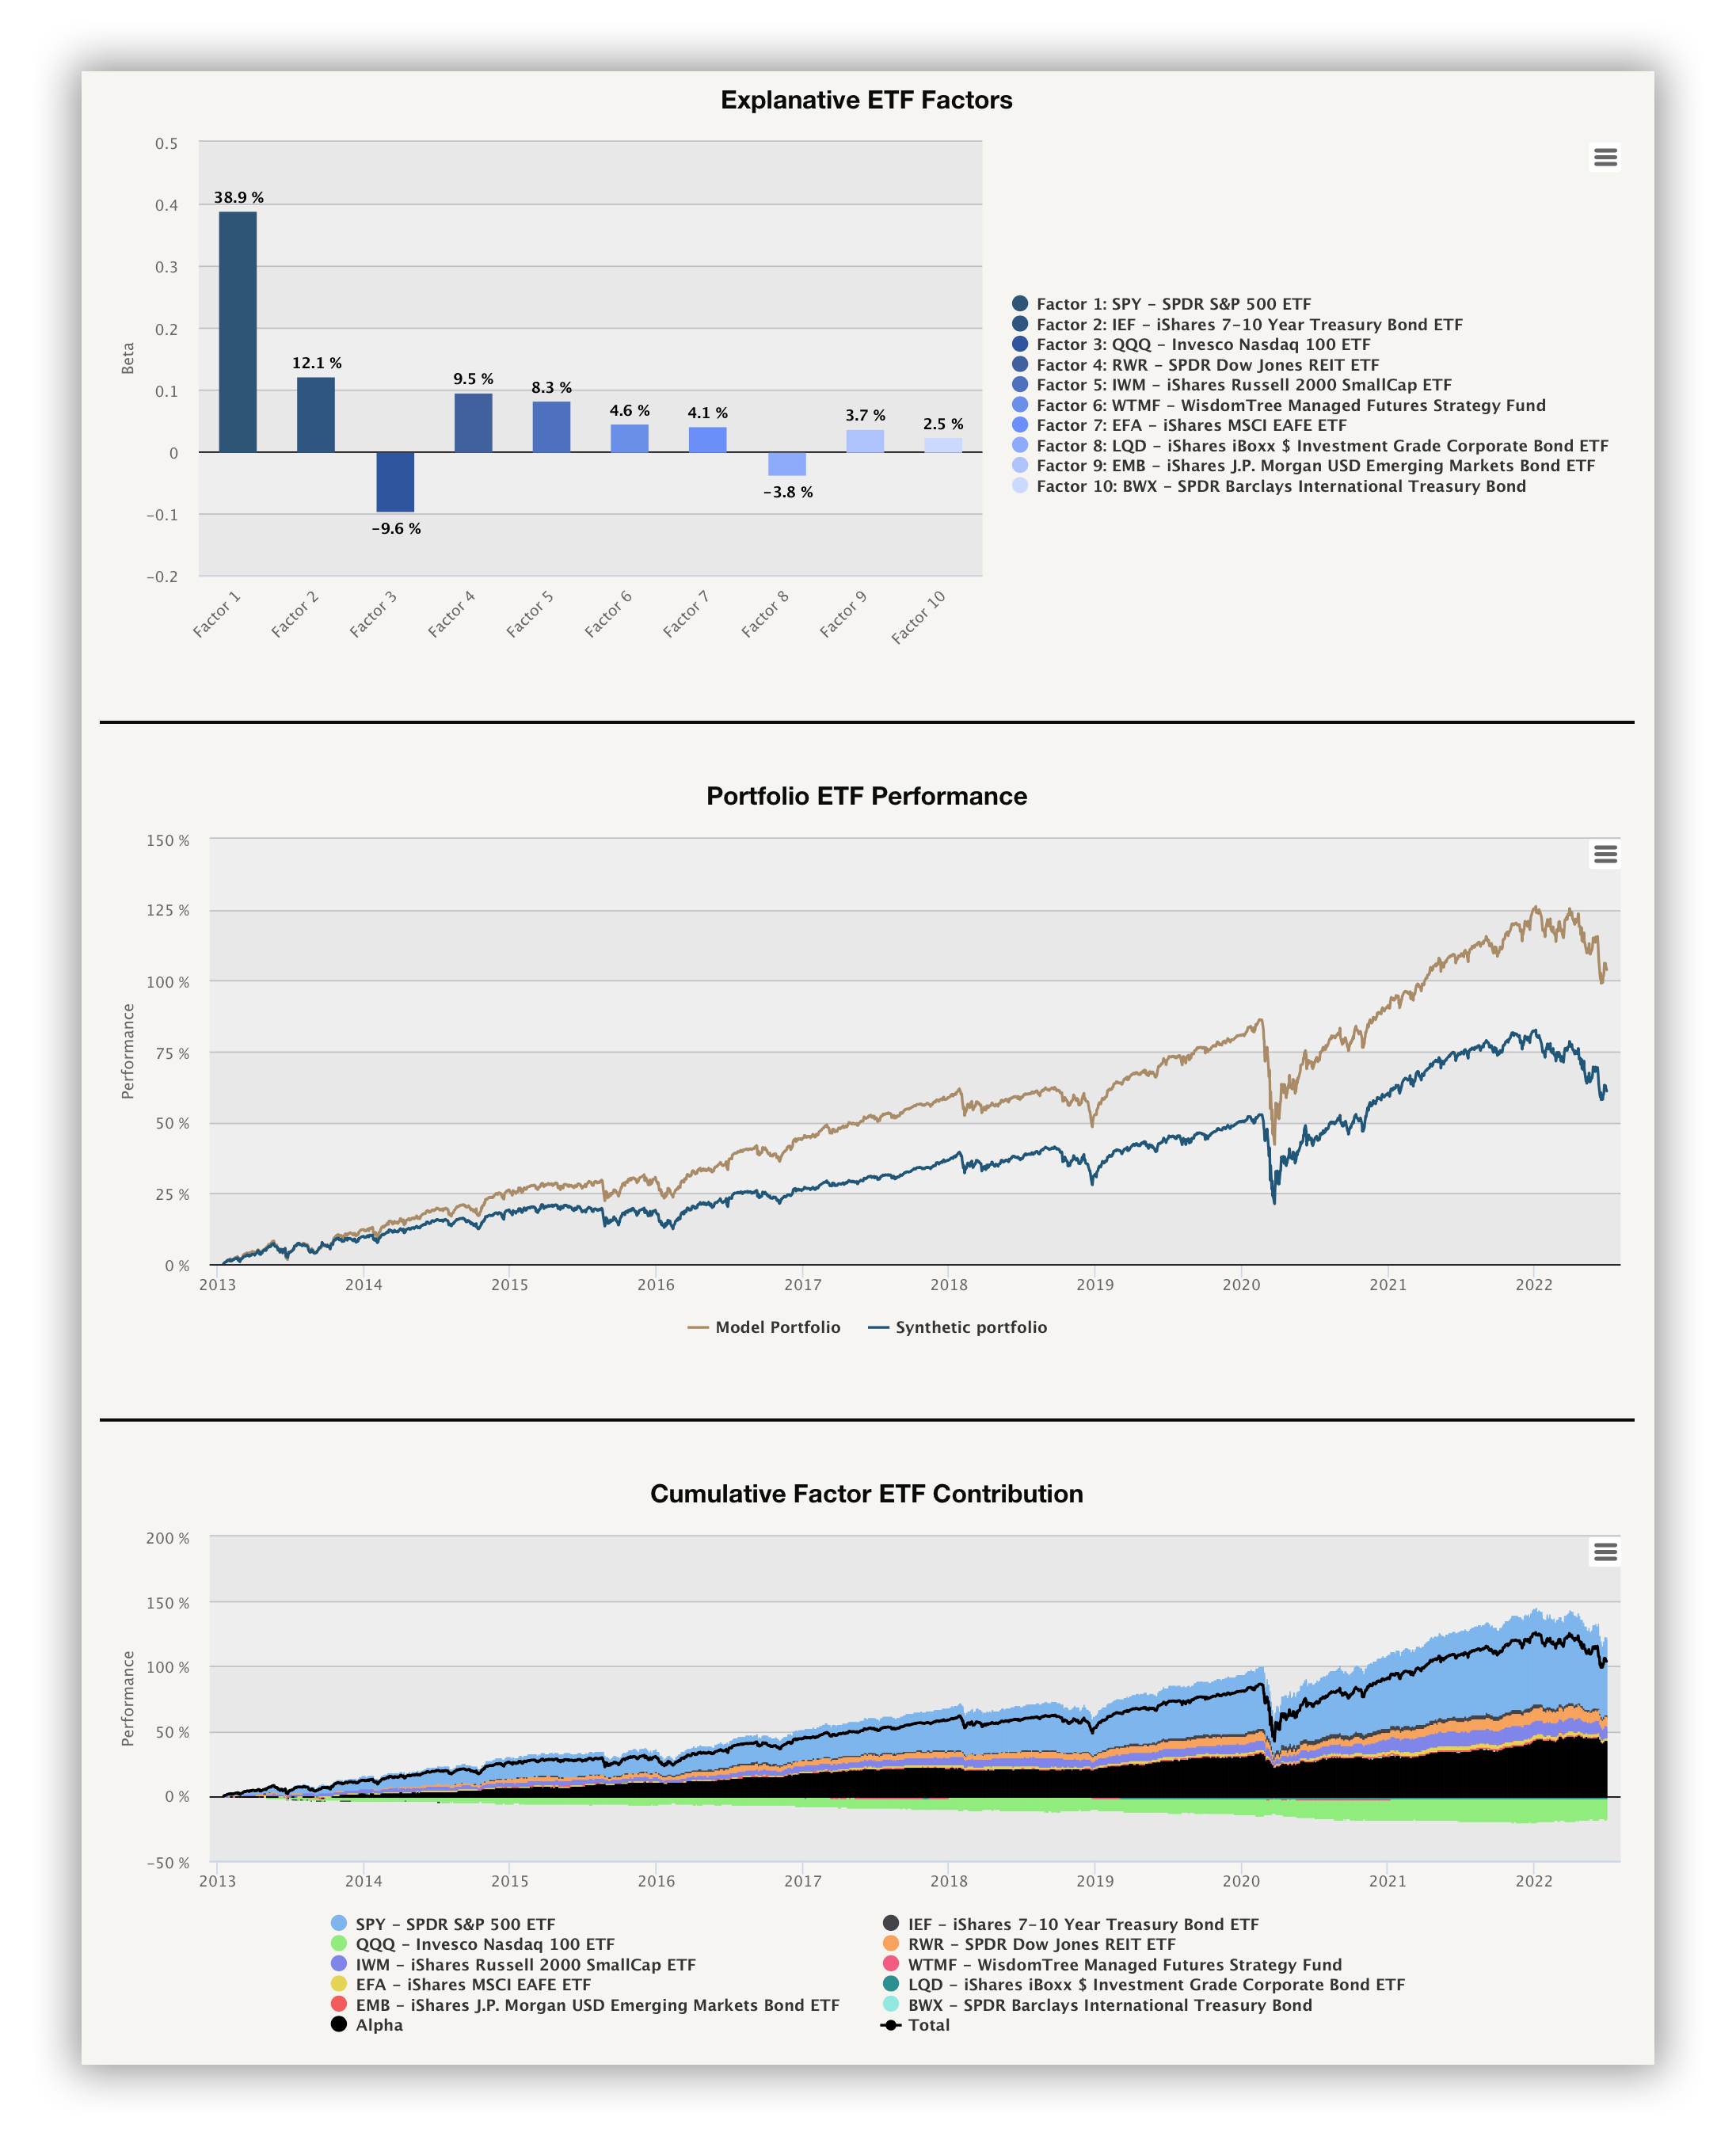
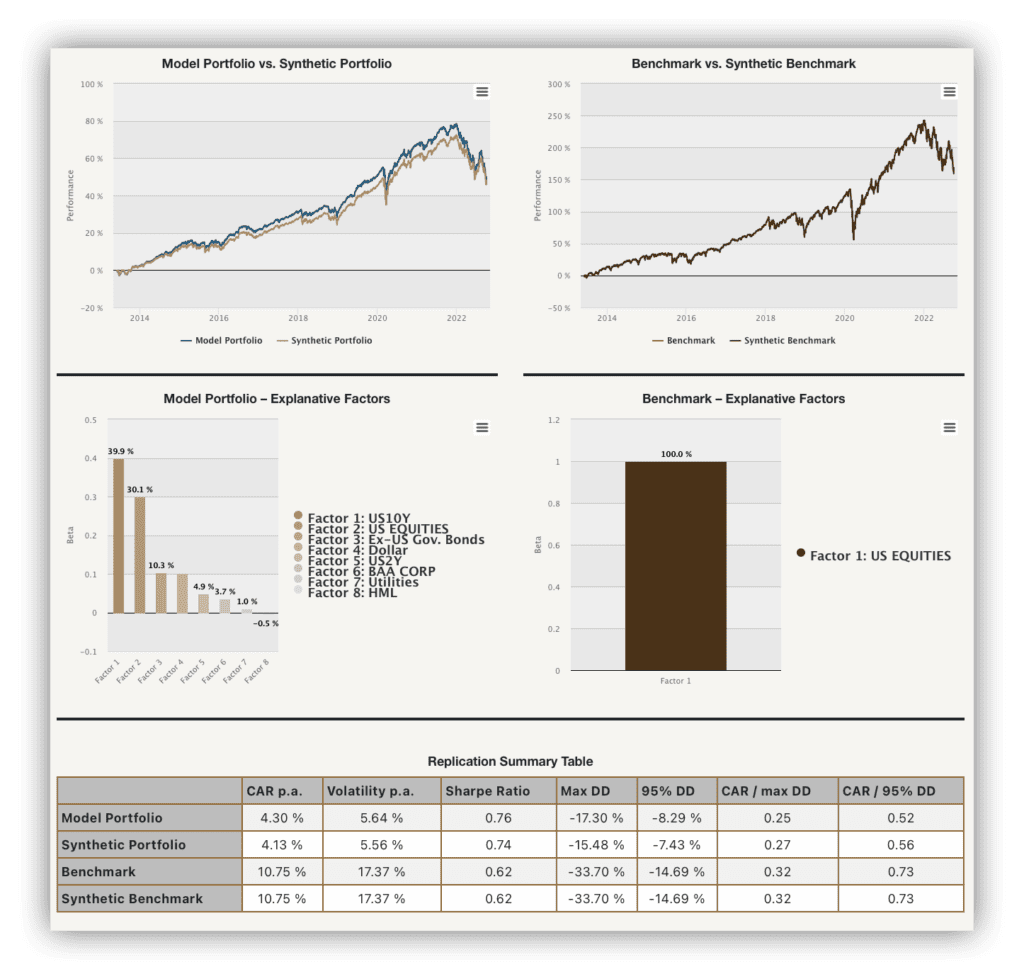
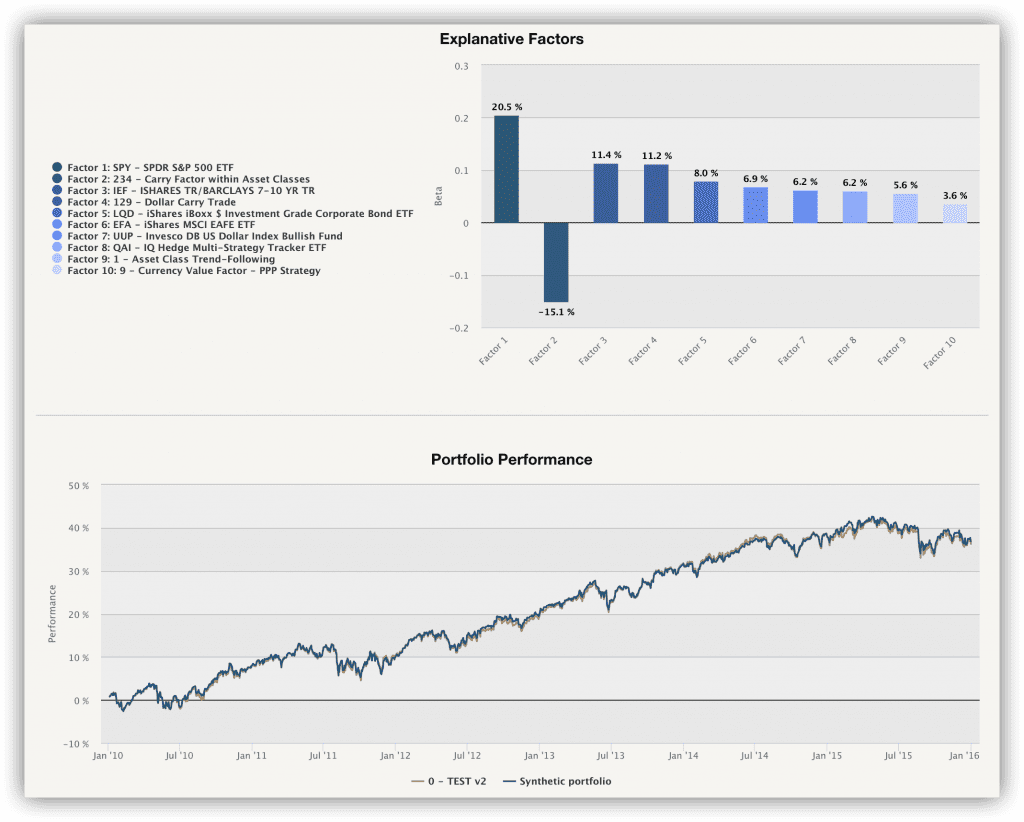
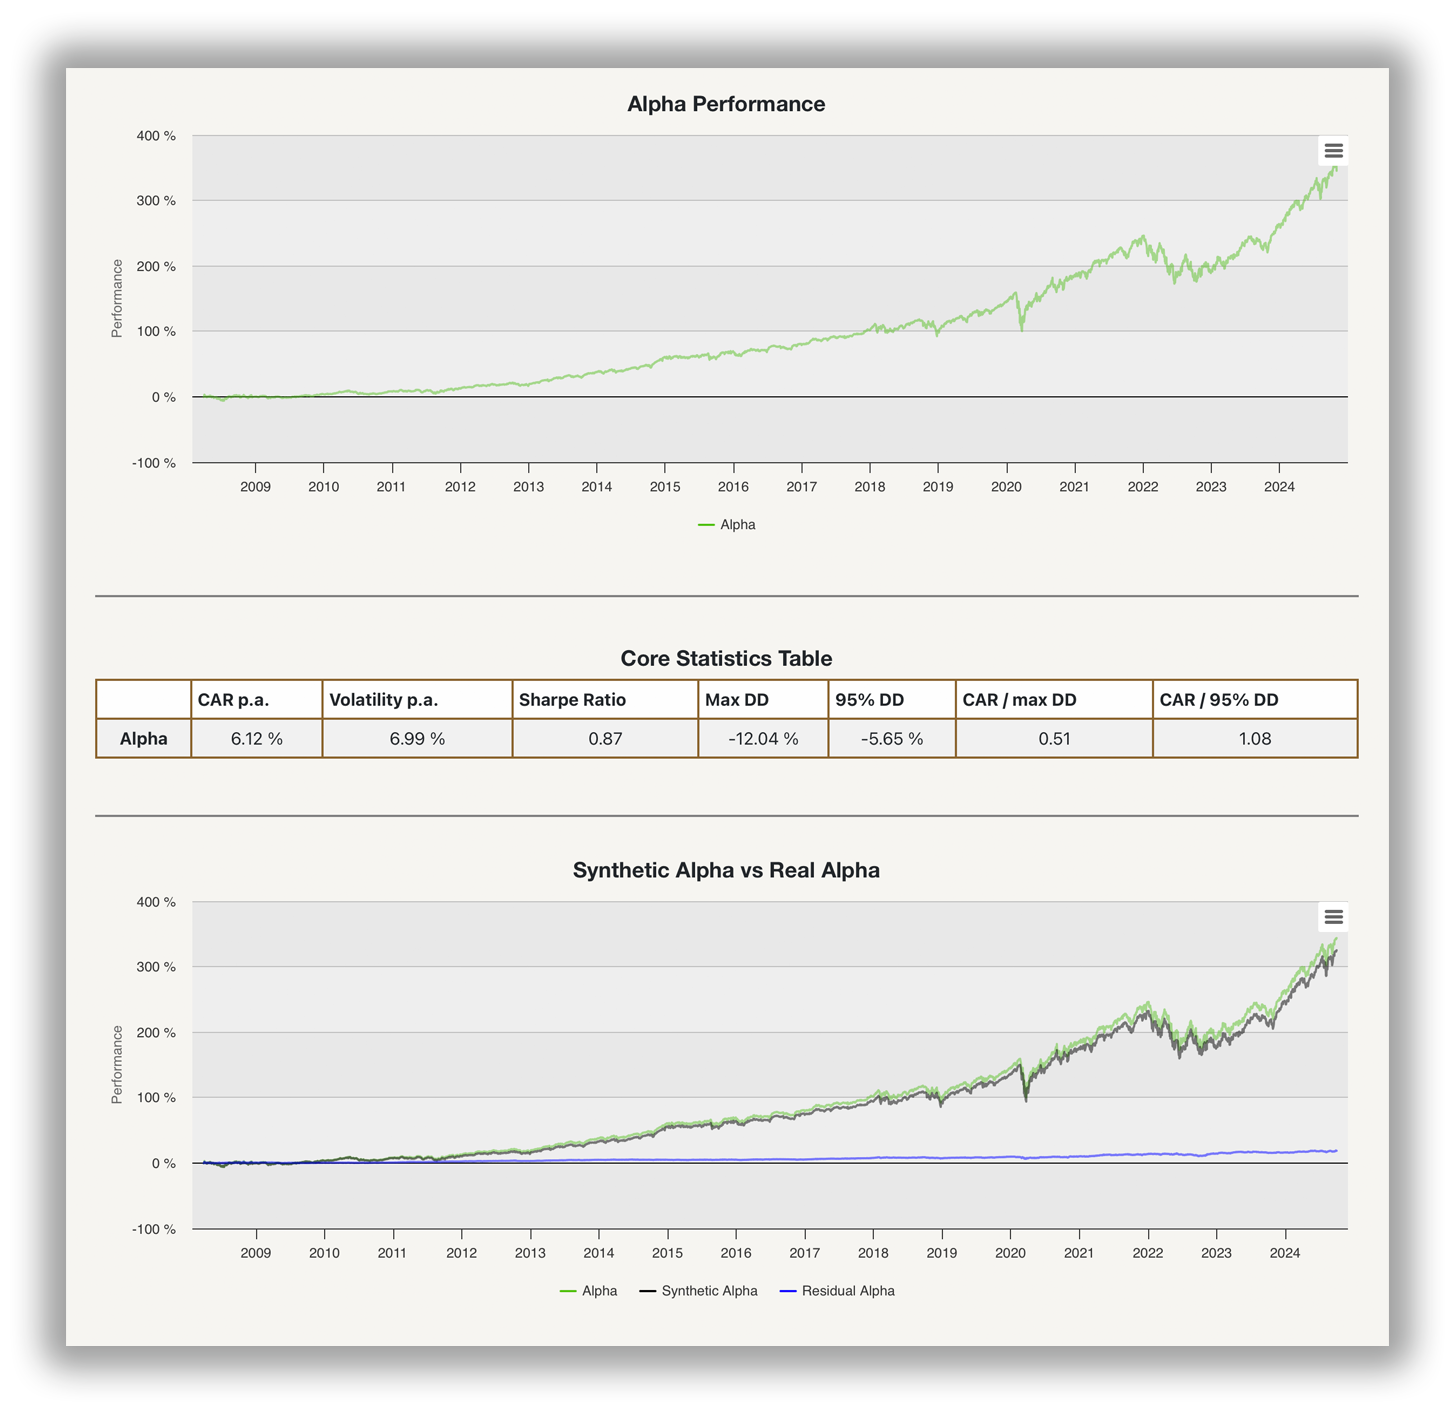
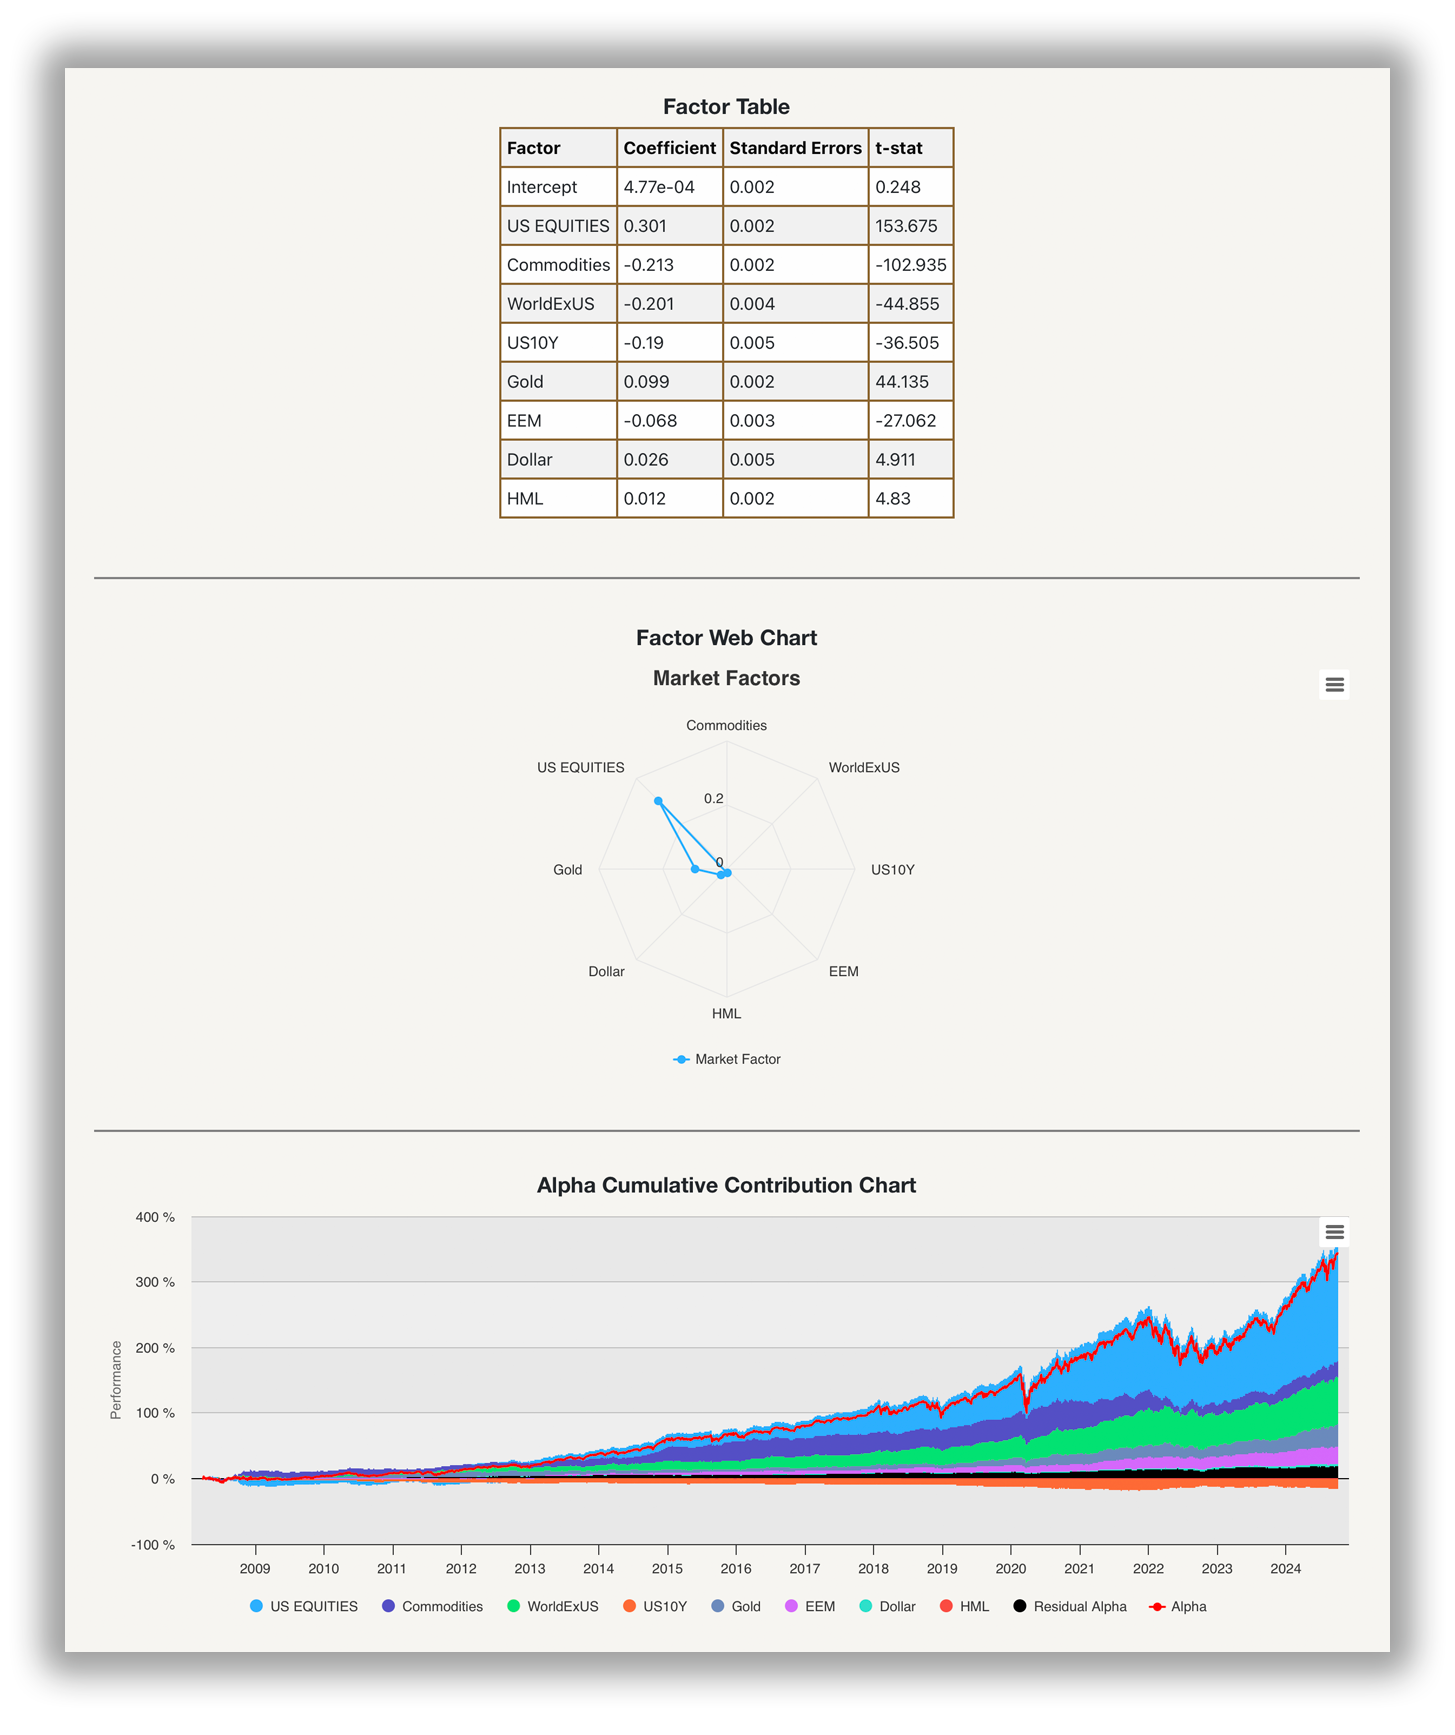
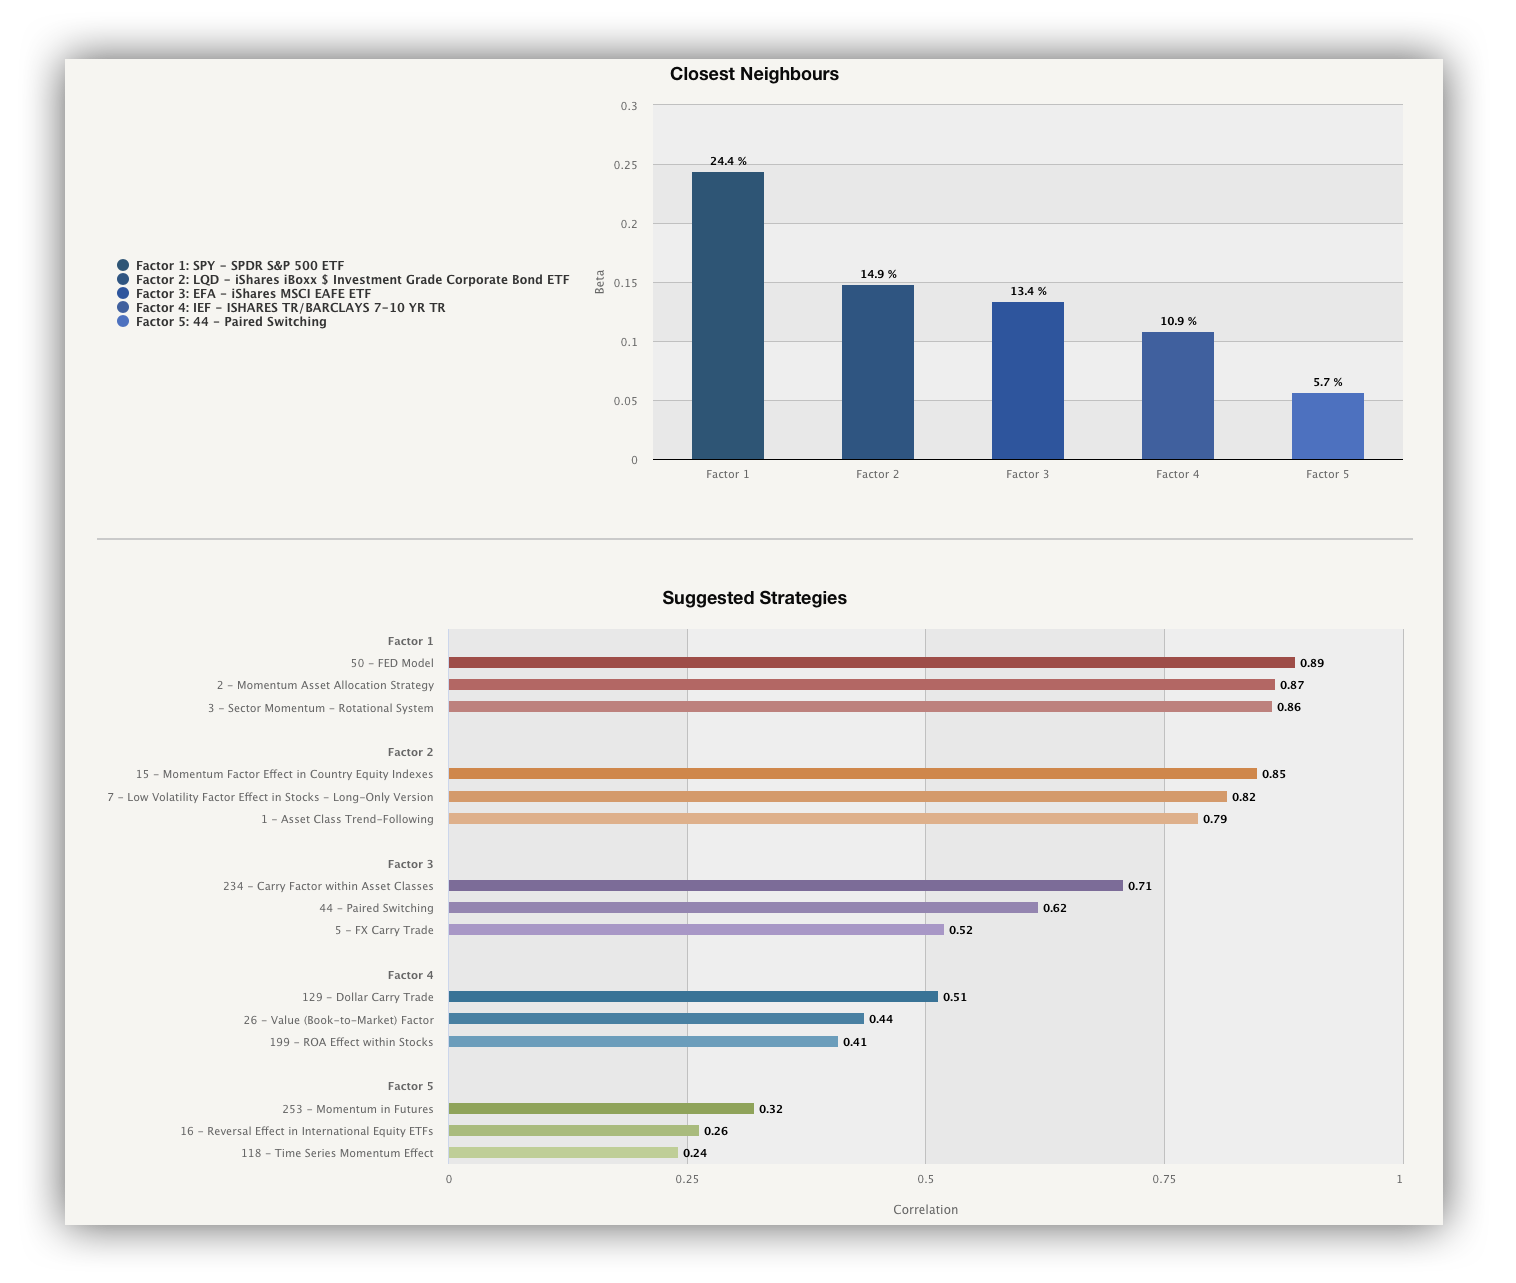
Multi-Factor Analysis – decompose you custom portfolio into elementary investment factors by using our state-of-the-art multi-factor regression analysis with over 80 underlying factors. Visit our introduction into the multi-factor analysis methodology to learn more.


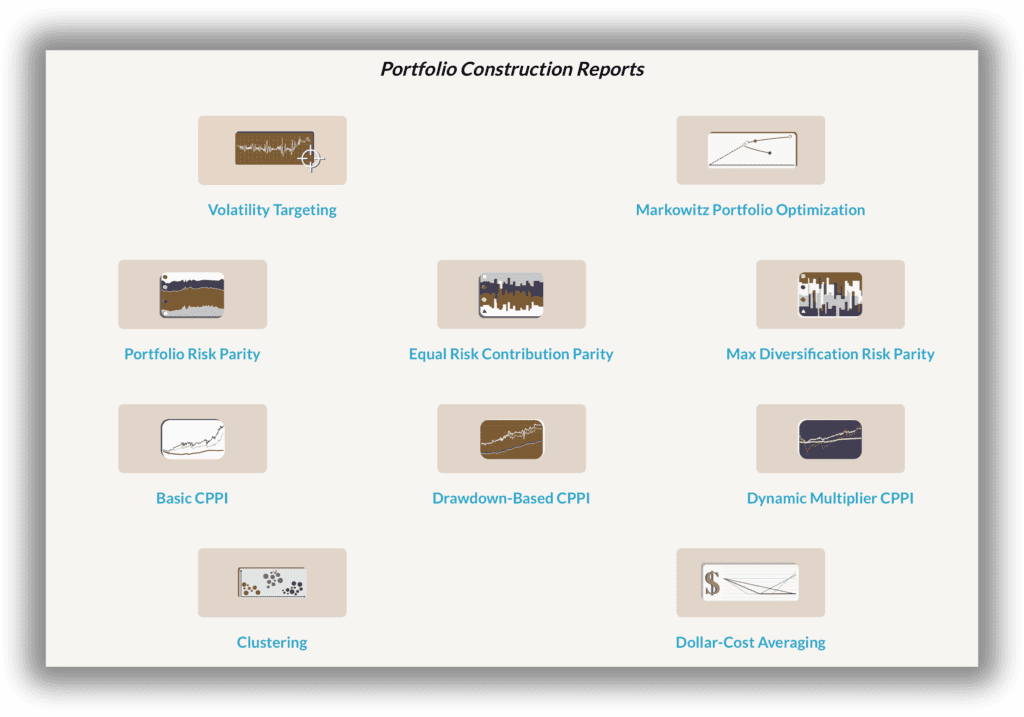
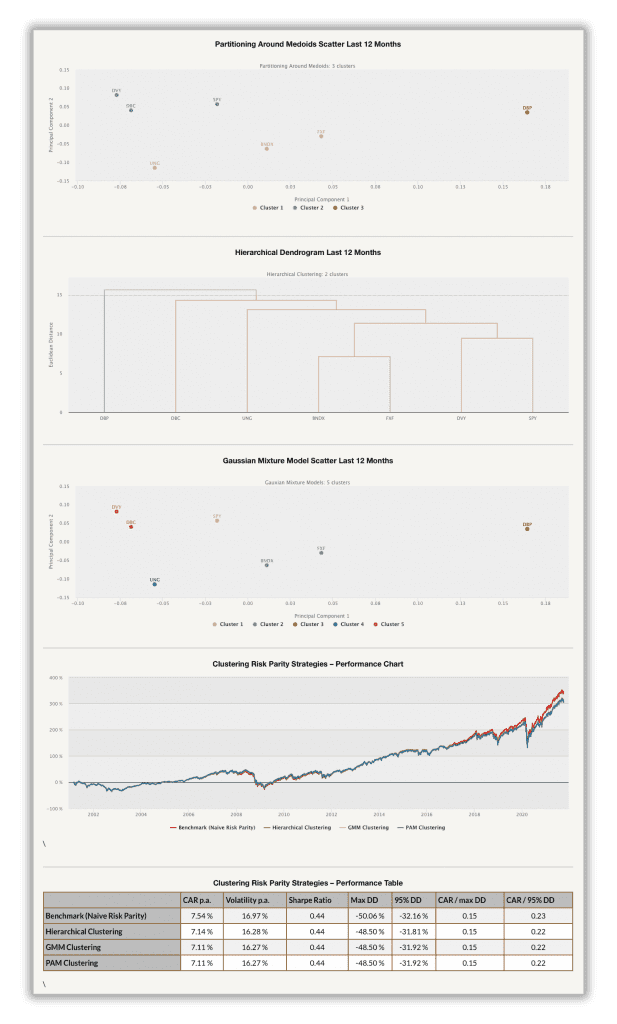
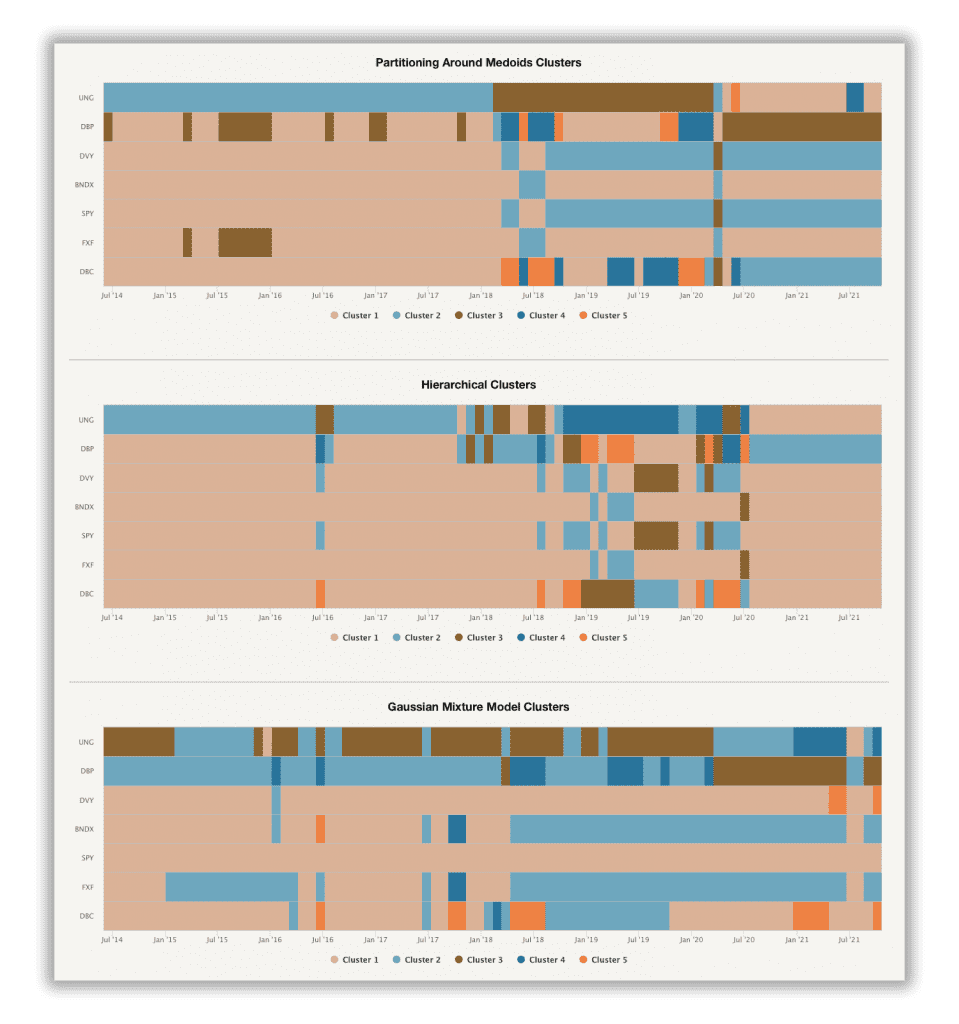
Portfolio Clustering – is based on the most popular clustering methods such as Partitioning Around Medoids (PAM), Hierarchical Clustering, and Gaussian Mixture Model. You can examine clusters for various periods and compare how many clusters are identified in your model portfolio by all three clustering methods. Complete methodology for all three methods is available in the following article and its 2nd and 3rd continuation.


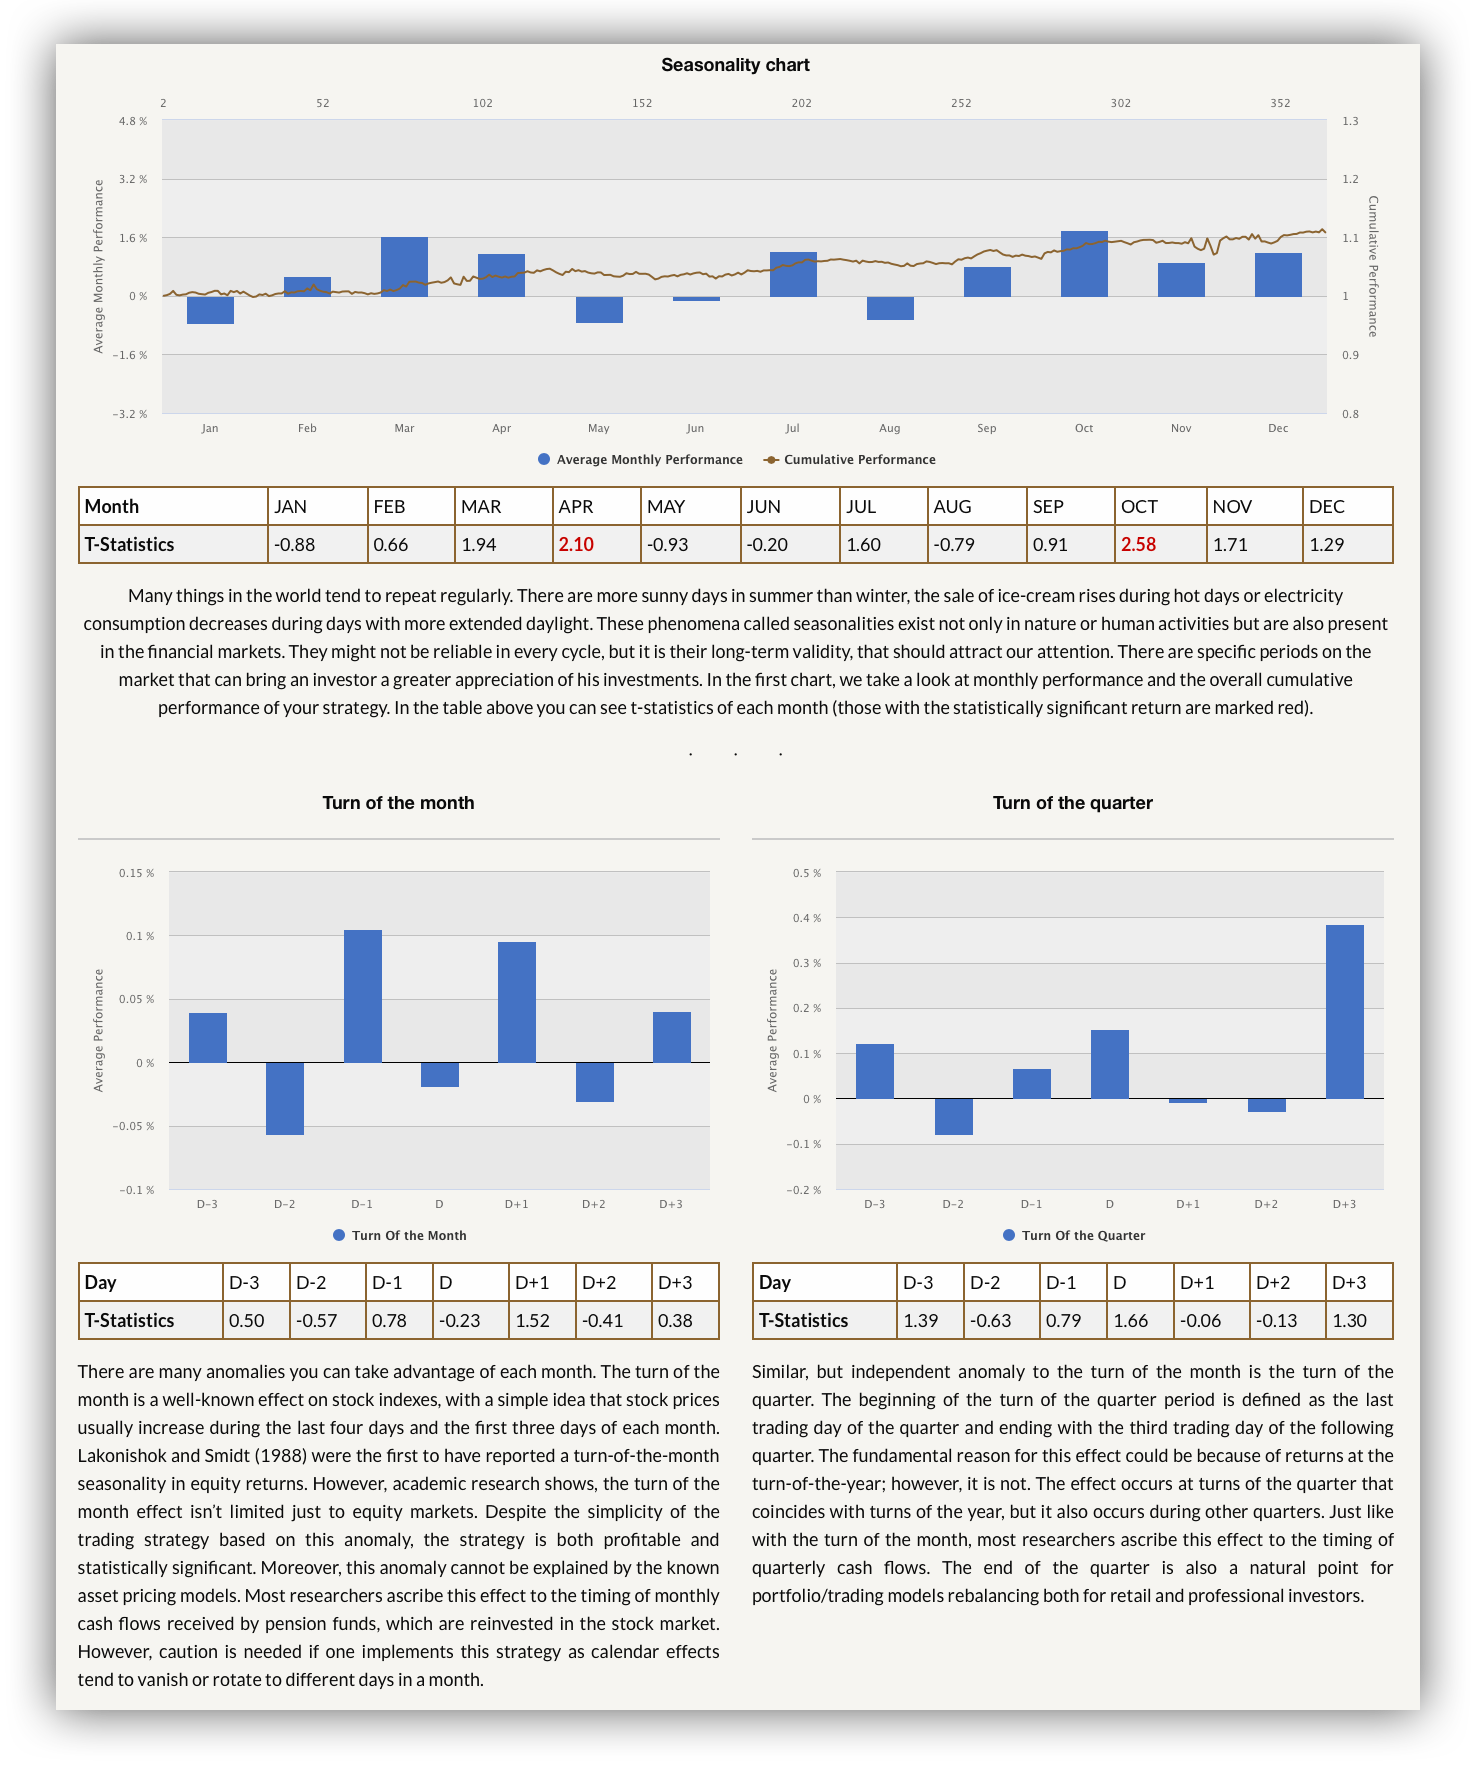
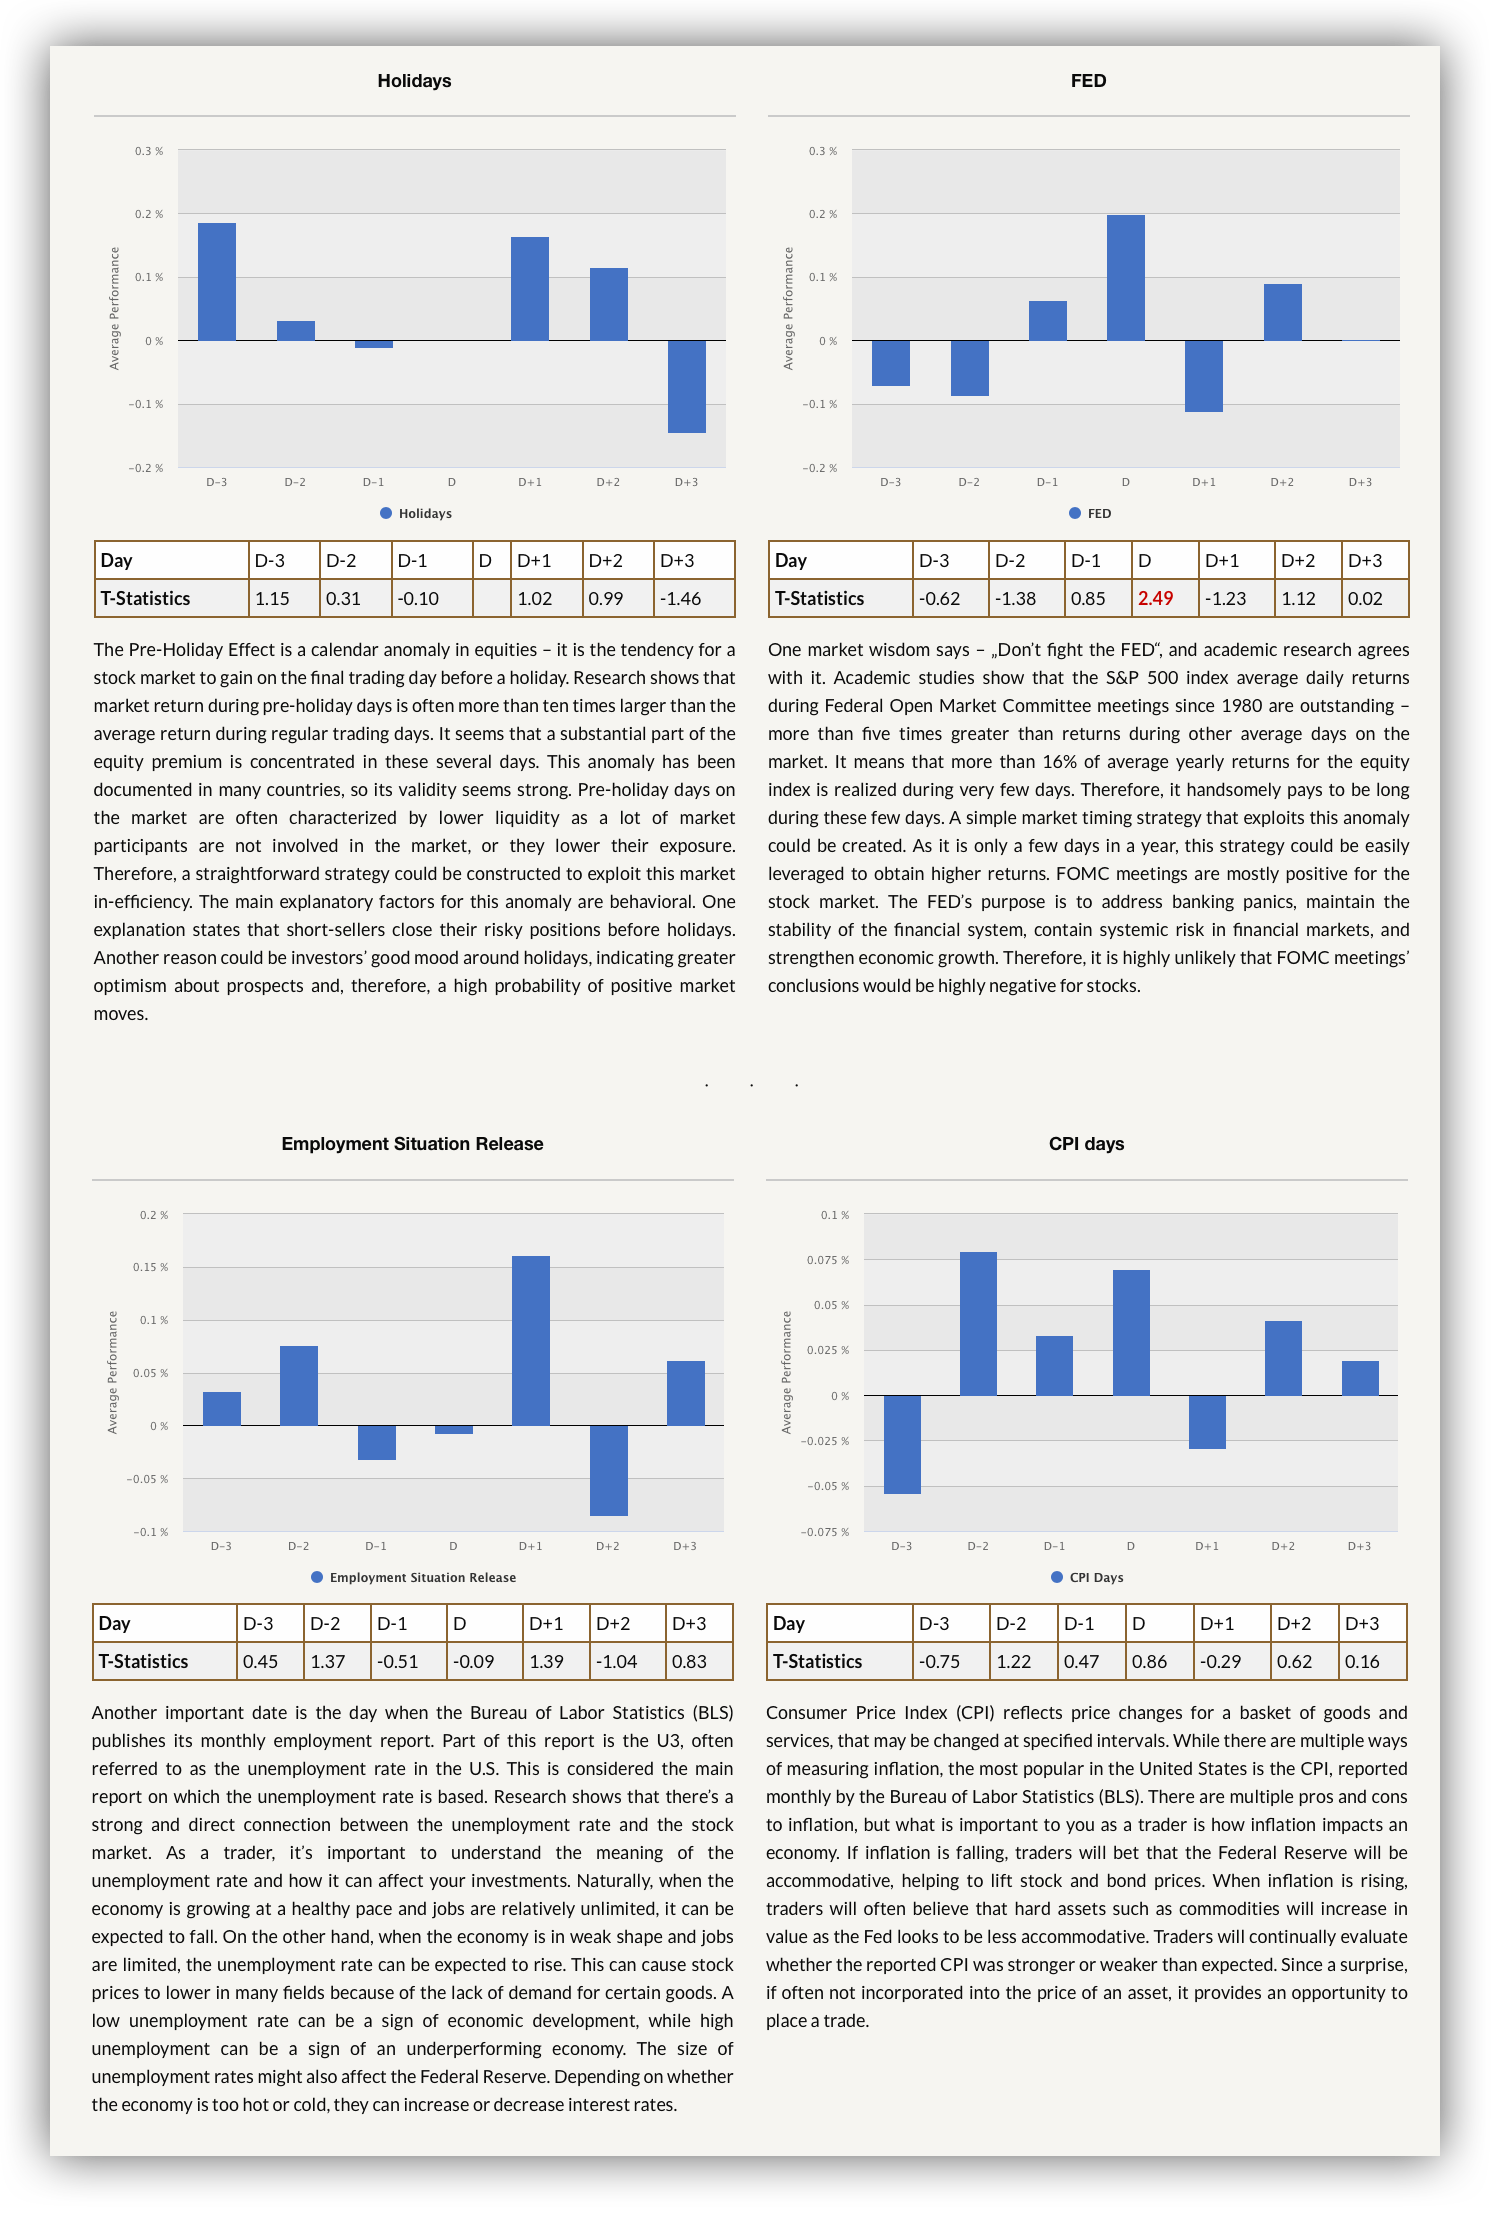
Seasonality Analysis – analyze your model portfolio’s performance during the significant market-action periods like – days of economic announcements, FOMC meeting days, etc. Visit seasonality analysis case study subpage to learn more.

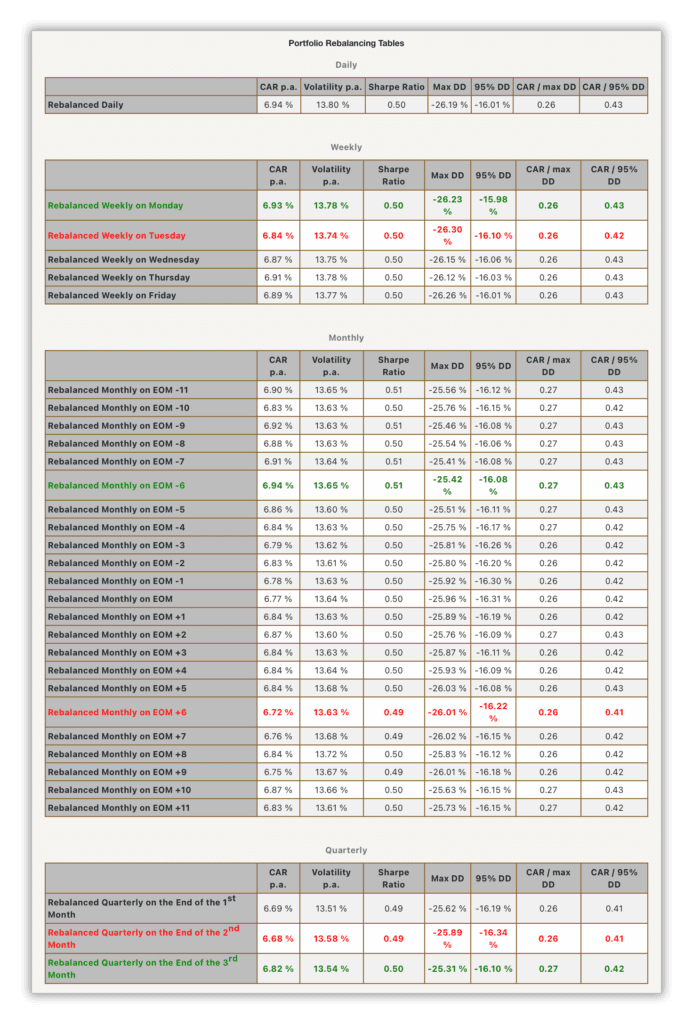
Portfolio Rebalancing – analyzes the impact of rebalancing on the model portfolio’s returns. The report helps to answer the question of whether it is, on average, better to rebalance the portfolio more often or with a lesser frequency. If you are interested in the theme of rebalancing and how it influences the overall portfolio’s performance and risk, look at the following article.

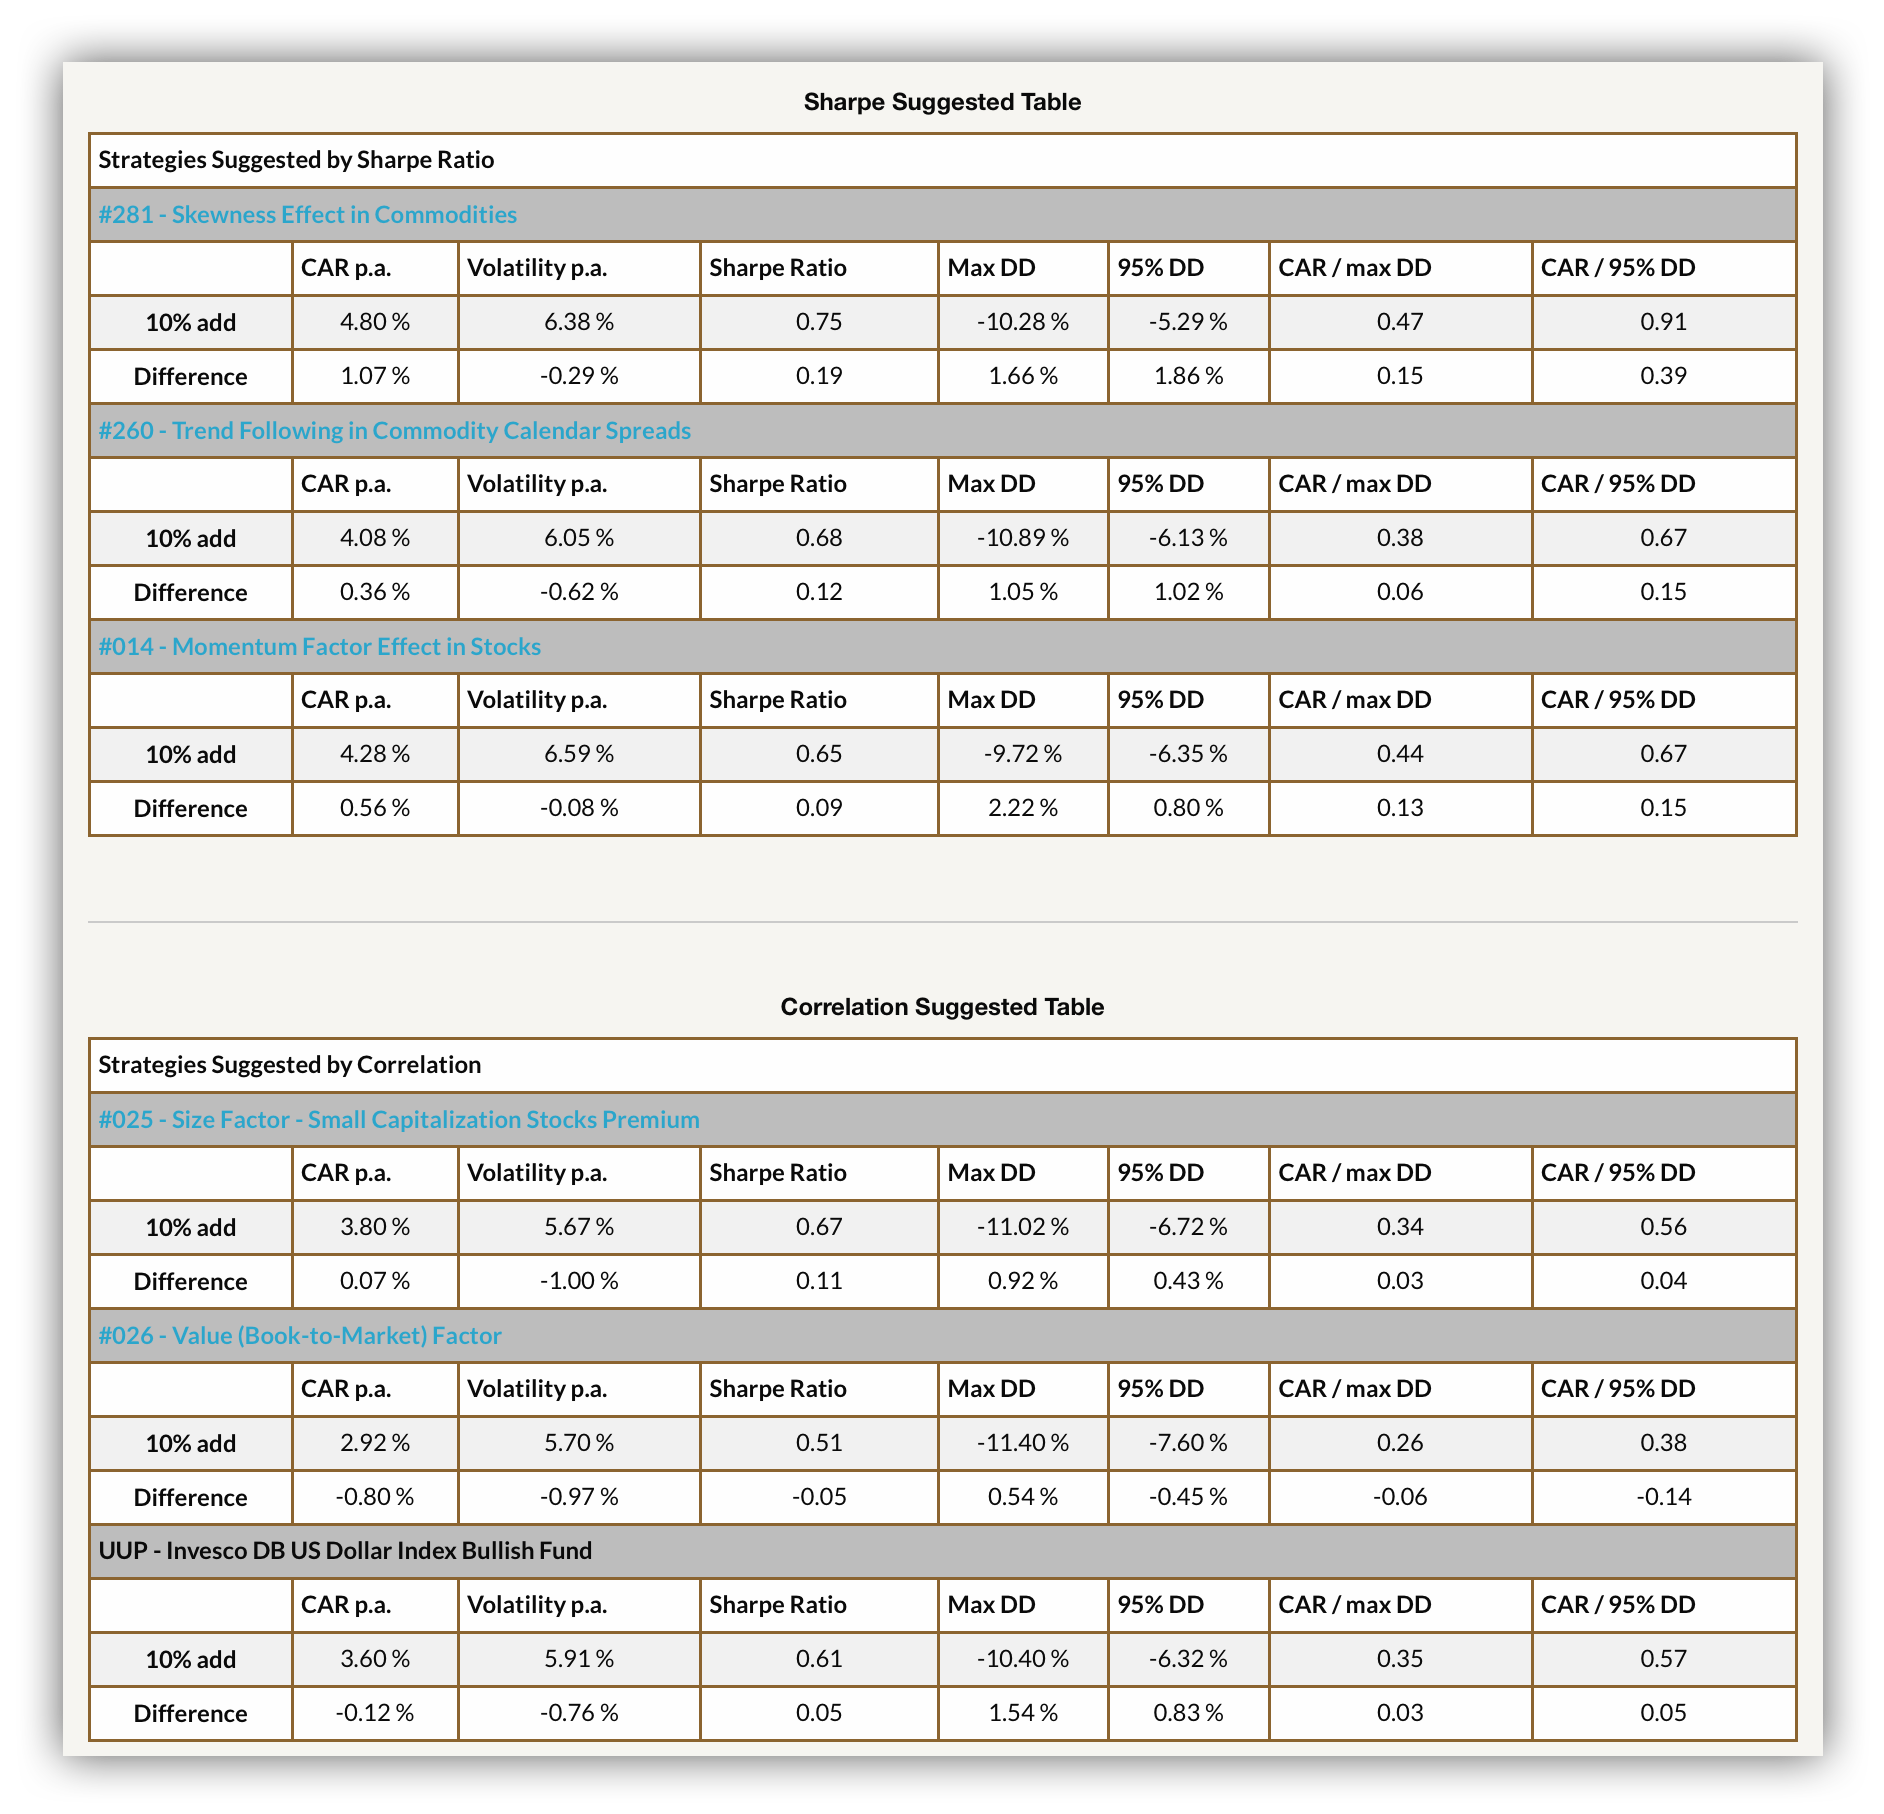
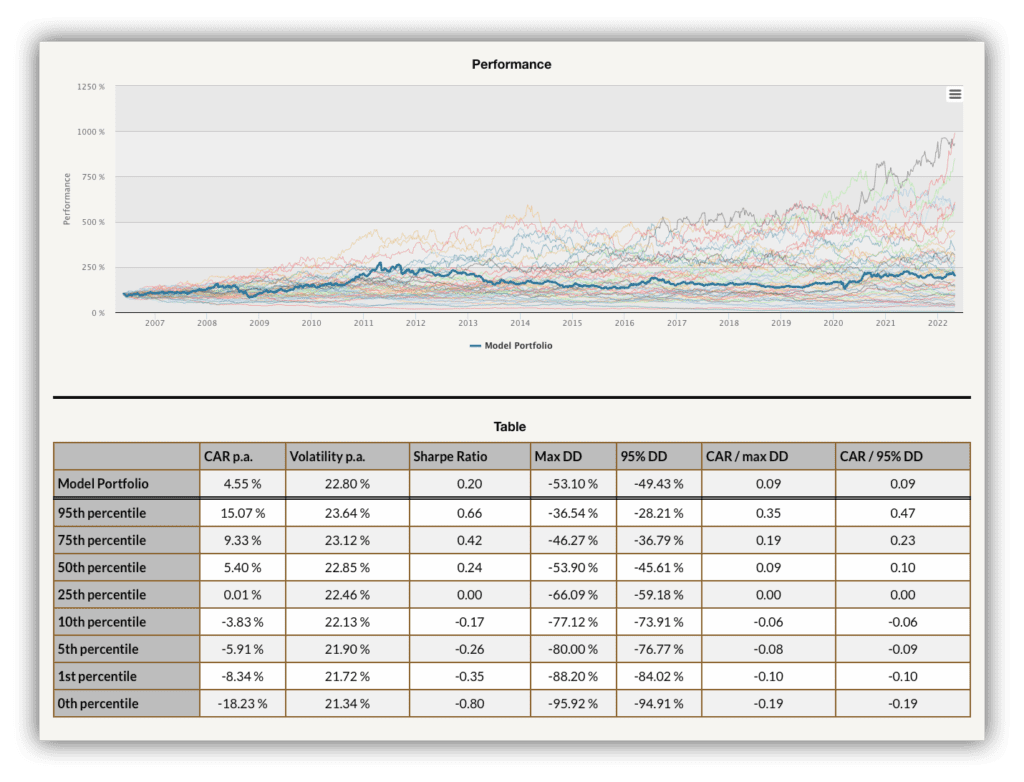
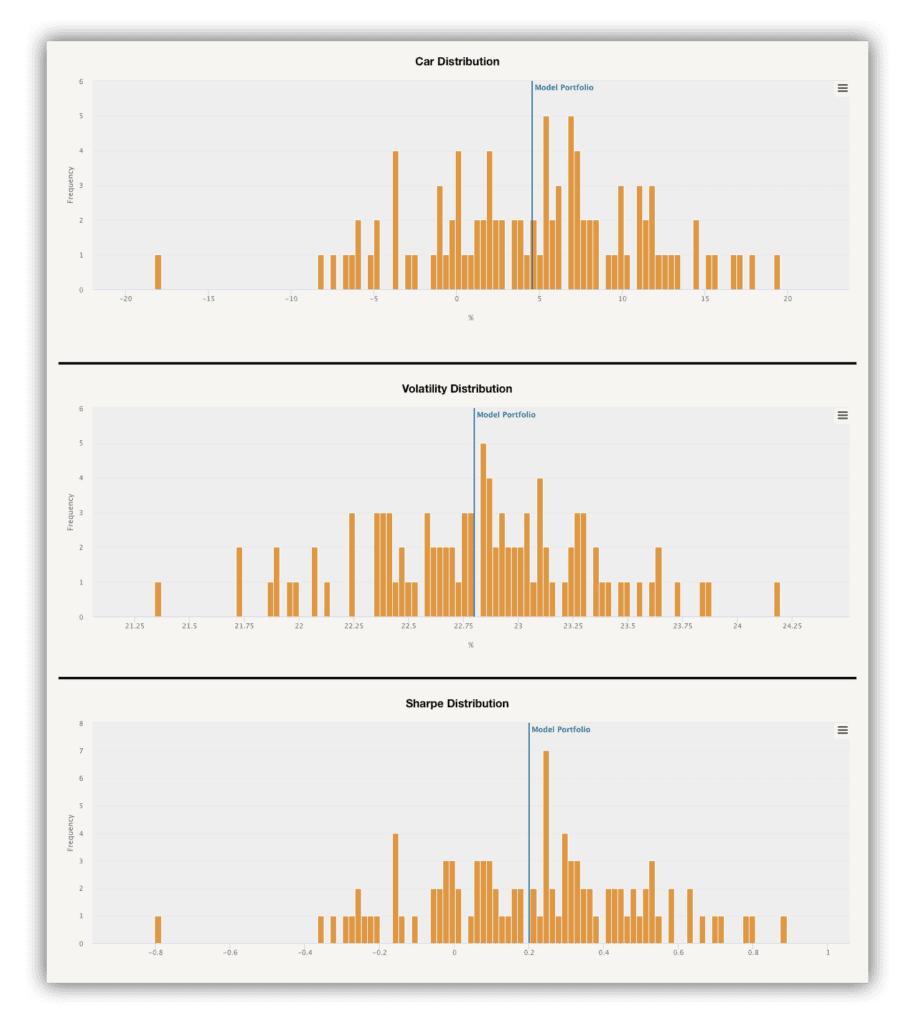
Strategy Grading – is a collection of 10 charts that provide a comprehensive evaluation of the Model Portfolio in relation to the broader range of investment strategies. The report includes the first five charts, which compare the Model Portfolio to various ETFs, and the following five charts, which assess its performance against strategies meticulously backtested by Quantpedia.
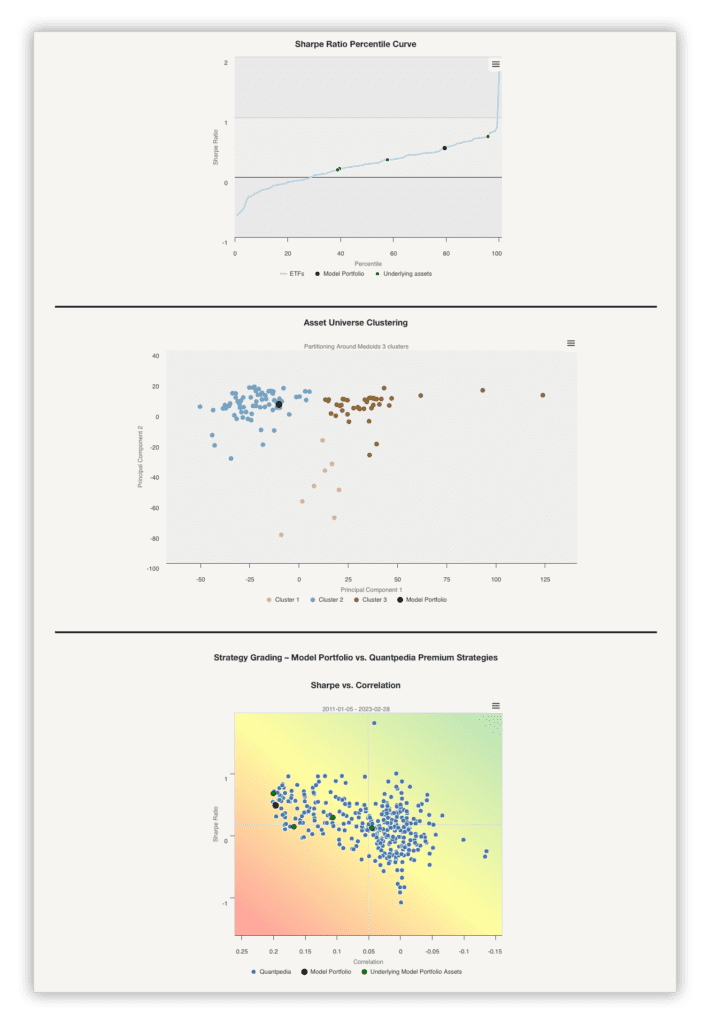
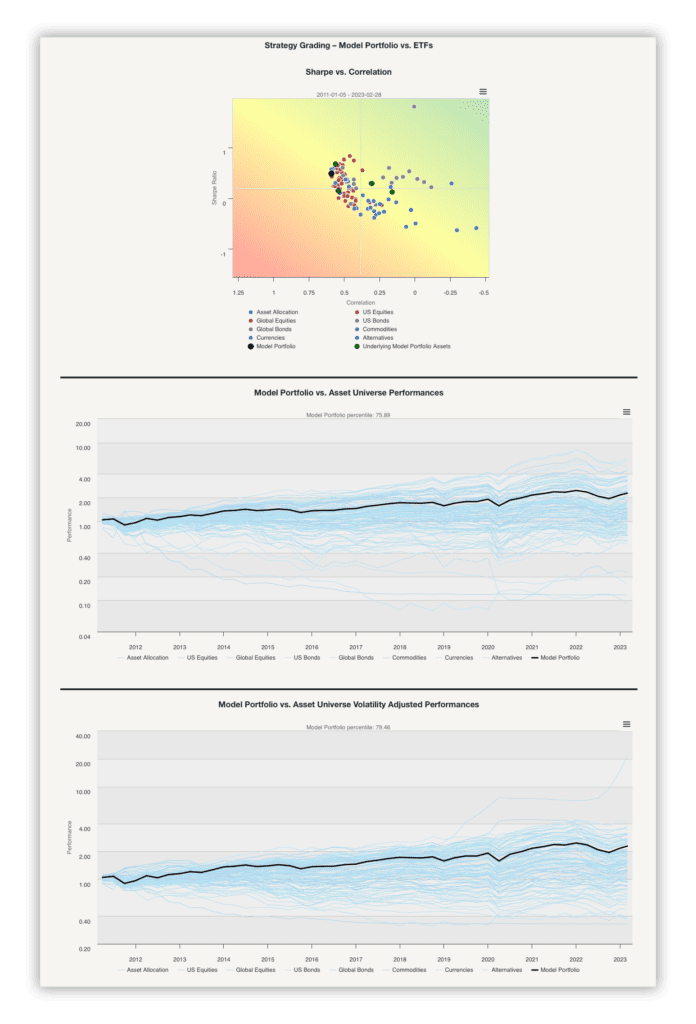
Strategy Grading – is a collection of 10 charts that provide a comprehensive evaluation of the Model Portfolio in relation to the broader range of investment strategies. The report includes the first five charts, which compare the Model Portfolio to various ETFs, and the following five charts, which assess its performance against strategies meticulously backtested by Quantpedia.


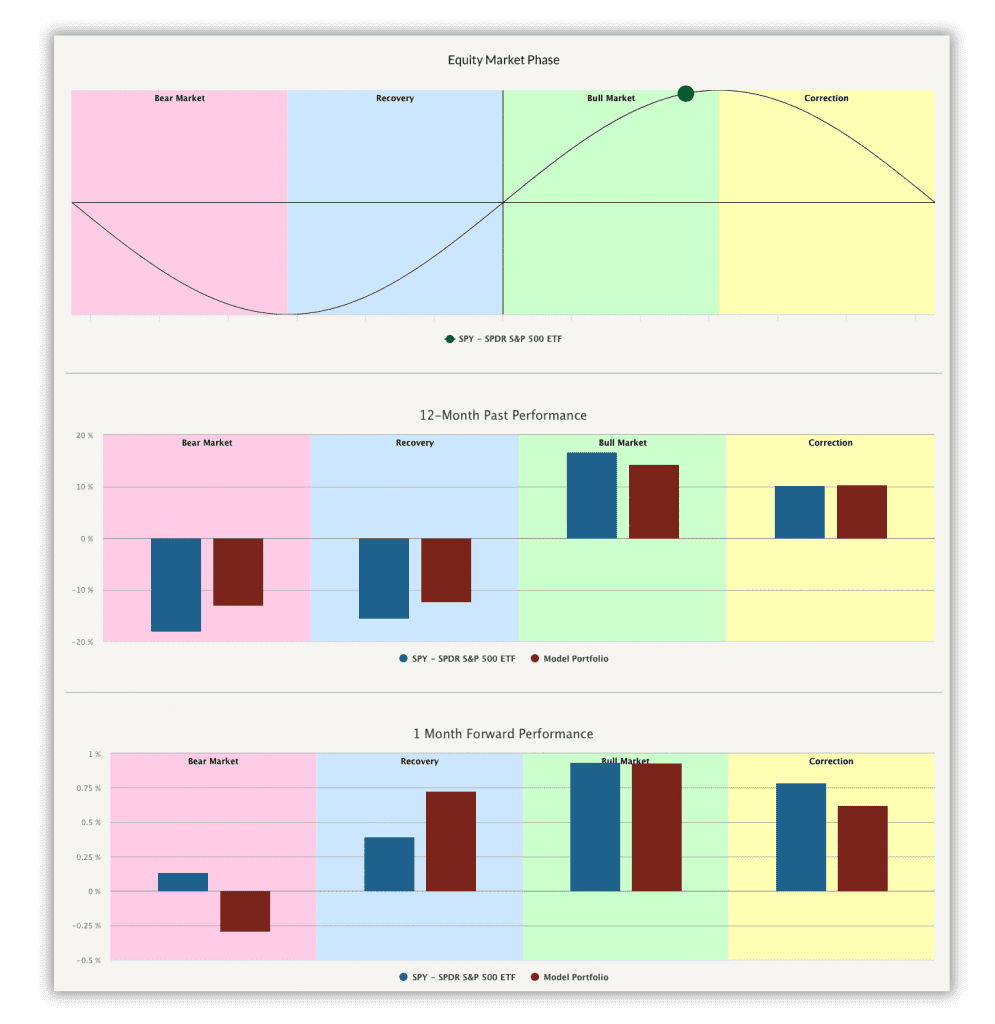
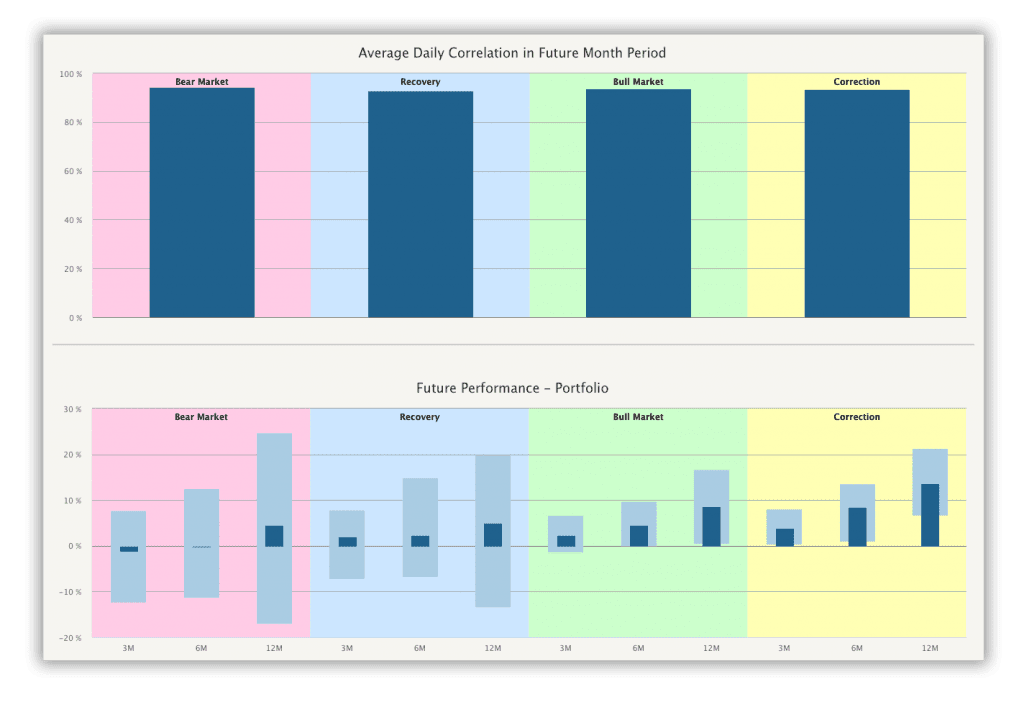
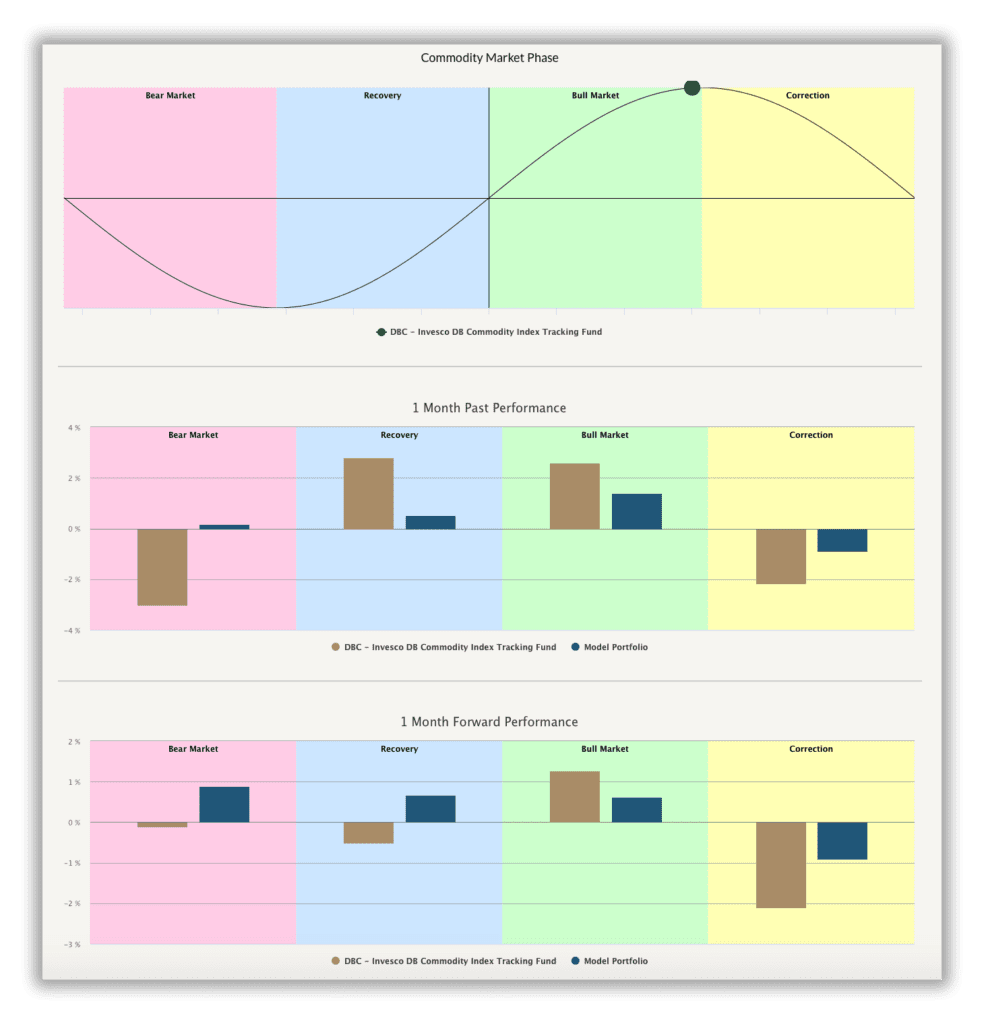
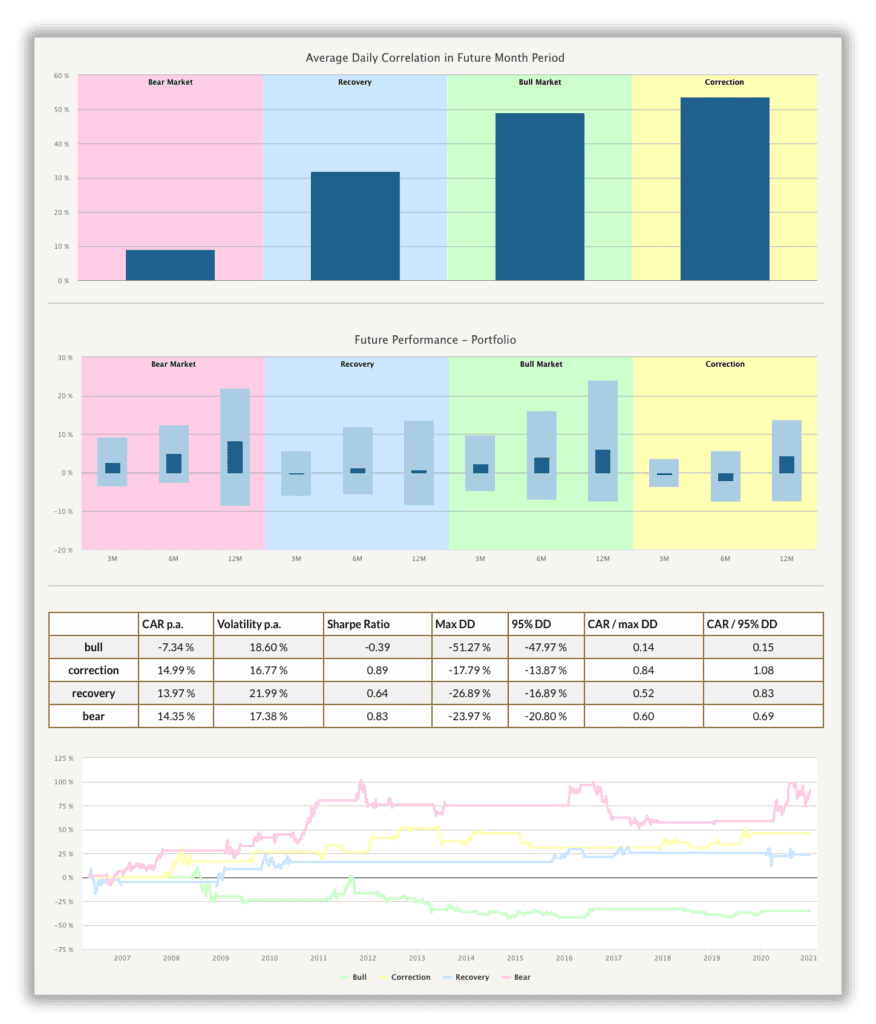
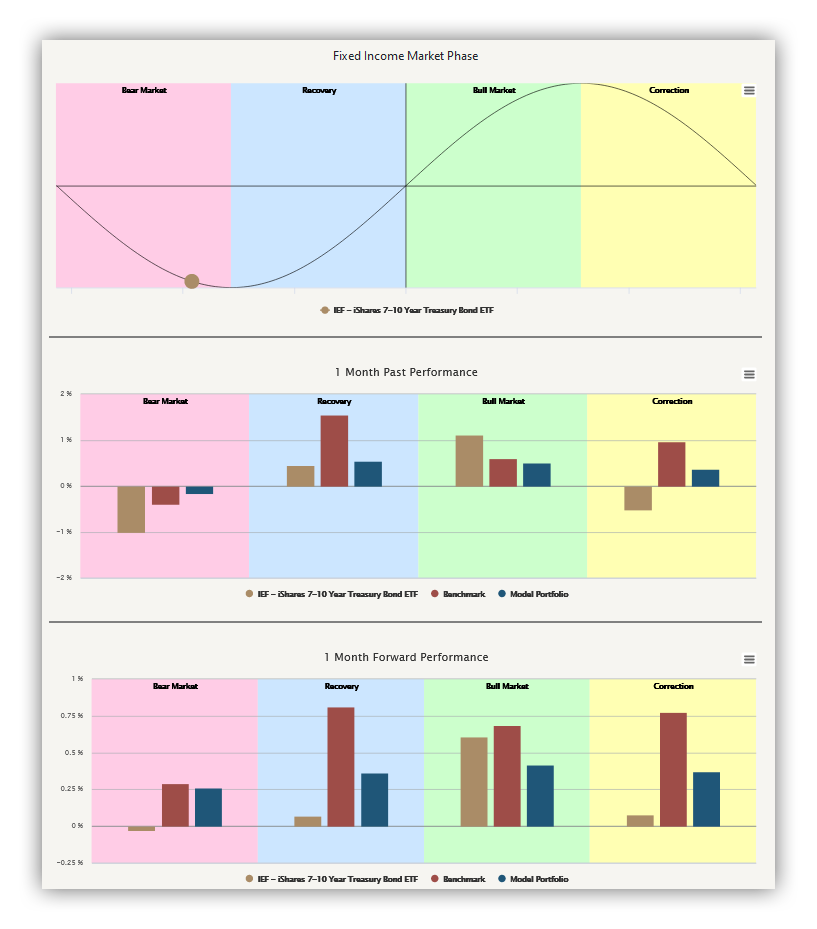
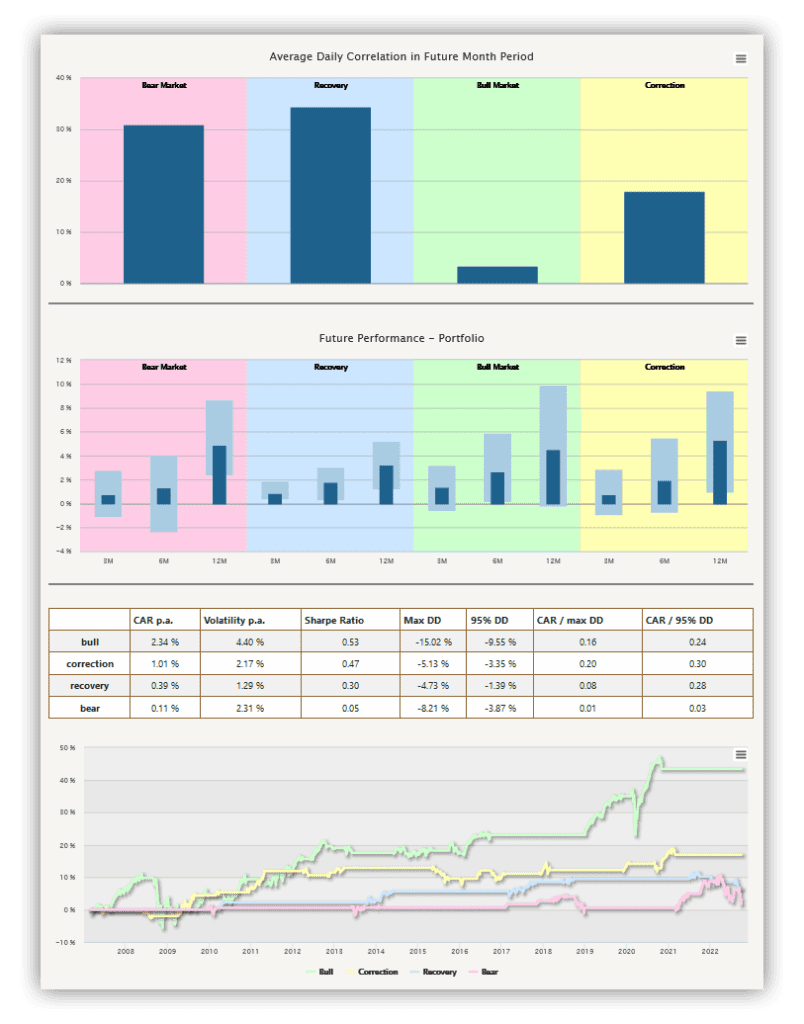
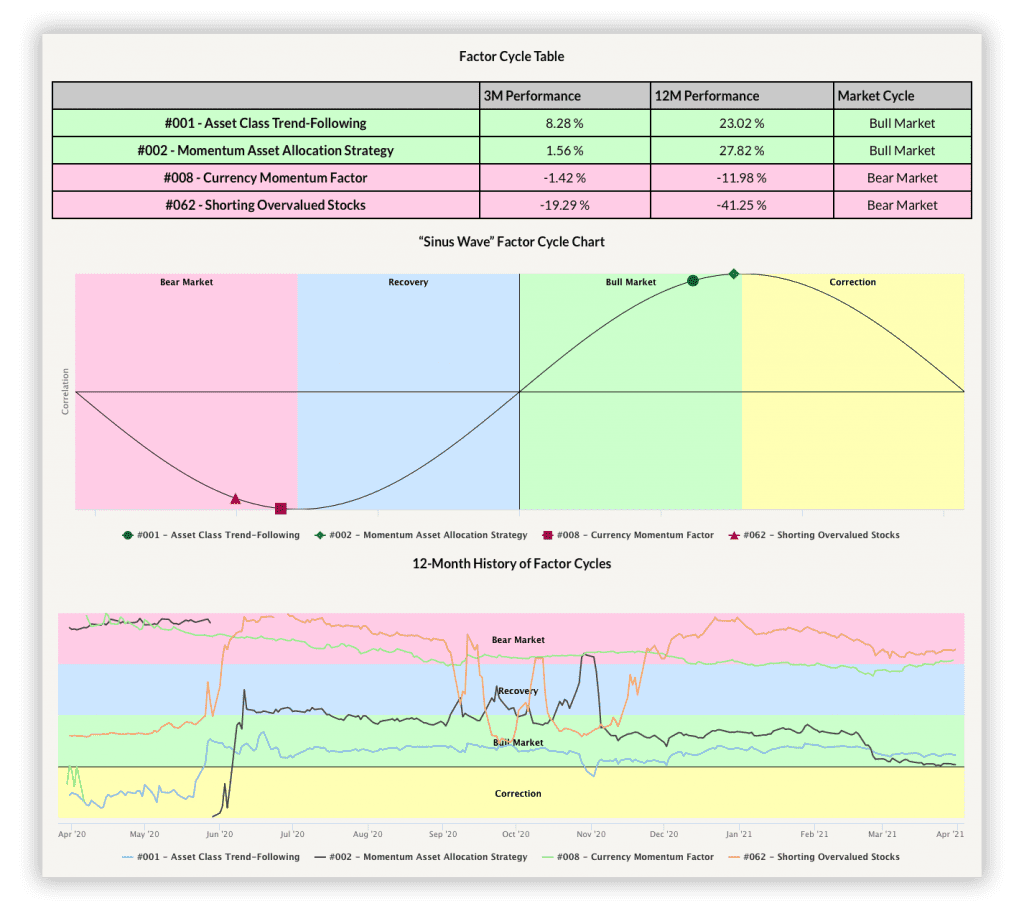
Market Phases Analysis – offers the possibility to investigate past and future average performance and correlation of benchmark SPY ETF and model portfolio in each of the four baseline market phases (bear market, recovery, bull market, correction). Visit market phases analysis case study to learn more.


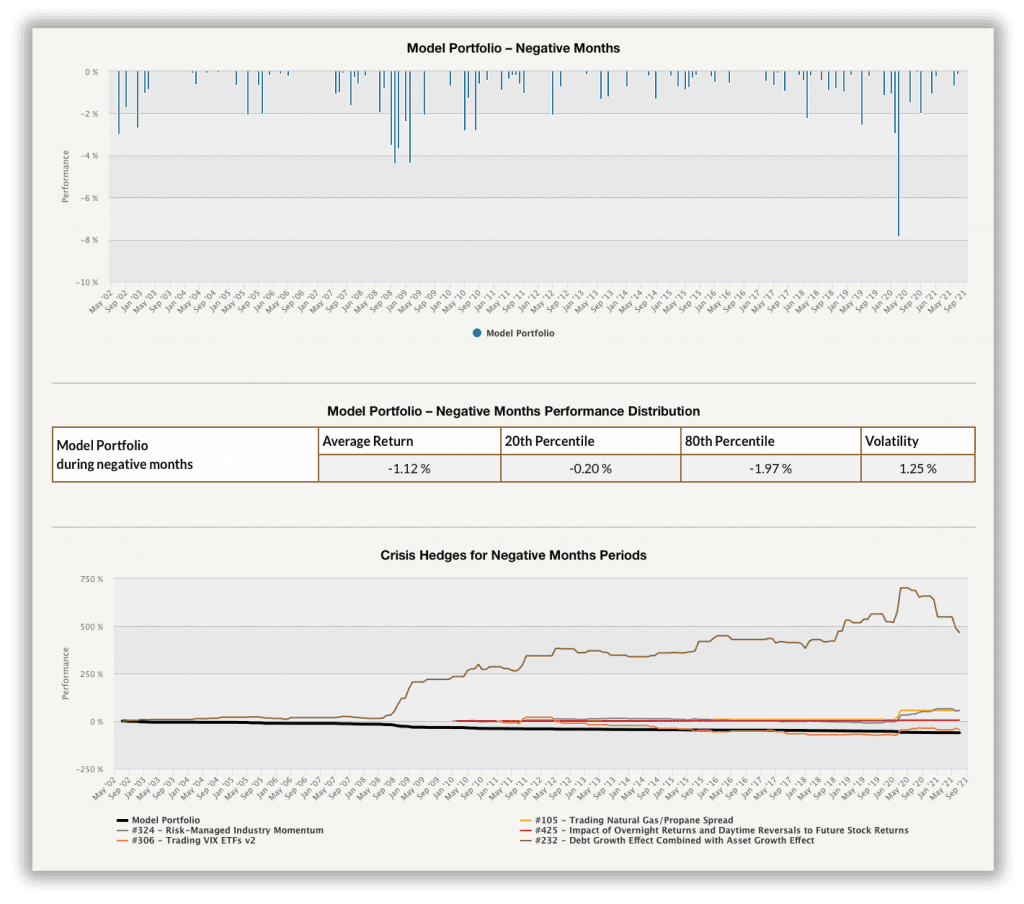
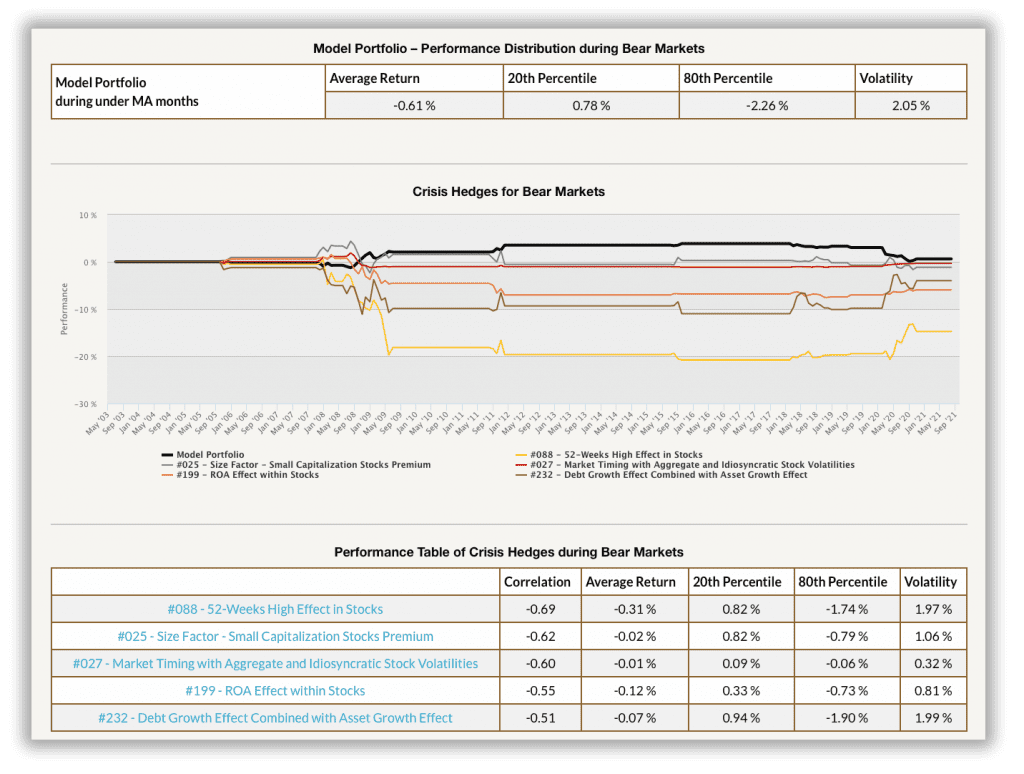
Crisis Hedge – helps you find a trading strategy that works as a hedge during negative months or bear markets. It shows performance distribution in negative periods and suggests five trading strategies with the lowest downside correlation. Visit our announcement blog for the Crisis Hedge report to learn more.
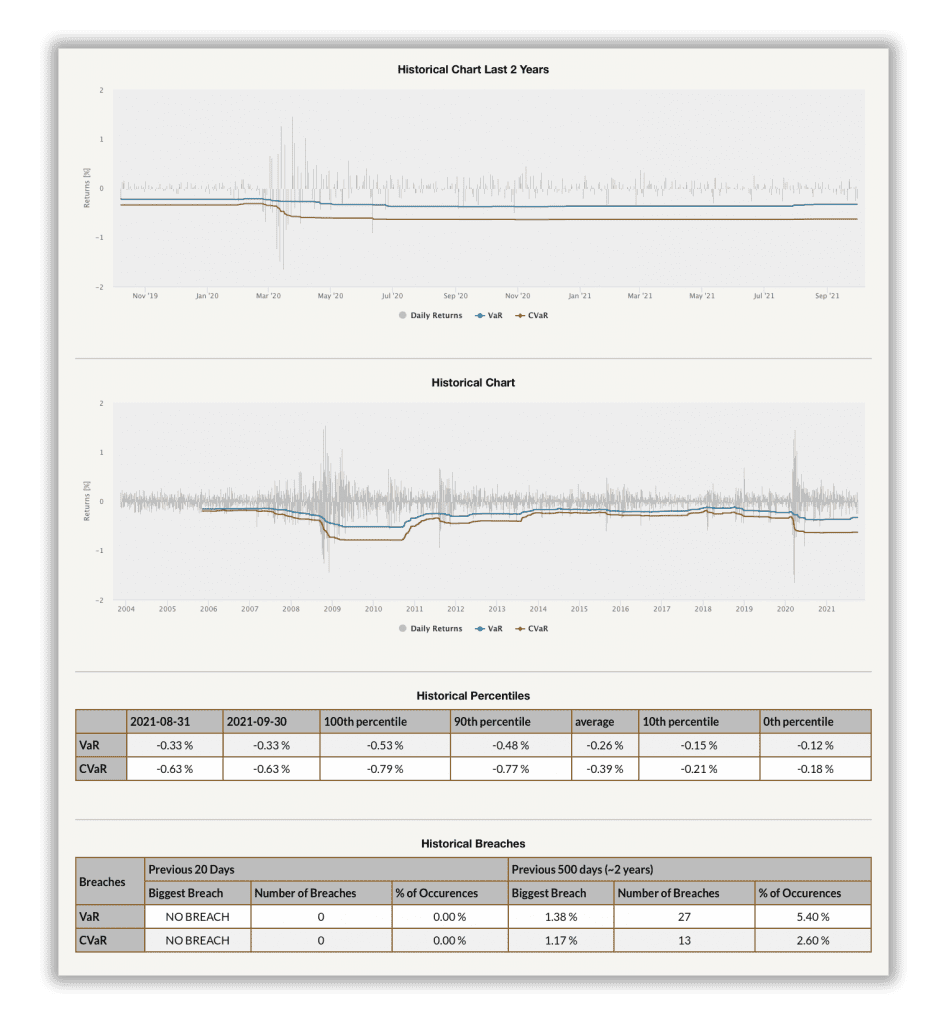
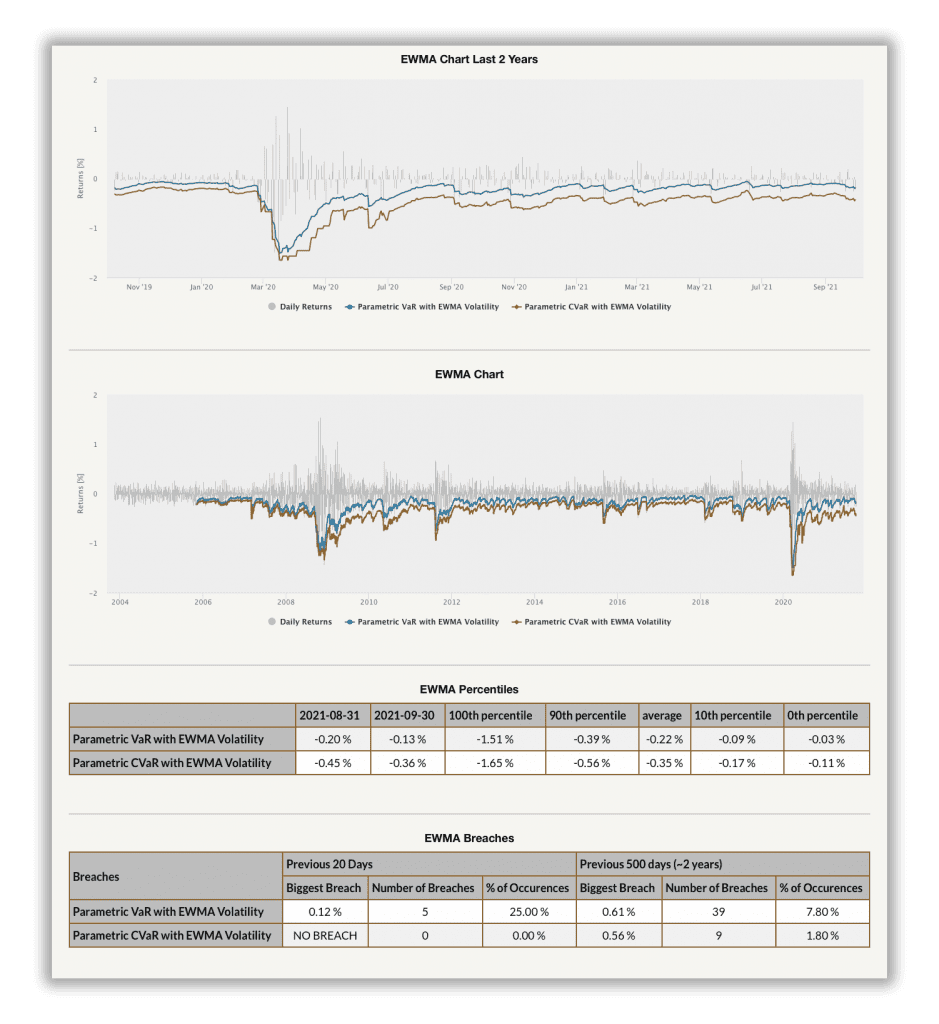
Value-at-Risk – is the maximum loss with a given probability, in an established period, with an assumed probability distribution, and under standard market conditions. In this report, you can review VaR and CVaR magnitudes during various periods. Thus, it helps to understand what level of risk we can expect during a crisis to better prepare for it. For more details visit our An Introduction to Value at Risk Methodologies article.

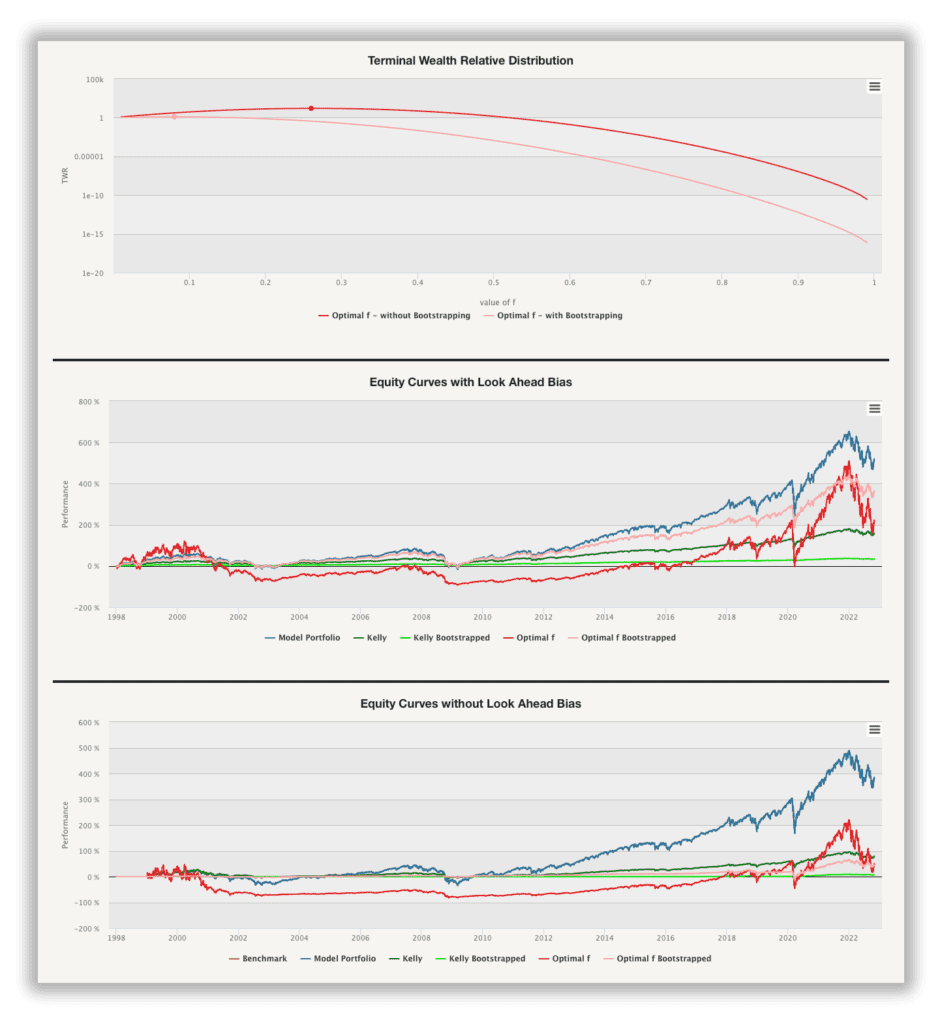
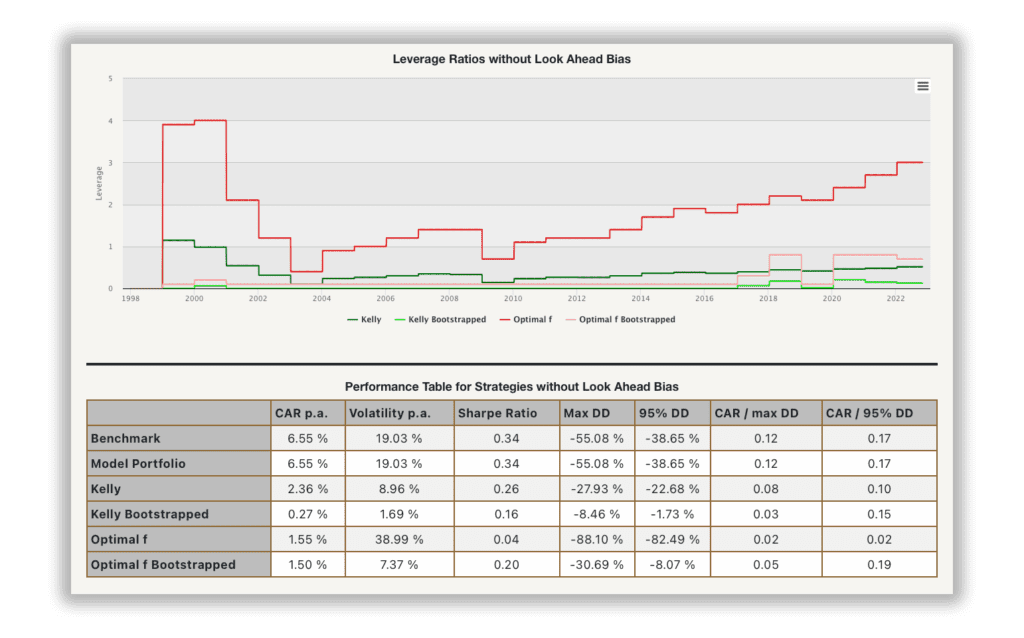
Kelly & Optimal F – primarily focus on the position sizing of a portfolio, which could help investors and traders choose the proper volume of investment. As a result, they do not overbet when assessing the maximal leverage that’s rational to employ in the model portfolio. An introduction to Kelly and Optimal F is in the subsequent article.

The Monte Carlo method – is a category of algorithm that relies on repeated random sampling to obtain different scenario results. Monte Carlo simulations are used to predict the probability of different outcomes when it would be difficult to use other approaches such as optimization. Explore some Examples of Monte Carlo Strategy Simulation in our blog.

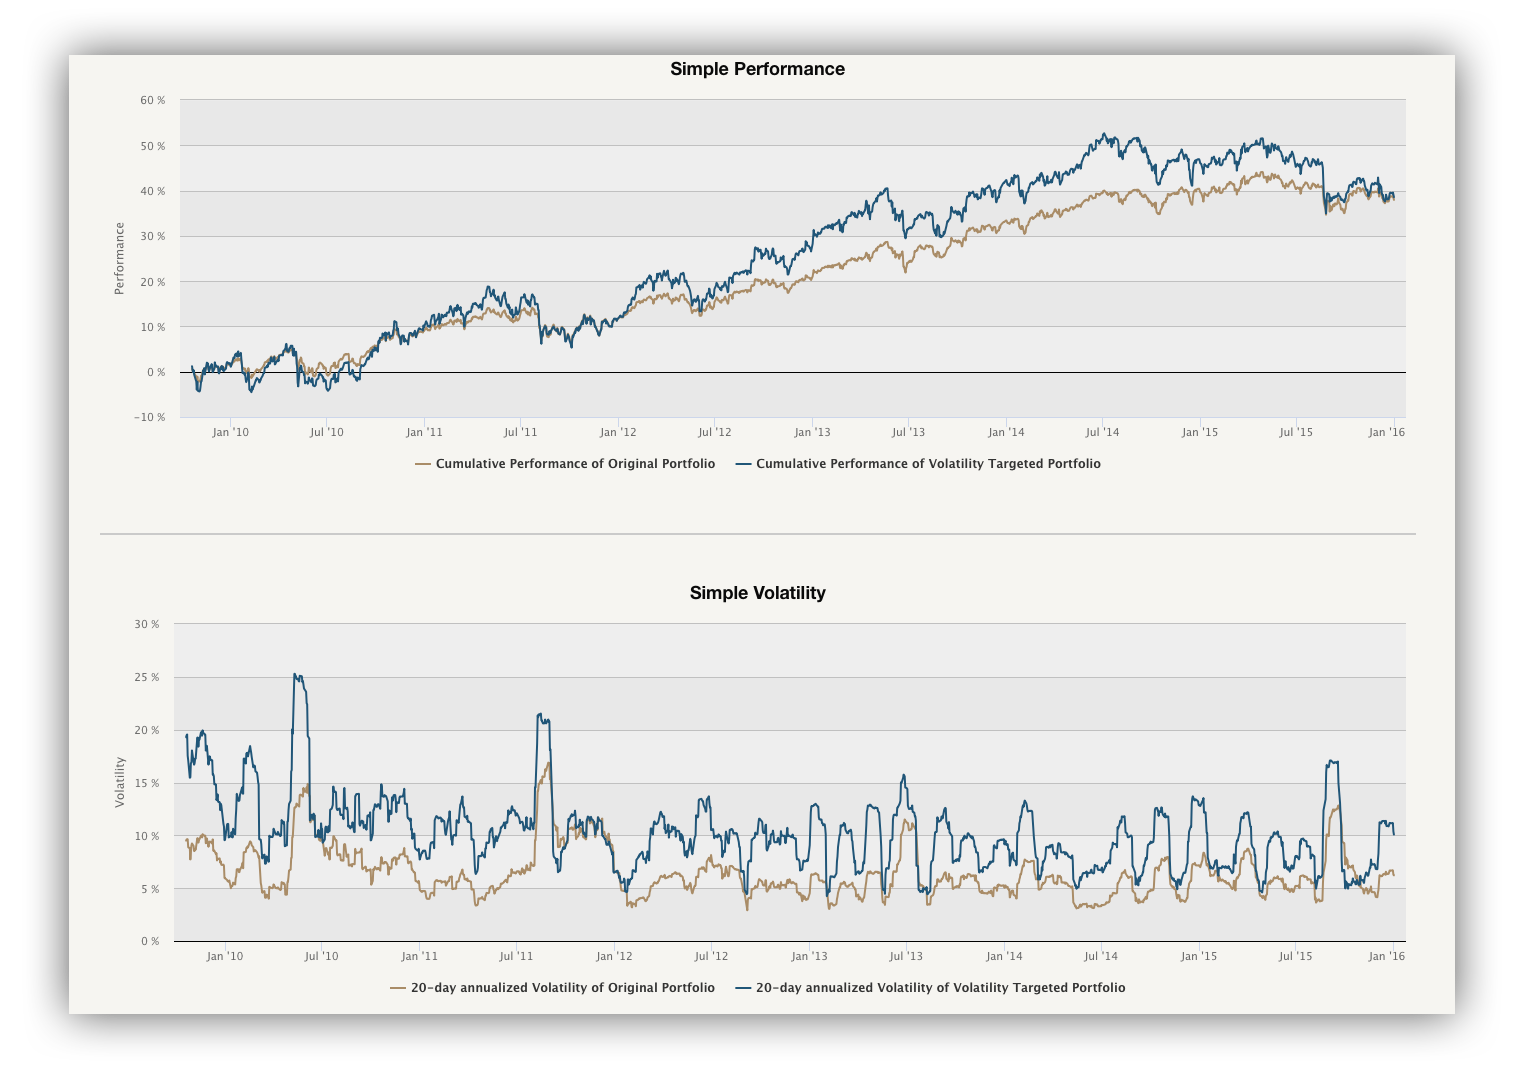
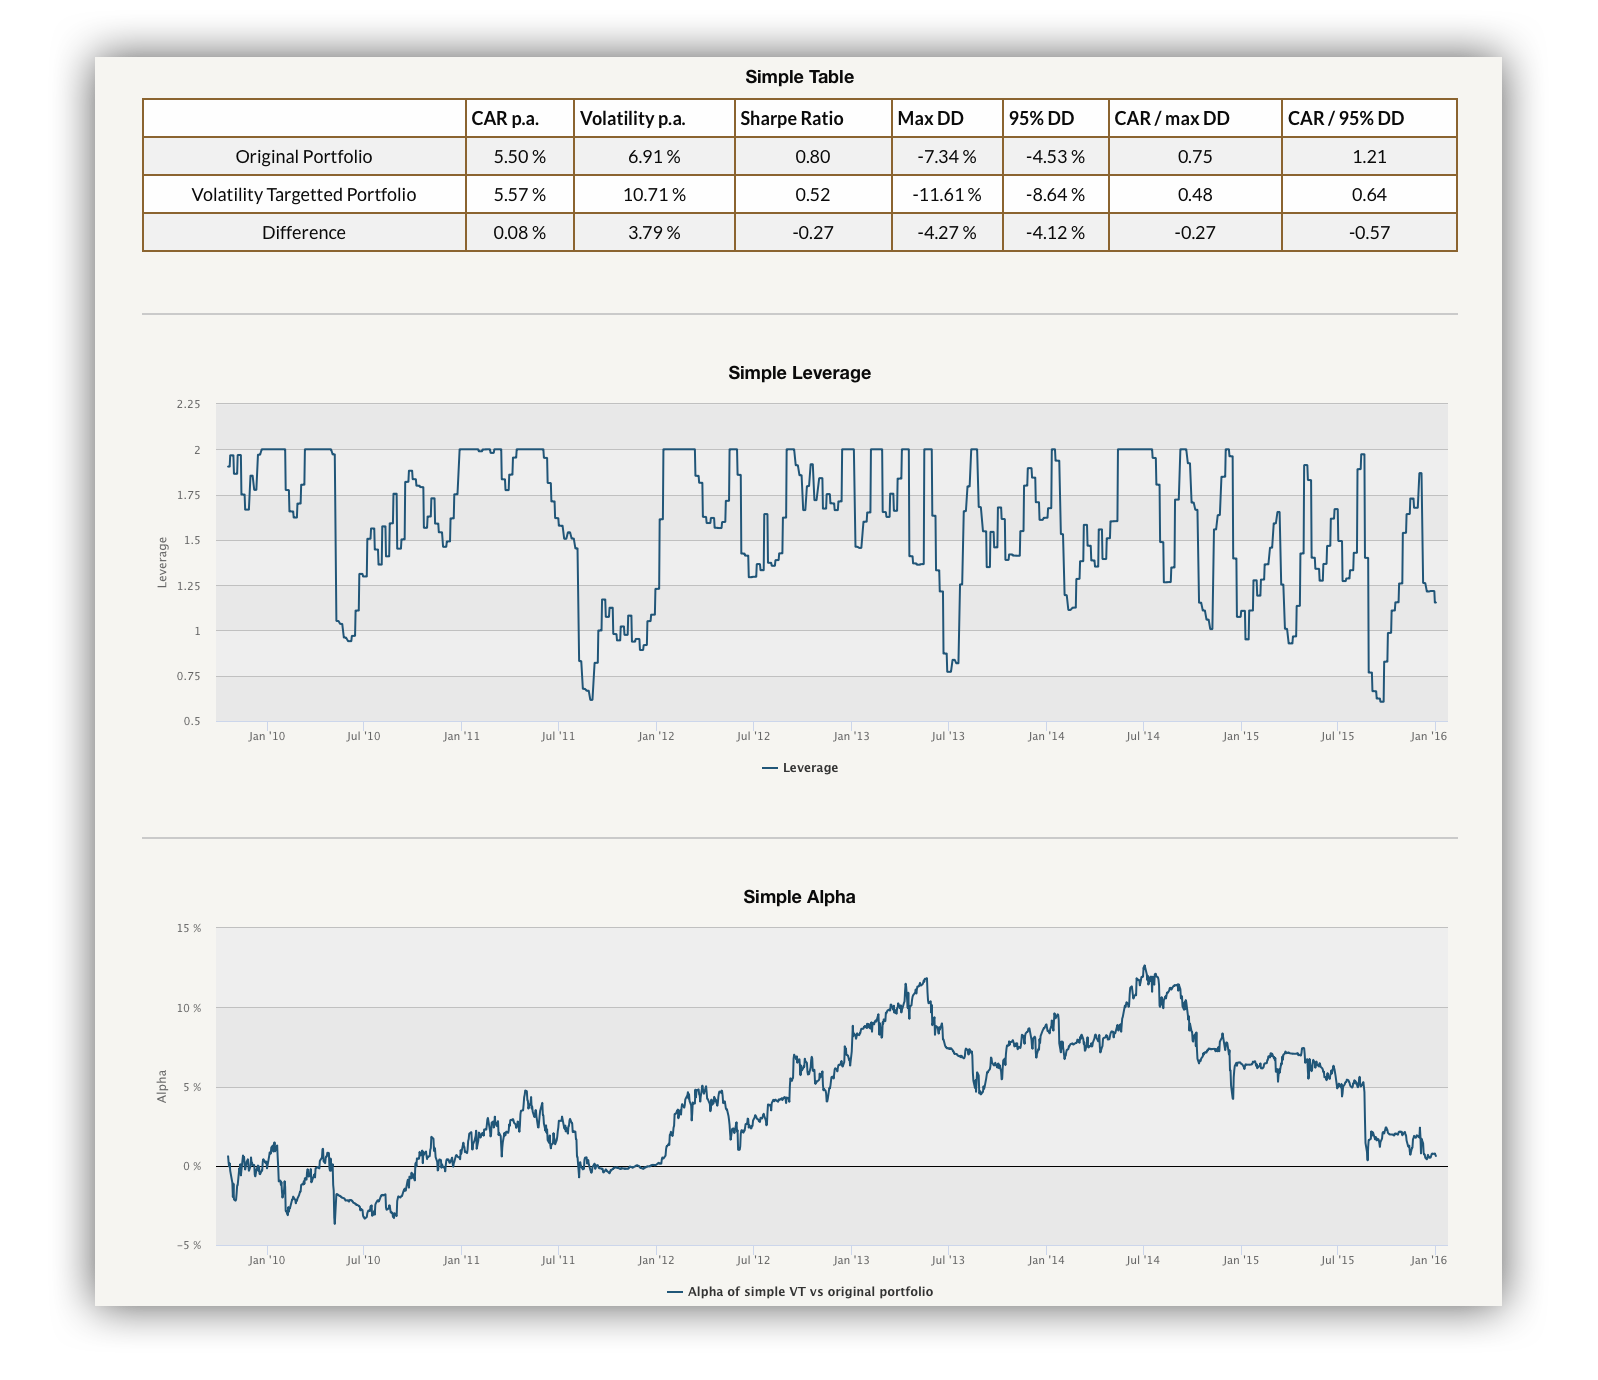
Volatility Targeting – amend your model portfolio by using one of the proposed volatility targeting methods (simple volatility, EWMA volatility, momentum-based volatility targeting). Visit our introduction into the volatility targeting methodology to learn more.

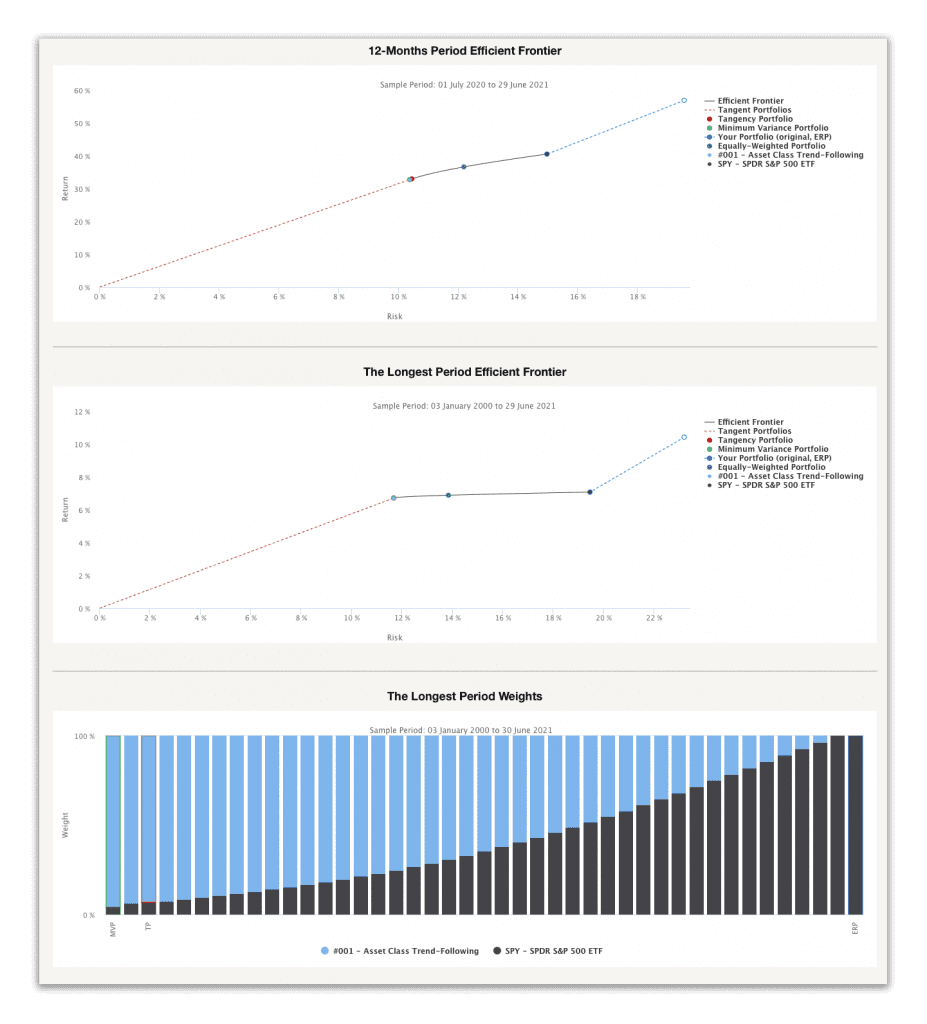
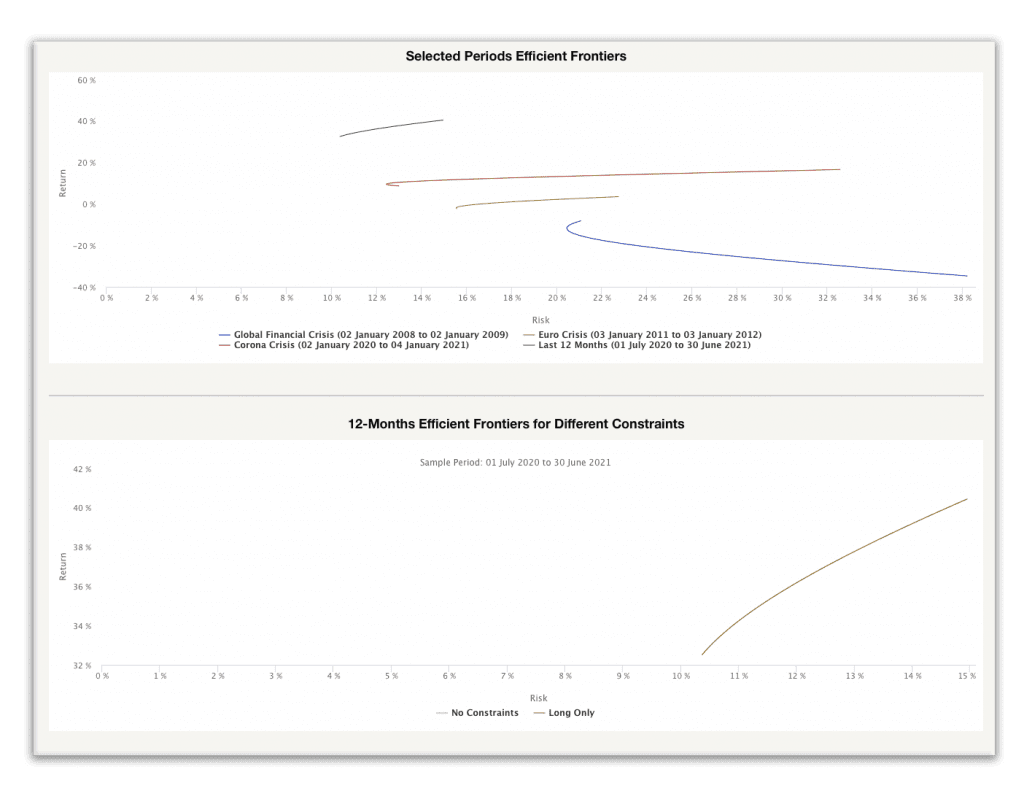
Markowitz Portfolio Optimization – aims to create the most return-to-risk efficient model portfolio by analyzing several portfolio combinations based on expected returns (mean) and standard deviations (variance) of the assets or trading strategies. Visit markowitz portfolio optimization case study subpage to learn more.


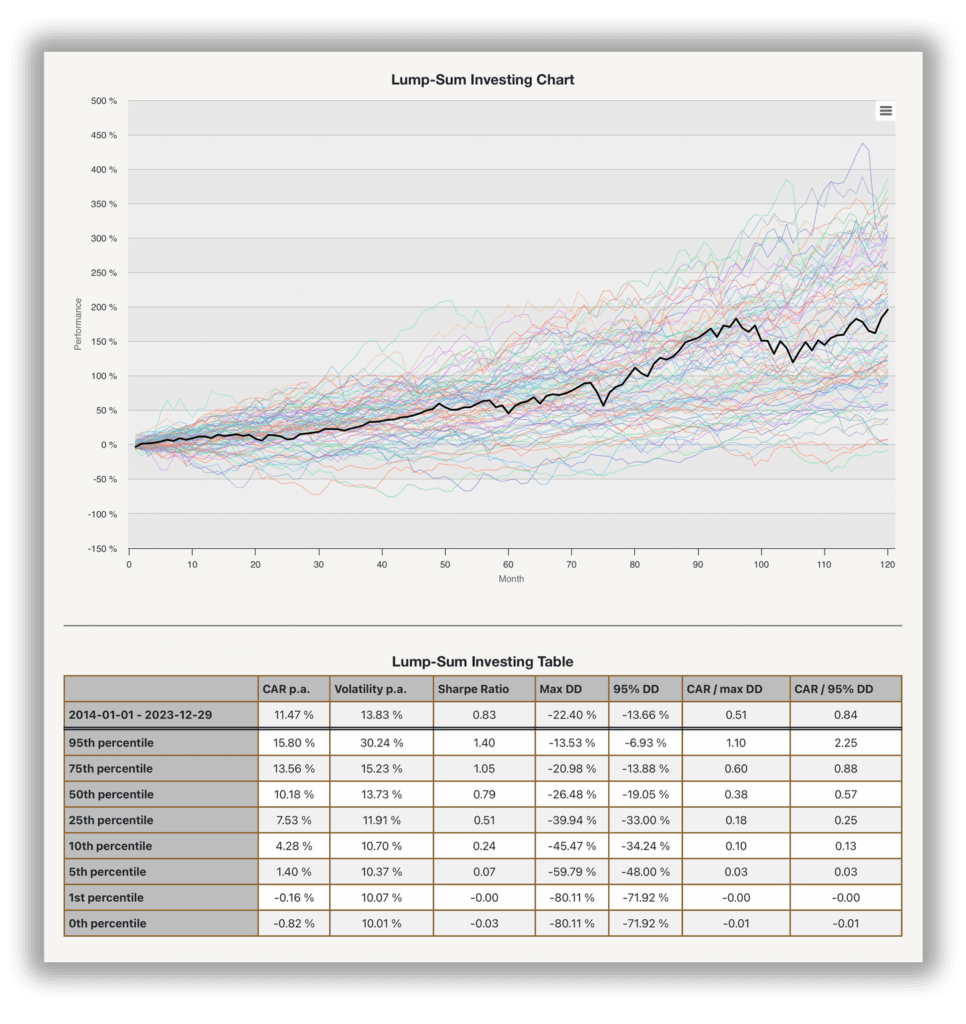
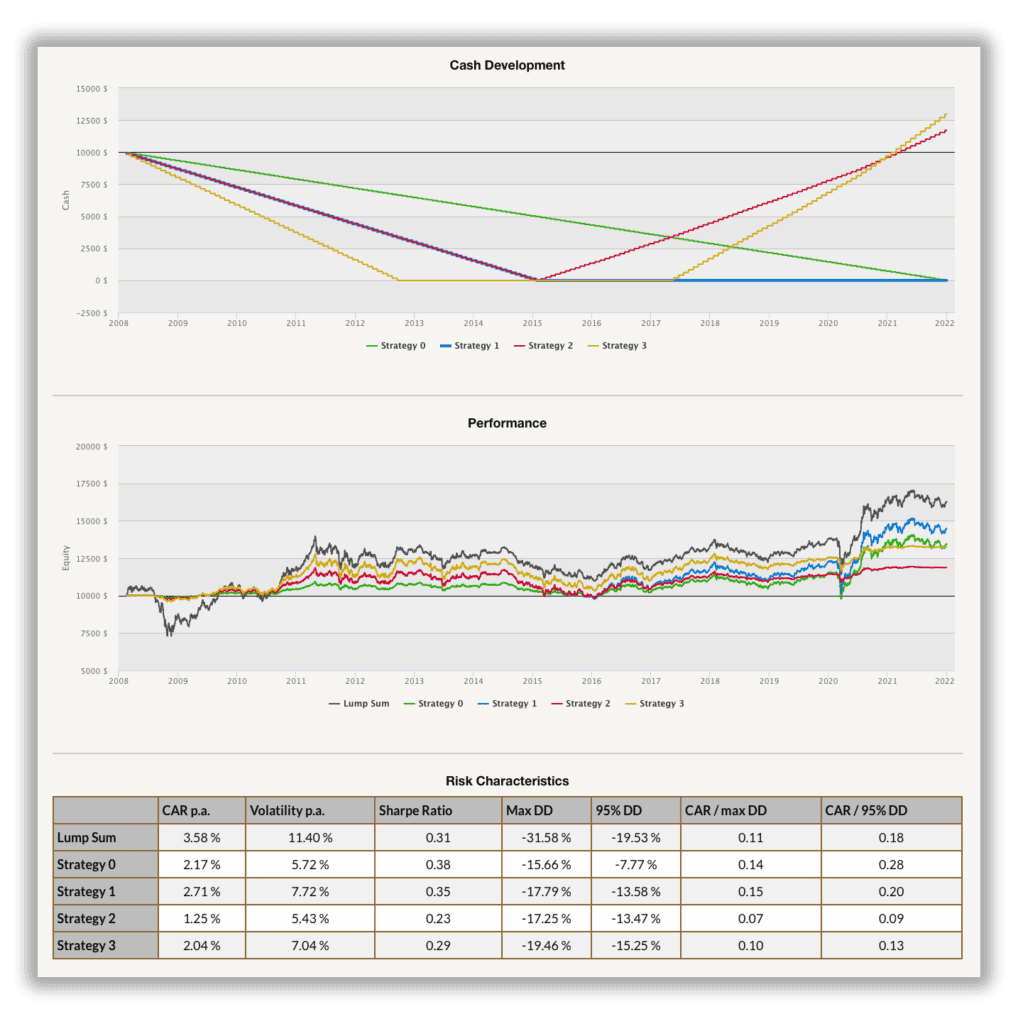
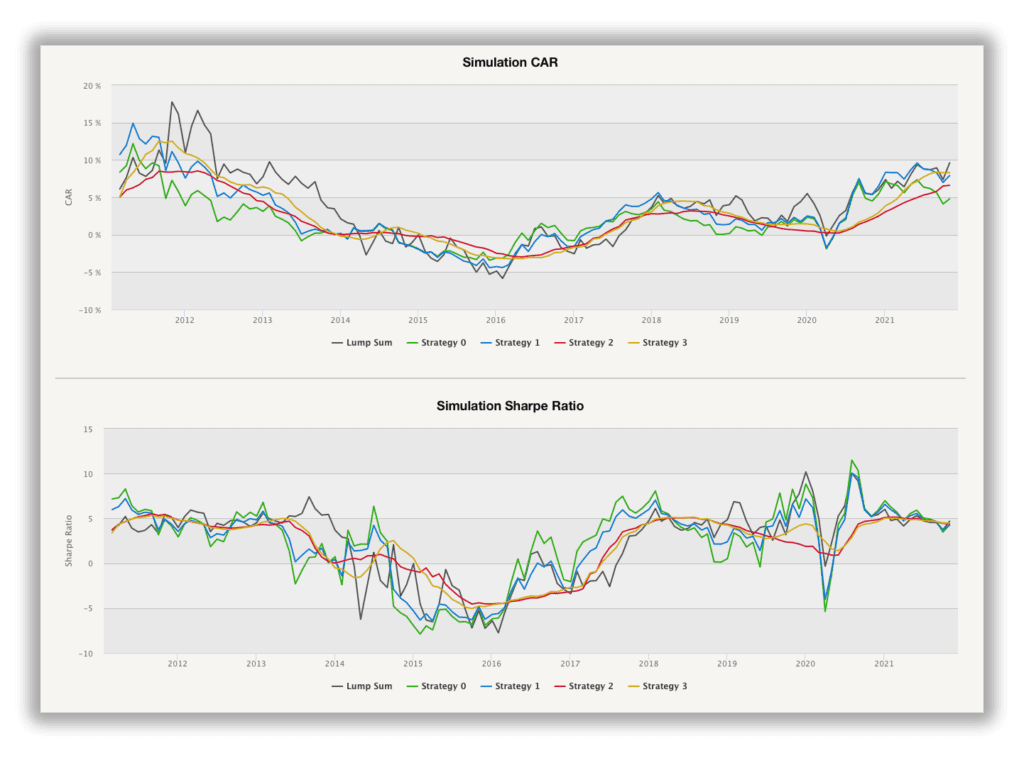
Dollar-Cost Averaging – allows our clients to test and analyze different approaches to investment and divestment of model portfolio. As a result, investors decide between making regular, piecewise investments, regardless of market conditions (Dollar-Cost Averaging), and the riskier way – investing all at once (Lump-Sum Investment). More details about Dollar-Cost Averaging is available in following article.
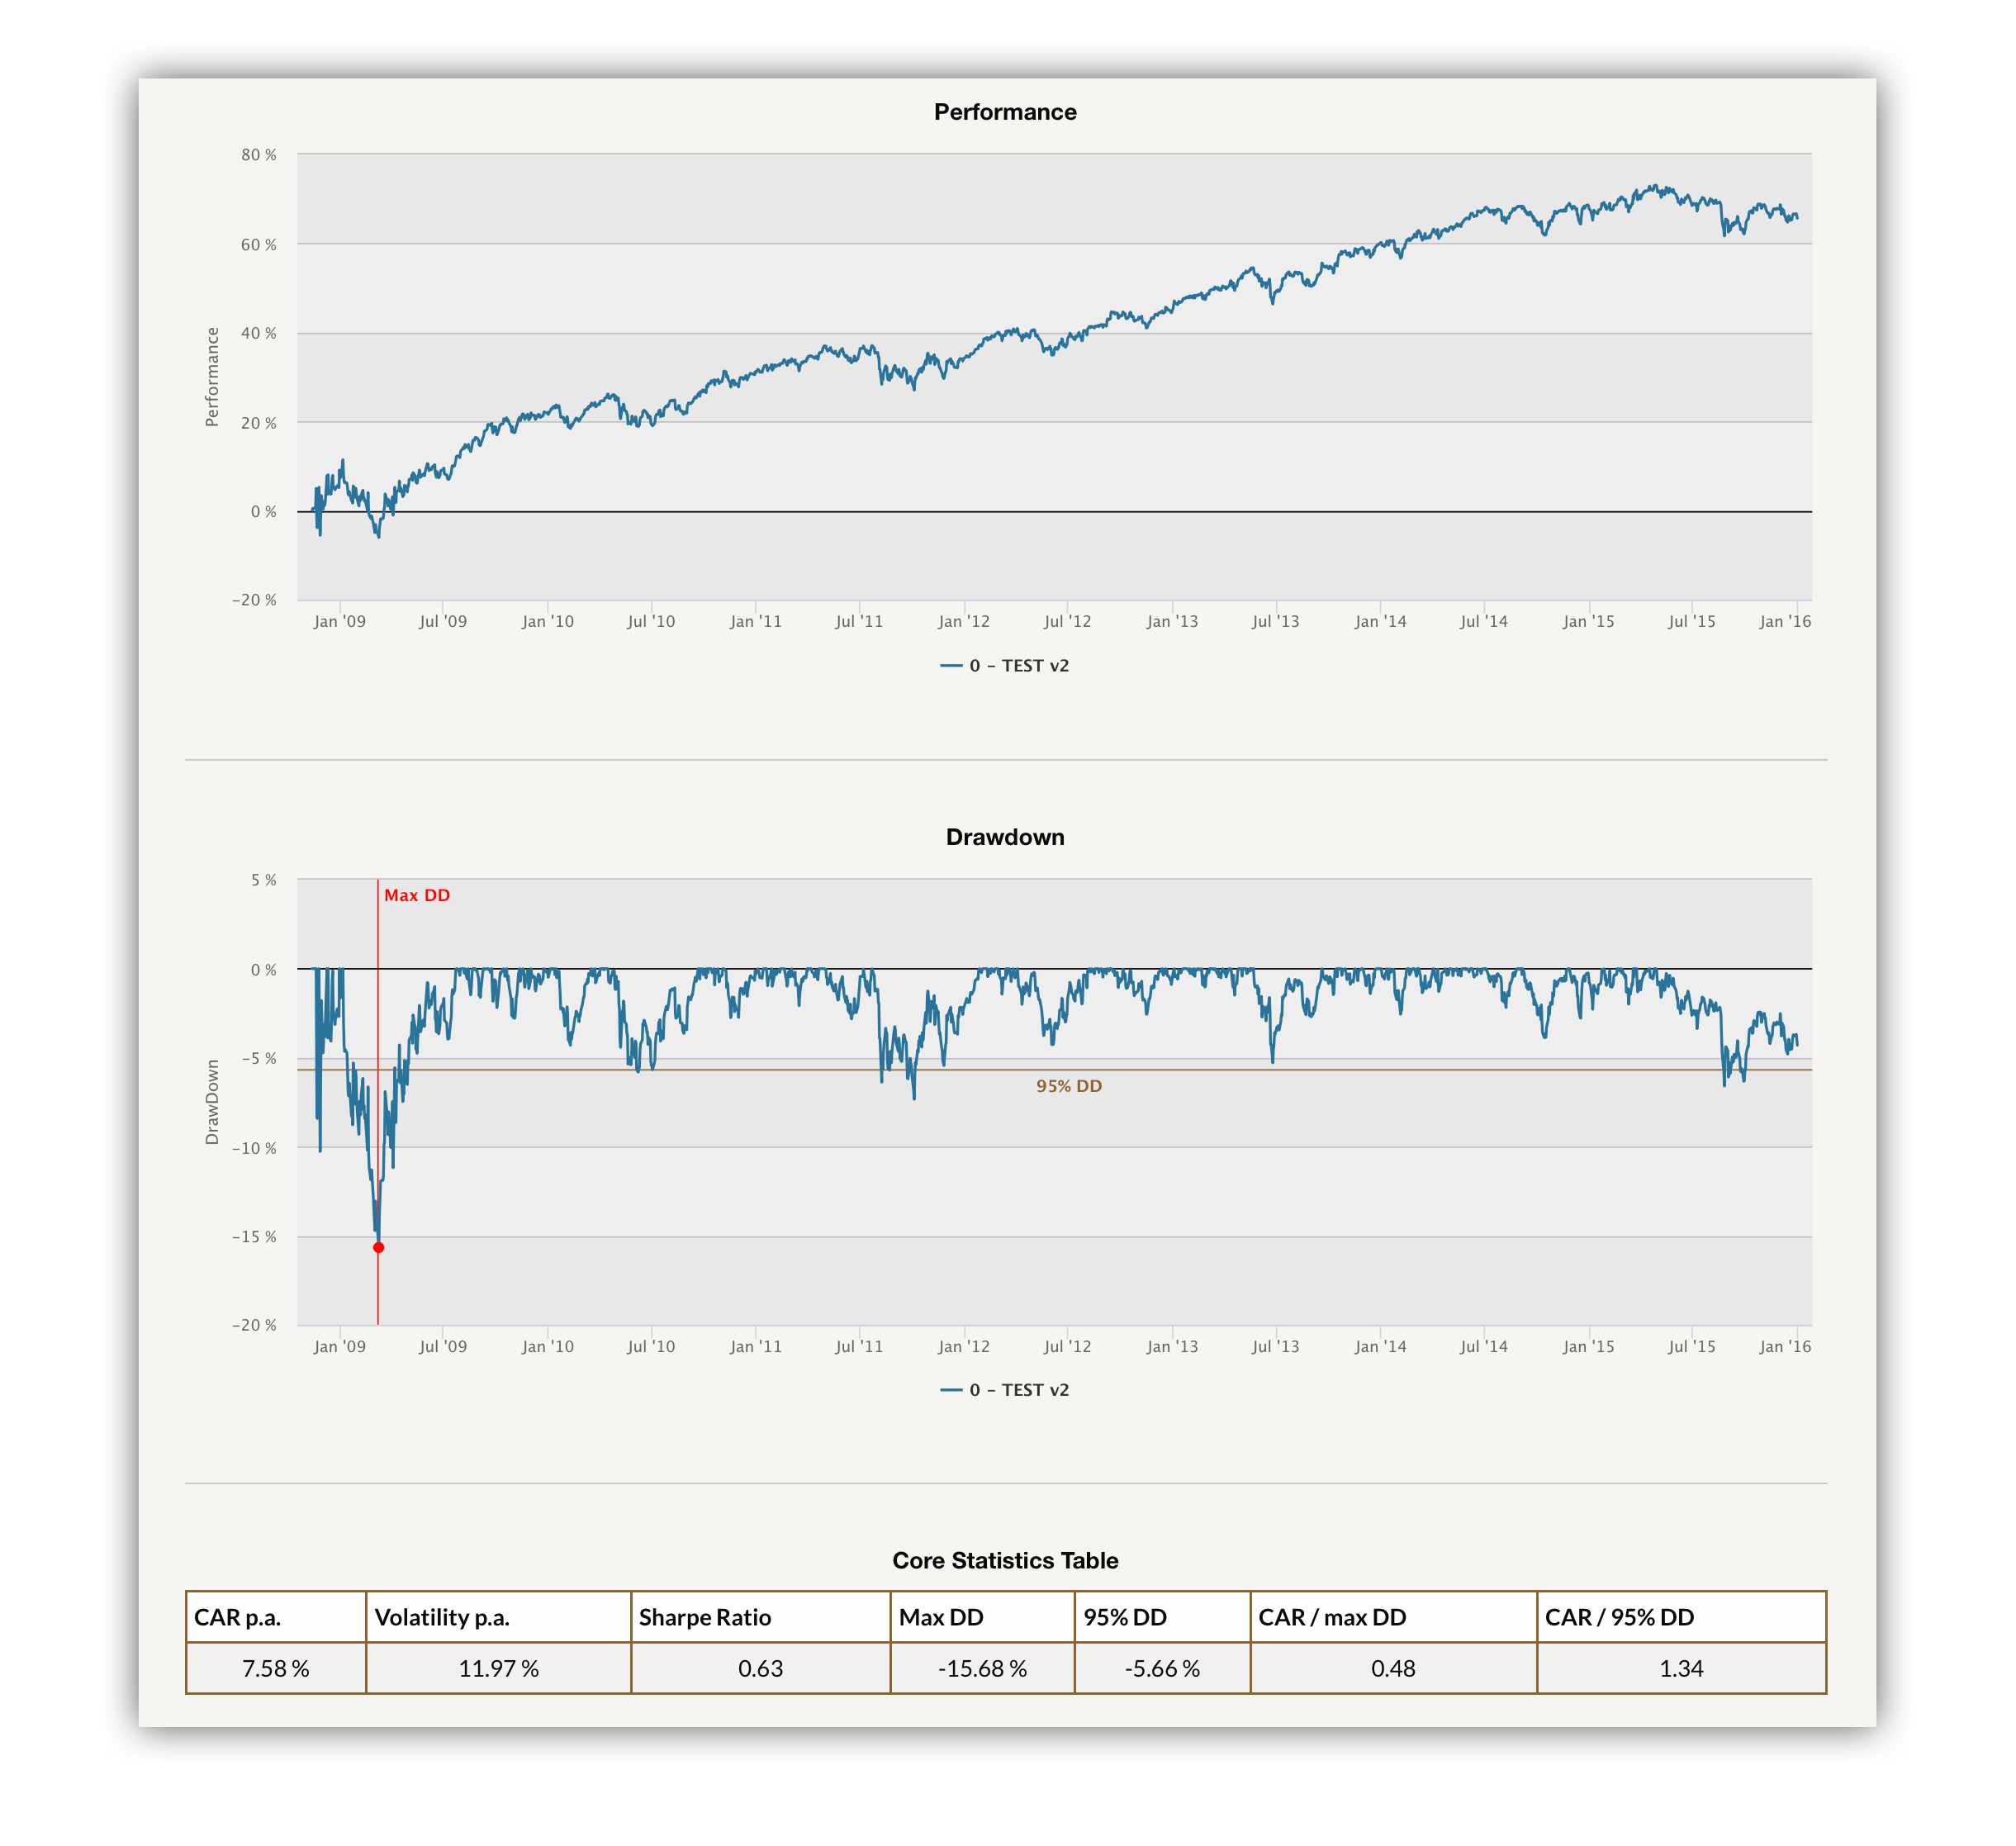
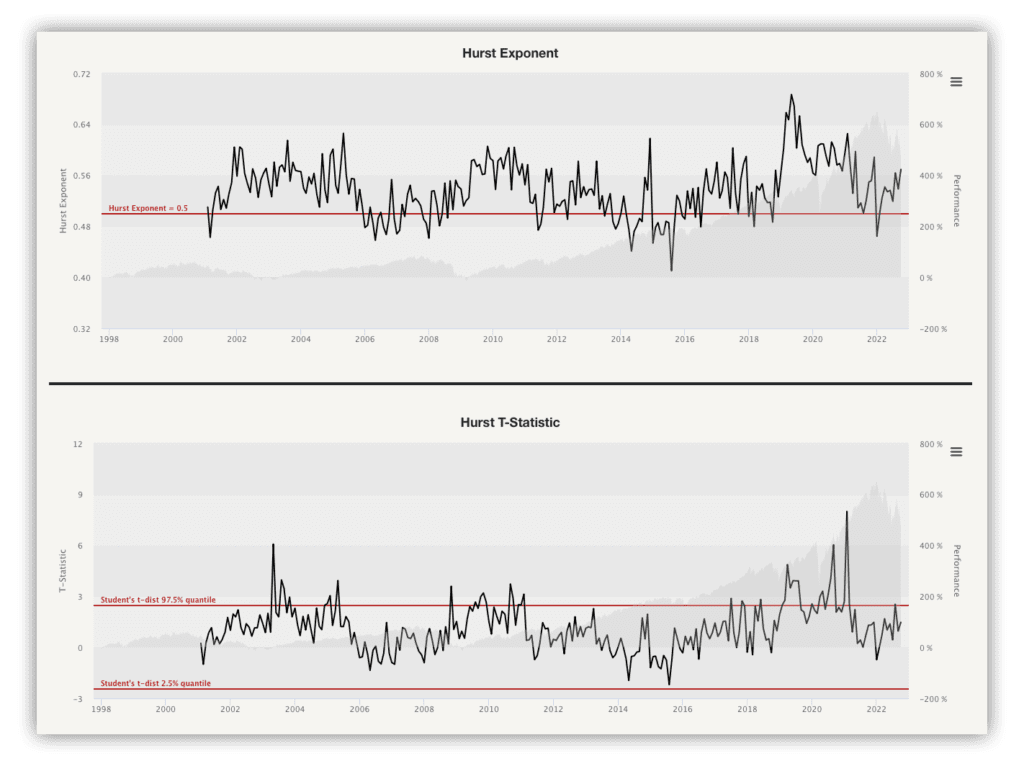
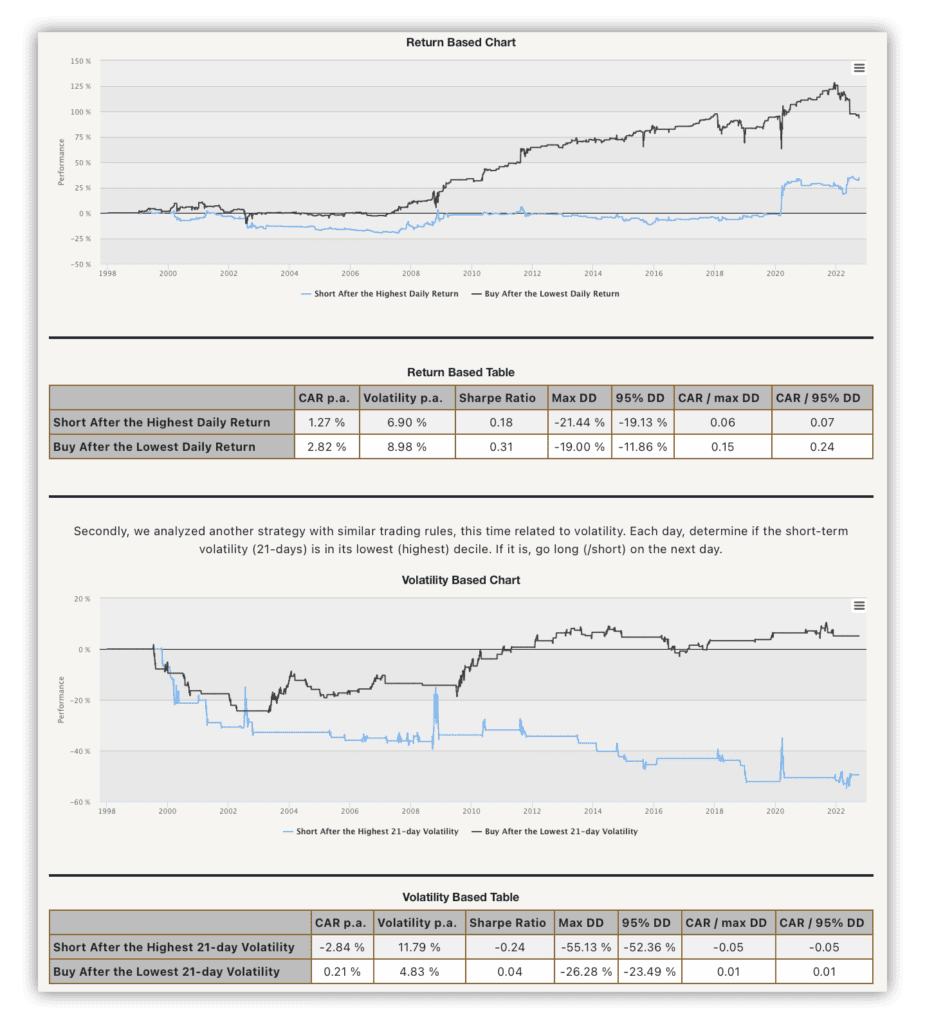
Trading Edge Analysis – allows to find which trading edges work and which don’t seem when applied to your chosen asset by analyzing statistical, empirical, and other trading properties of the underlying asset. The complete methodology for the whole Trading Edge Analysis report is described in the following article.

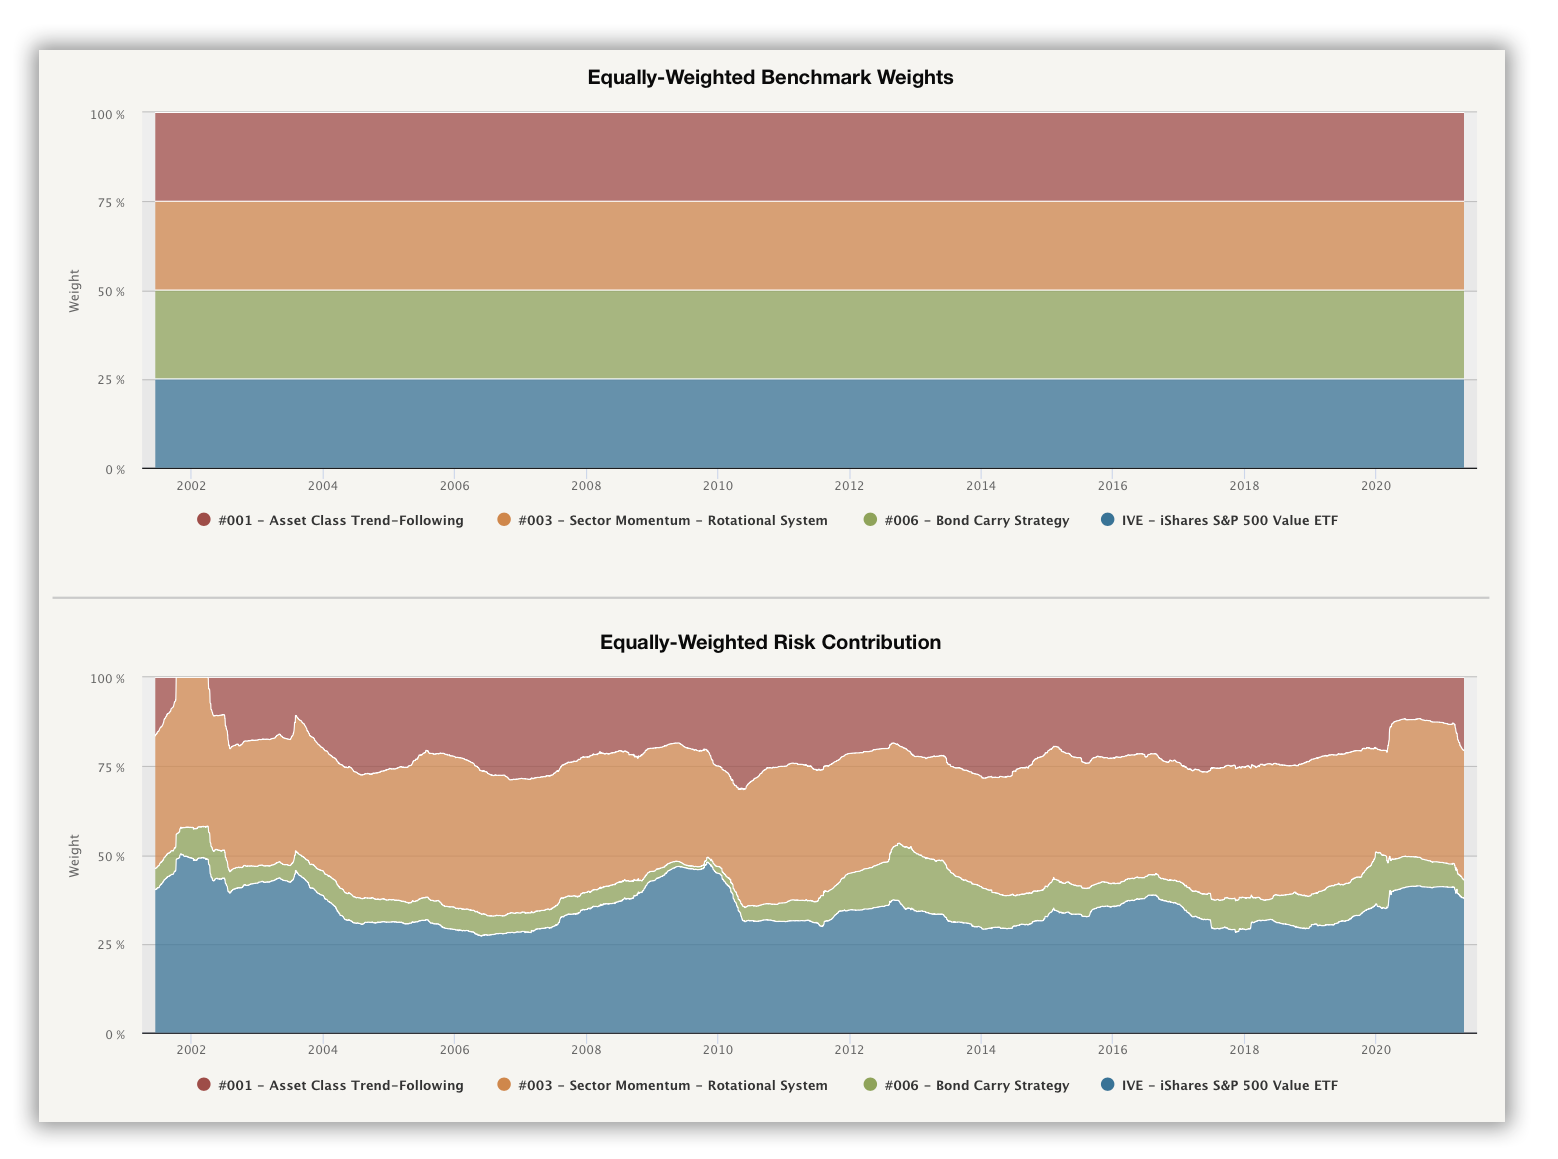
Portfolio Risk Parity – finds weights of assets selected in the Portfolio Manager that ensure an equal level of risk, most frequently measured by volatility of the individual components of the portfolio. Visit portfolio risk parity case study subpage to learn more.

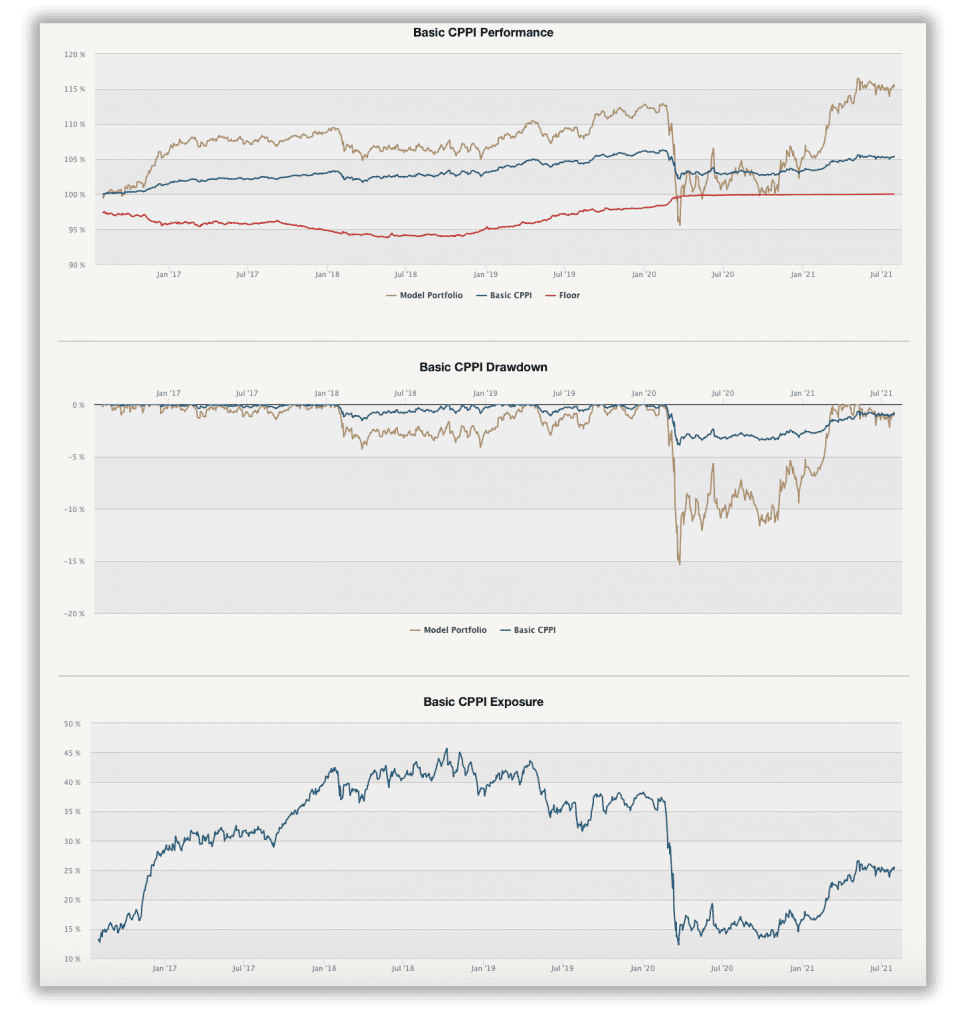
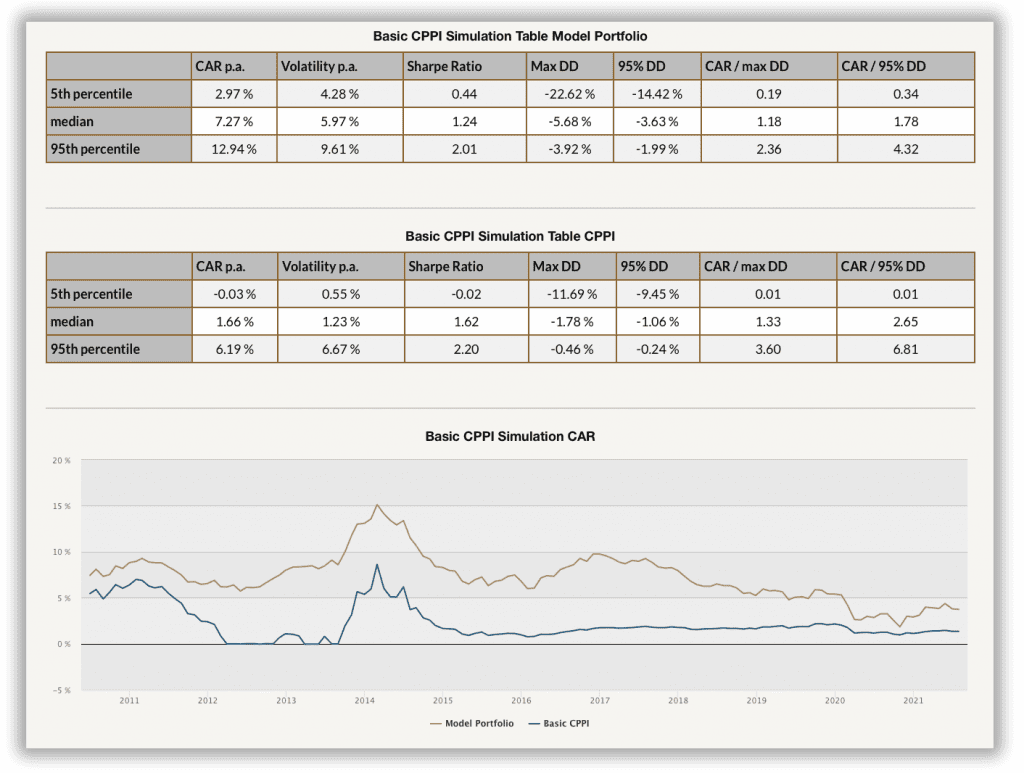
CPPI (Constant Proportion Portfolio Insurance) – is a report that helps an investor test the CPPI methodology – a position sizing model that maintains exposure to a model portfolio’s upside potential while providing a guarantee against the downside risk by dynamically scaling the weight of the model portfolio. Visit our introduction into the CPPI methodology to learn more.

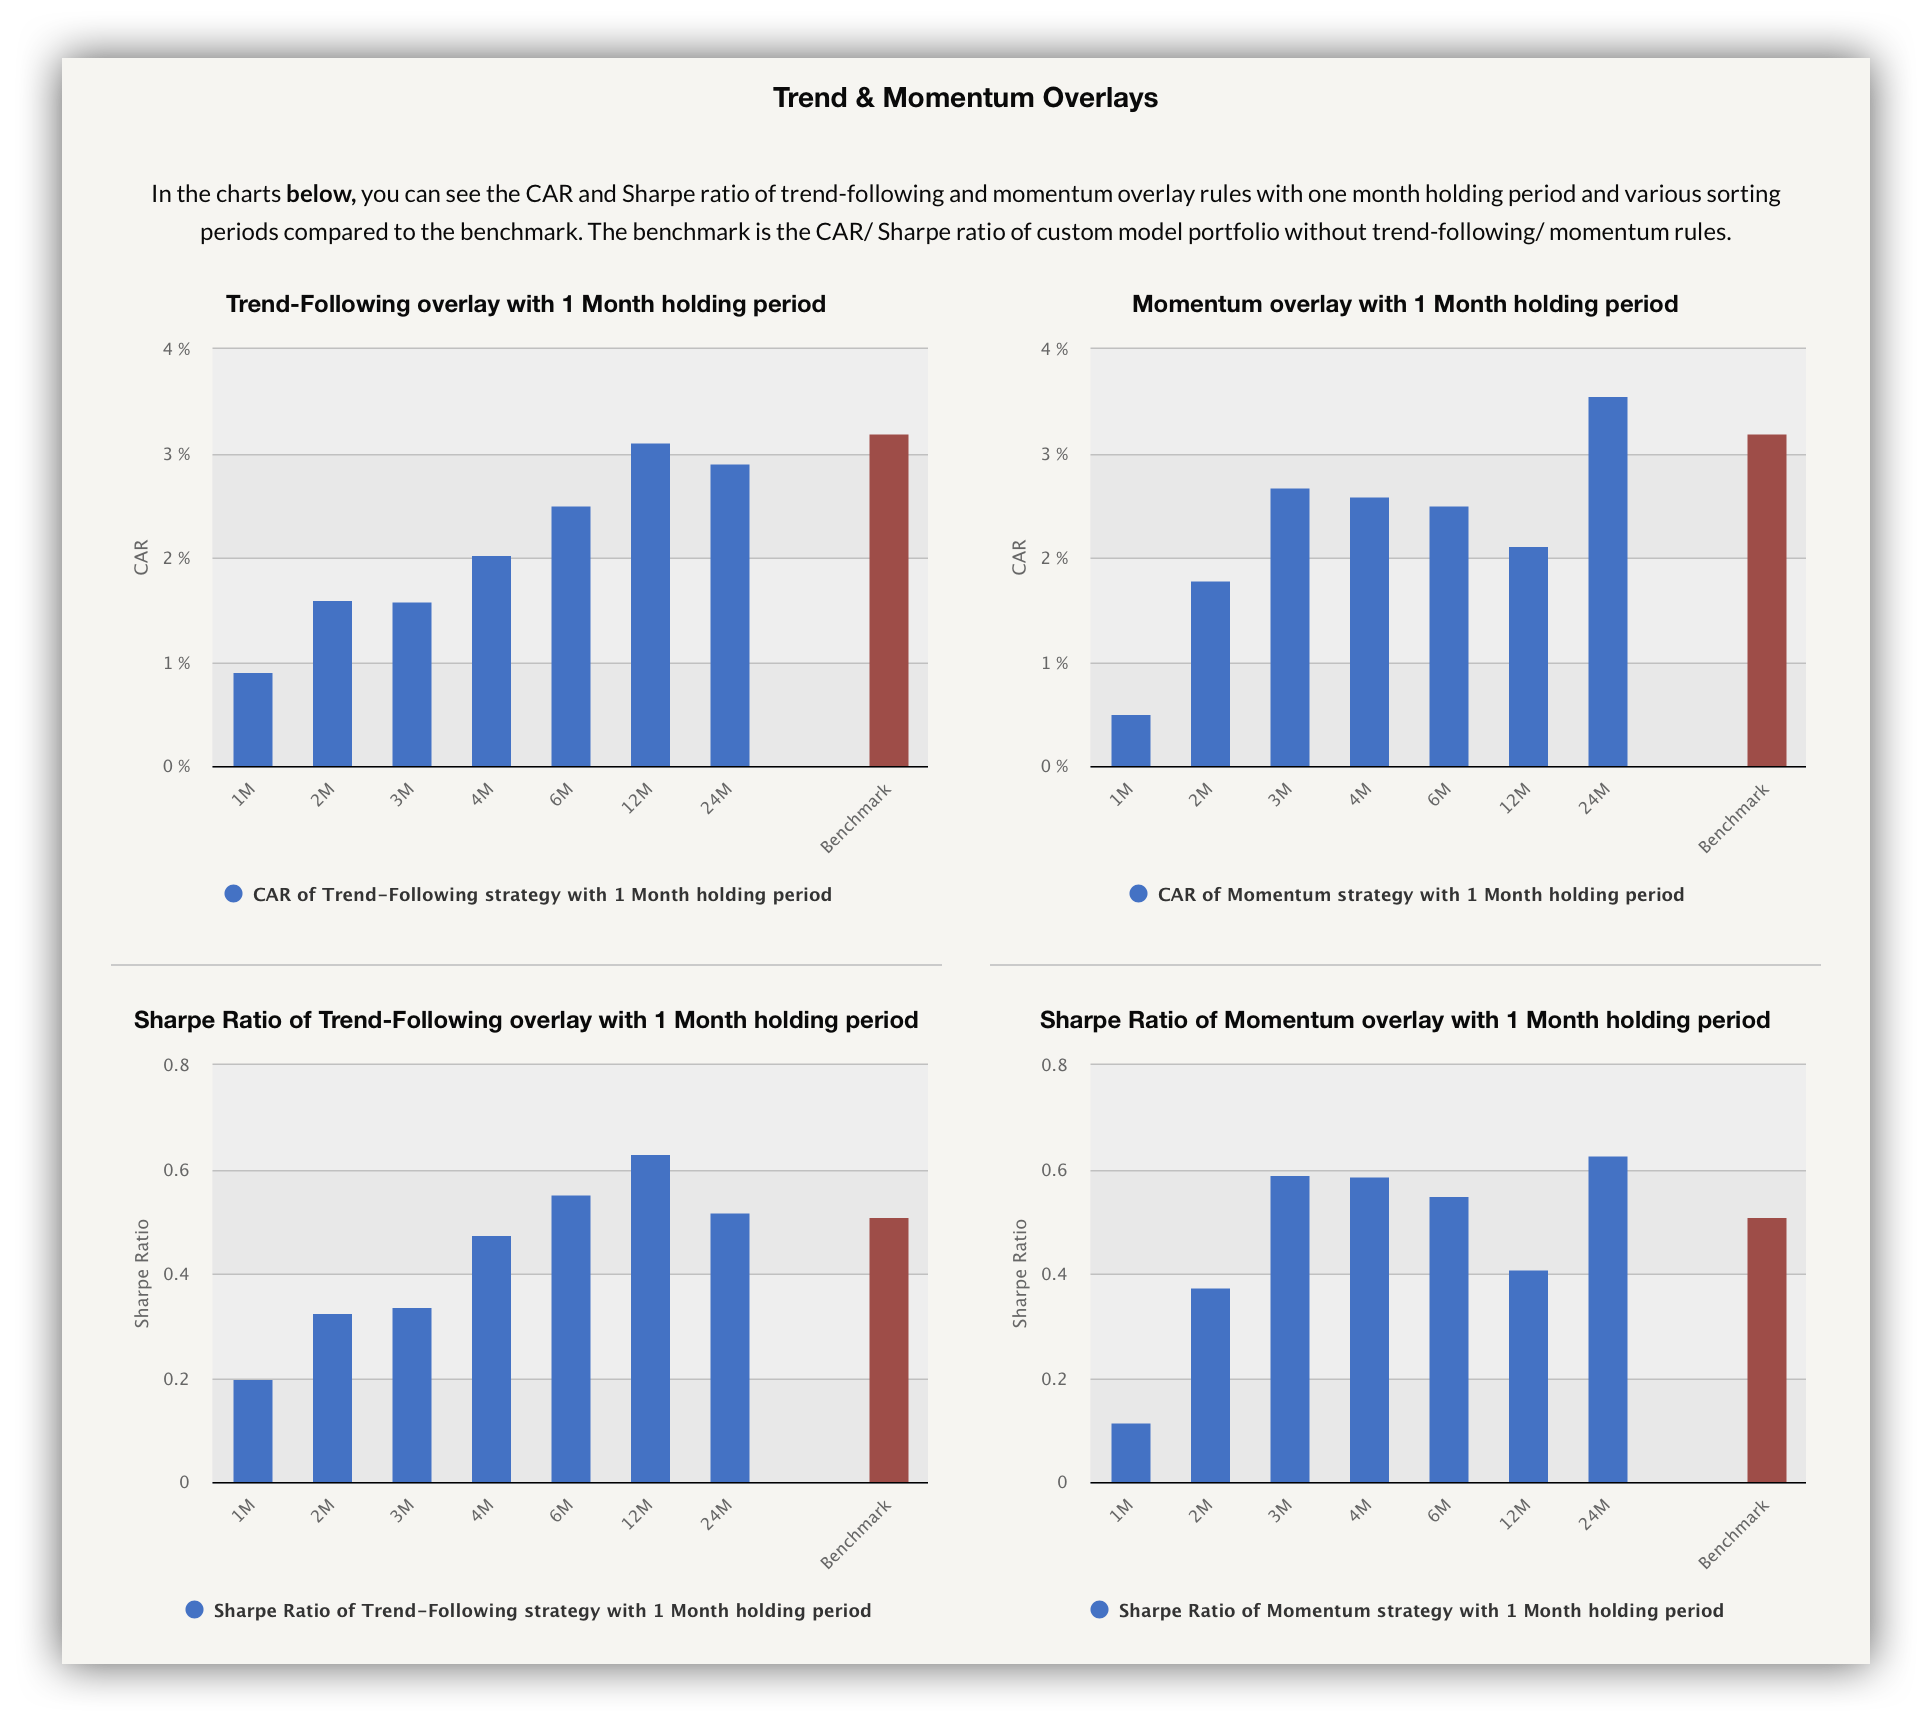
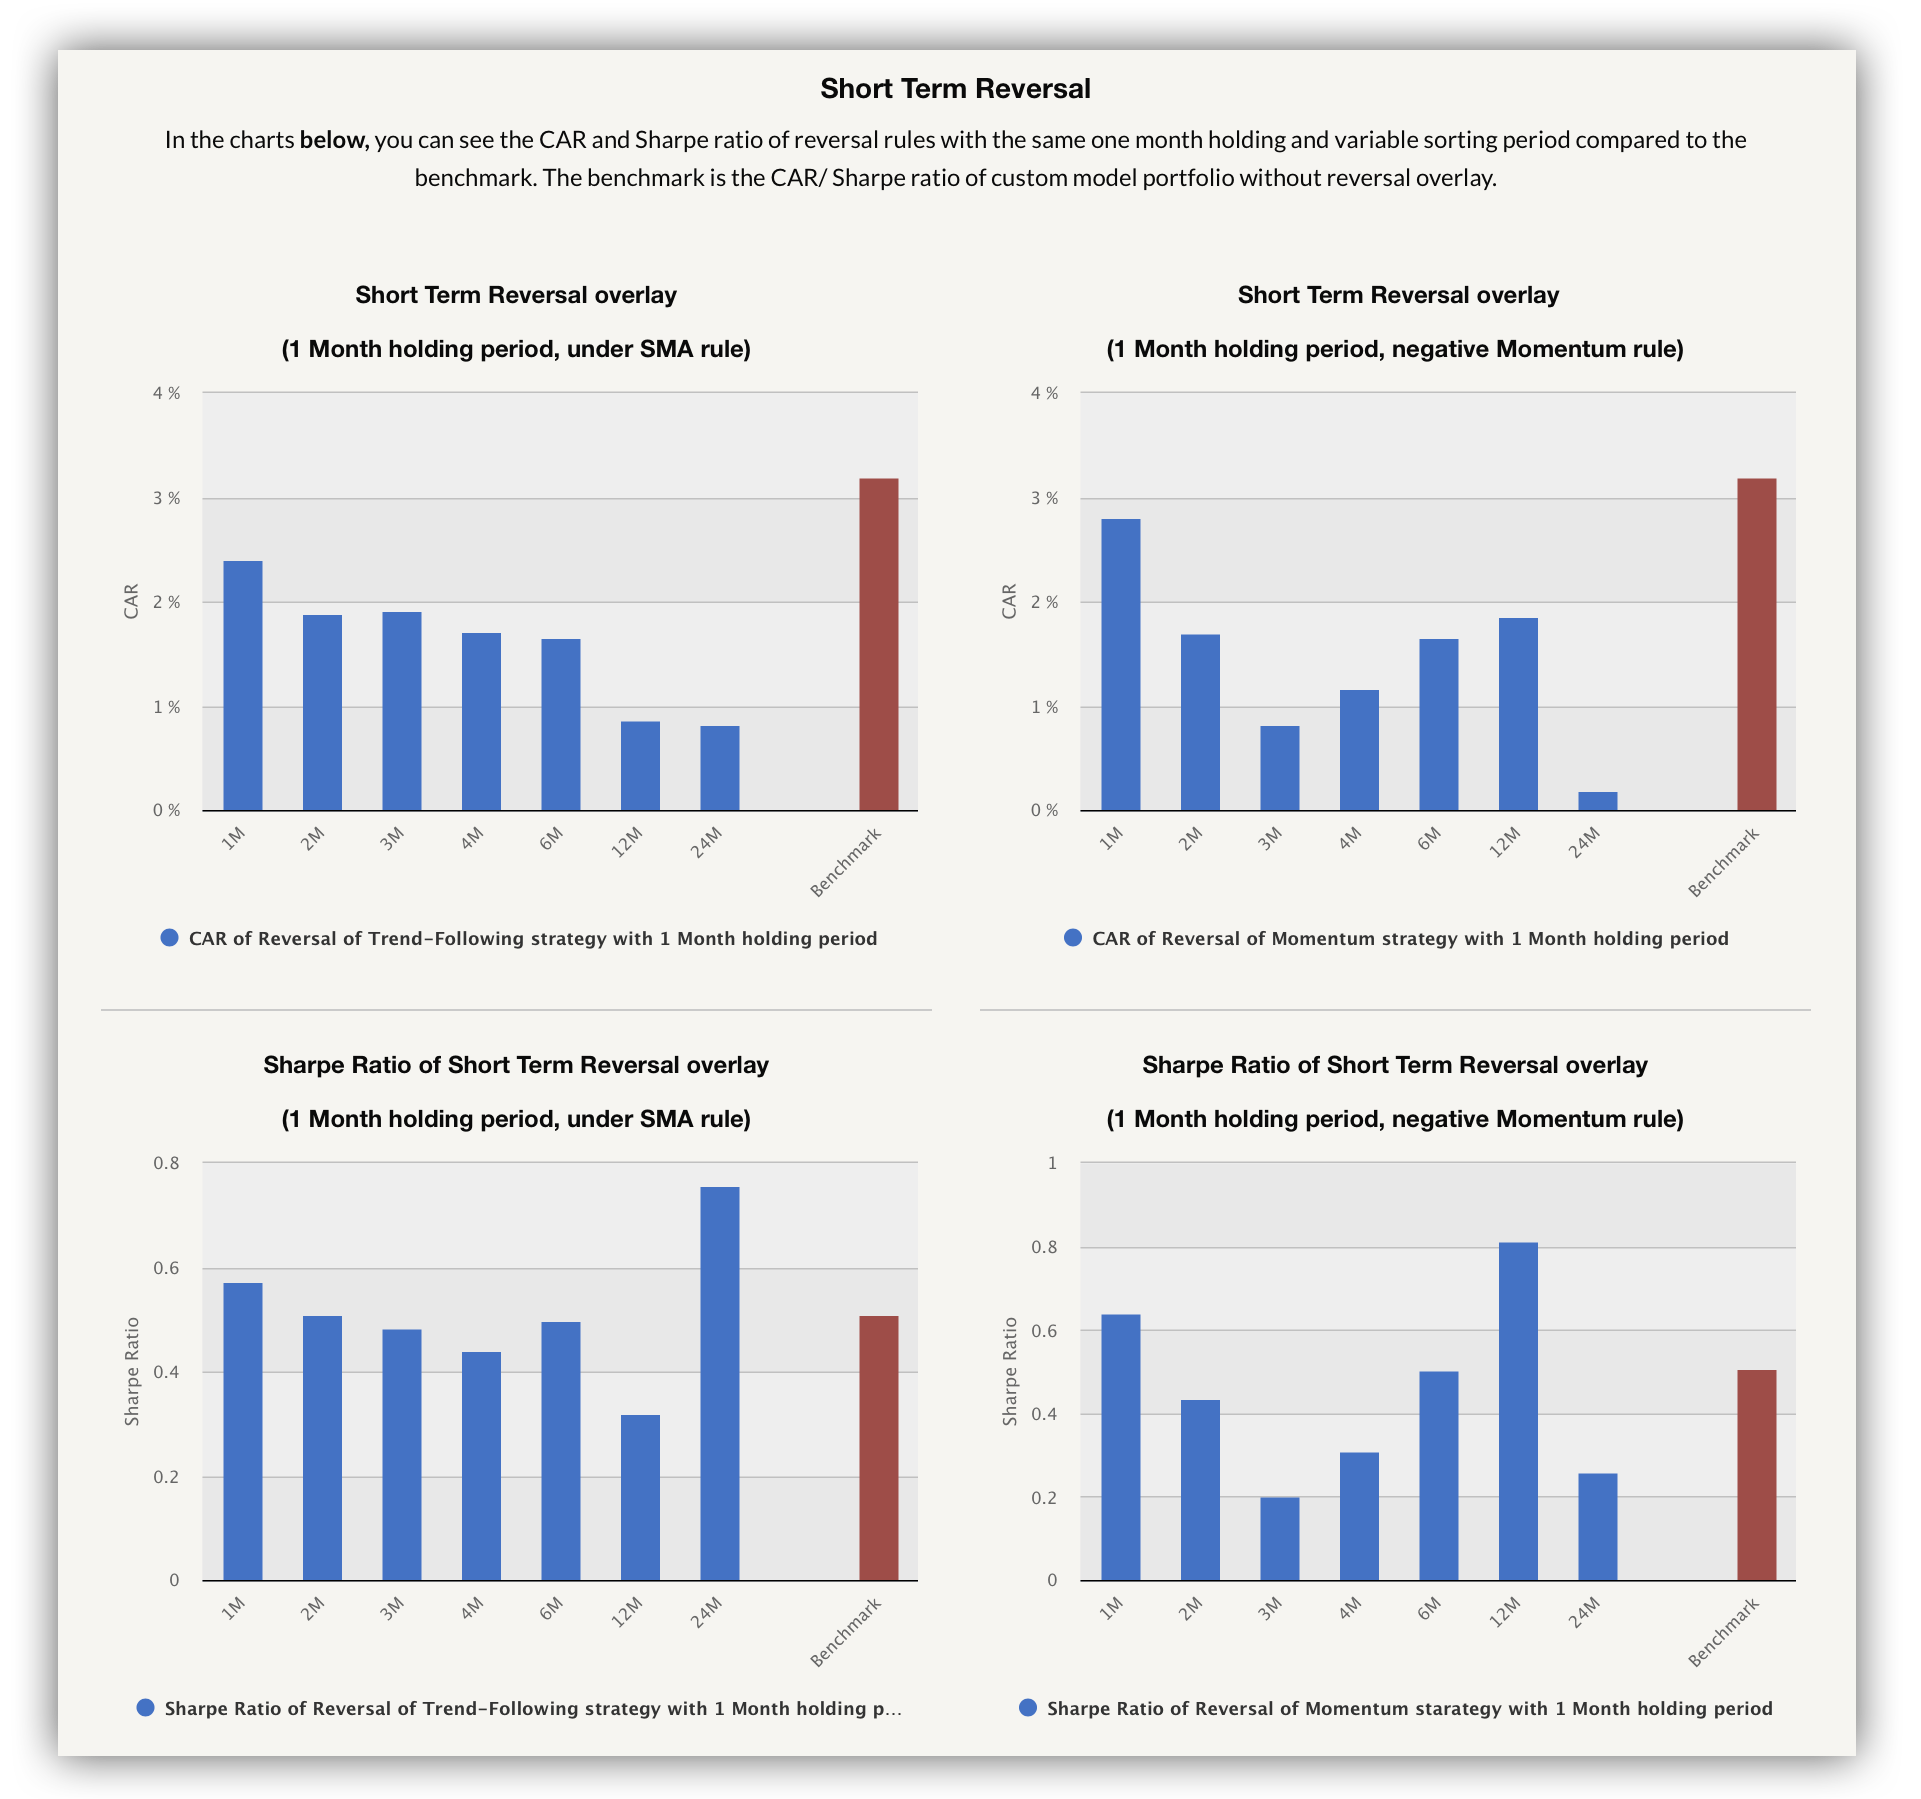
Cross-Sectional Momentum Management – applies multiple trend-following and contrarian strategy overlays with signals based on the performance of the underlying strategies, ETFs, or uploaded user’s equity curves. In our Multi-Strategy Management for Your Portfolio, we even decided to apply two more approaches, such as the volatility adjustment and the Moving Averages of the underlying strategies.

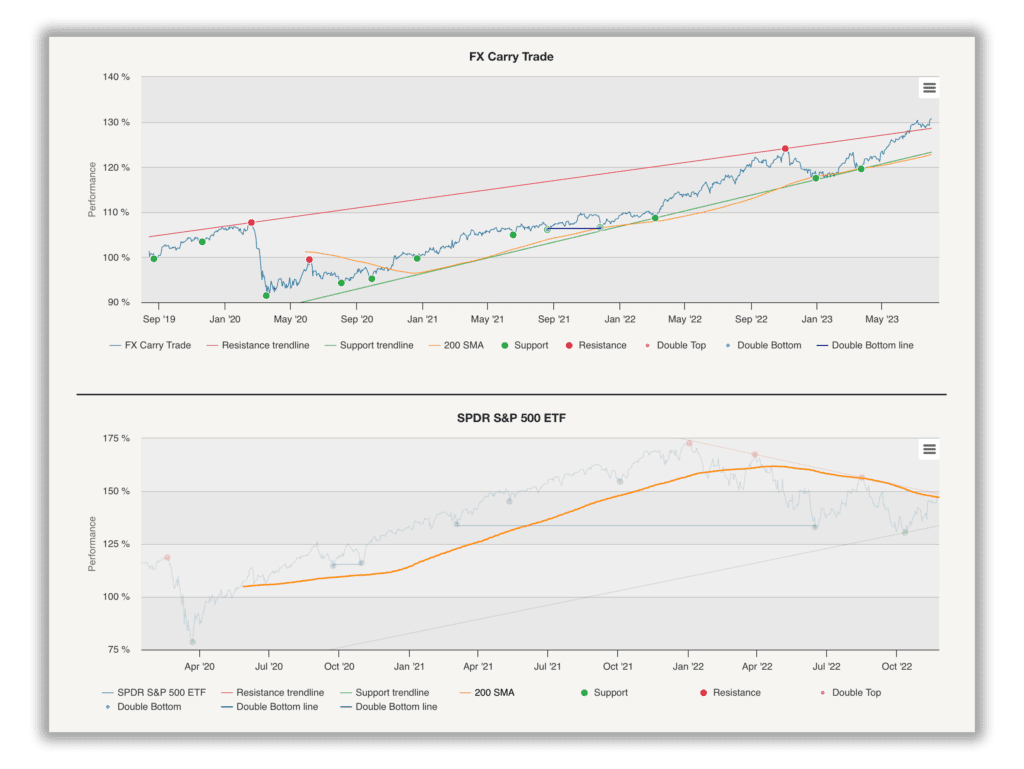
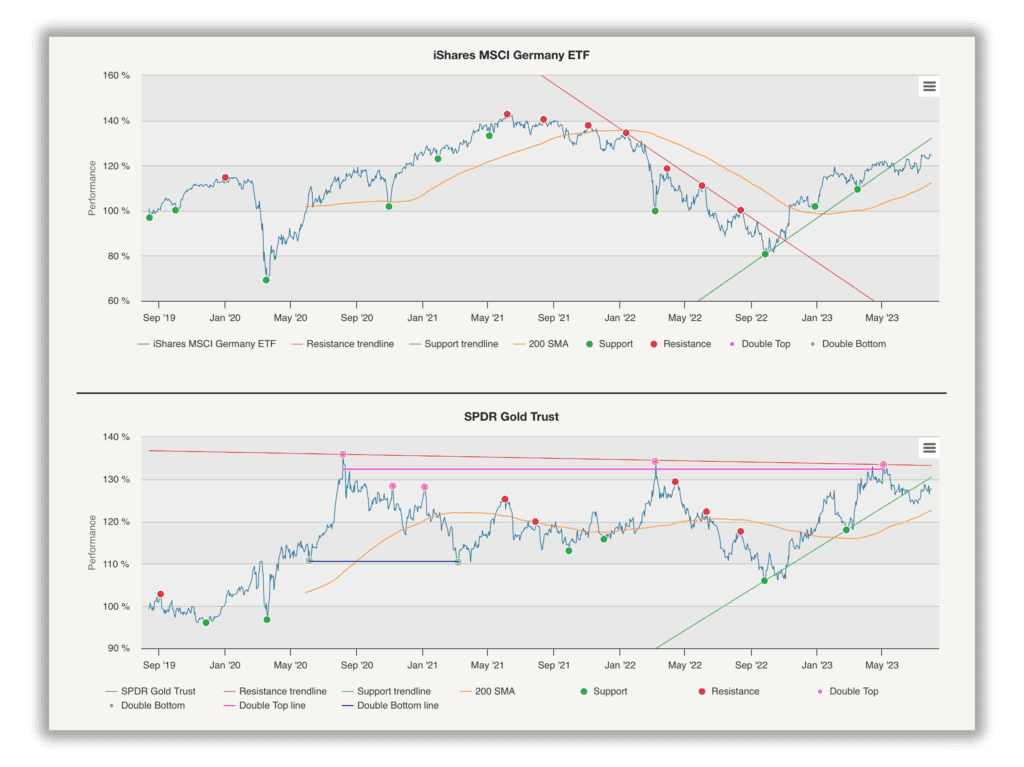
Technical Analysis report – identifies potential resistance and support levels for future price movements by analyzing historical price charts. Our focus is on utilizing close prices, which are particularly relevant for long-term investors and swing traders. Learn more about our methodology and its application in this report.