Asset class picking

Commodity Futures Risk Premium – Historical Analysis

17.October 2019

We at Quantpedia absolutely love long-term studies, and academic research paper written by Bhardwaj, Janardanan, and Rouwenhorst is really exceptional. There are a lot of studies covering a long history of equity and bond markets. But futures markets are not covered so well, and that’s the reason why is this paper so valuable. An additional plus is that study covers also delisted contracts, which makes the study’s data quality even better. Quantpedia’s recommended read to anyone interested in asset allocation into commodities …

Authors: Bhardwaj, Janardanan and Rouwenhorst

Title: The Commodity Futures Risk Premium: 1871–2018

Continue reading

What Affects the Correlation Between Stocks and Bonds

26.August 2019

The correlation between bonds and stocks is essential information for asset allocation decisions; therefore understanding its macro-economic drivers is very valuable for all investors. Stocks-bonds correlation isn’t stable, as we have experienced in the last 30 years, as the correlation, which was positive until the end of the 1990s, changed sign at the turn of the century. Research paper written by Marcello Pericoli sheds more light on this issue and shows that the correlation is primarily influenced by the uncertainty about inflation and real interest rates as well as by co-movement between inflation, real interest rates and dividend growth.

Author: Pericoli

Title: Macroeconomics Determinants of the Correlation Between Stocks and Bonds

Continue reading

Can We Explain Abudance of Equity Factors Just by Data Mining? Surely Not.

11.April 2019

Academic research has documented several hundreds of factors that explain expected stock returns. Now, question is: Are all this factors product of data mining? Recent paper by Andrew Chen runs a numerical simulation that shows that it is implausible, that abudance of equity factors can be explained solely by p-hacking …

Author: Chen

Title: The Limits of P-Hacking: A Thought Experiment

Link: https://papers.ssrn.com/sol3/papers.cfm?abstract_id=3358905

Abstract:

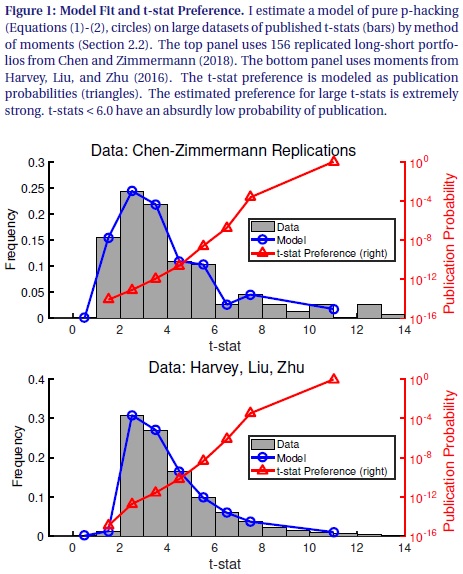
Suppose that asset pricing factors are just p-hacked noise. How much p-hacking is required to produce the 300 factors documented by academics? I show that, if 10,000 academics generate 1 factor every minute, it takes 15 million years of p-hacking. This absurd conclusion comes from applying the p-hacking theory to published data. To fit the fat right tail of published t-stats, the p-hacking theory requires that the probability of publishing t-stats < 6.0 is infinitesimal. Thus it takes a ridiculous amount of p-hacking to publish a single t-stat. These results show that p-hacking alone cannot explain the factor zoo.

Notable quotations from the academic research paper:

"Academics have documented more than 300 factors that explain expected stock returns. This enormous set of factors begs for an economic explanation, yet there is little consensus on their origin. A p-hacking (a.k.a. data snooping, data-mining) offers a neat and plausible solution. This cynical explanation begins by noting that the cross-sectional literature uses statistical tests that are only valid under the assumptions of classical single hypothesis testing. These assumptions are clearly violated in practice, as each published factor is drawn from multiple unpublished tests. In this well-known explanation, the factor zoo consists of factors that performed well by pure chance.

In this short paper, I follow the p-hacking explanation to its logical conclusion. To rigorously pursue the p-hacking theory, I write down a statistical model in which factors have no explanatory power, but published t-stats are large because the probability of publishing a t-stat ti follows an increasing function p(ti). I estimate p(ti ) by fitting the model to the distribution of published t-stats inHarvey, Liu, and Zhu (2016) and Chen and Zimmermann (2018). The p-hacking story is powerful: The model fits either dataset very well.

p-hacking model

Though p-hacking fits the data, following its logic further leads to absurd conclusions. In particular, the pure p-hacking model predicts that the ratio of unpublished factors to published factors is ridiculously large, at about 100 trillion to 1. To put this number in perspective, suppose that 10,000 economists mine the data for 8 hours per day, 365 days per year. And suppose that each economist finds 1 predictor every minute. Even with this intense p-hacking, it would take 15 million years to find the 316 factors in theHarvey, Liu, and Zhu (2016) dataset.

This thought experiment demonstrates that assigning the entire factor zoo to p-hacking is wrong. Though the p-hacking story appears logical, following its logic rigorously leads to implausible conclusions, disproving the theory by contradiction. Thus, my thought experiment supports the idea that publication bias in the cross-section of stock returns is relatively minor."


Are you looking for more strategies to read about? Check http://quantpedia.com/Screener

Do you want to see performance of trading systems we described? Check http://quantpedia.com/Chart/Performance

Do you want to know more about us? Check http://quantpedia.com/Home/About


Follow us on:

Facebook: https://www.facebook.com/quantpedia/

Twitter: https://twitter.com/quantpedia


Continue reading

Better Rebalancing Strategy for Static Asset Allocation Strategies

13.March 2019

An interesting financial academic paper which analyzes an alternative approach to rebalancing of static asset allocation strategies:

Authors: Granger, Harvey, Rattray, Van Hemert

Title: Strategic Rebalancing

Link: https://papers.ssrn.com/sol3/papers.cfm?abstract_id=3330134

Abstract:

A mechanical rebalancing strategy, such as a monthly or quarterly reallocation towards fixed portfolio weights, is an active strategy. Winning asset classes are sold and losers are bought. During crises, when markets are often trending, this can lead to substantially larger drawdowns than a buy-and-hold strategy. Our paper shows that the negative convexity induced by rebalancing can be substantially mitigated, taking the popular 60-40 stock-bond portfolio as our use case. One alternative is an allocation to a trend-following strategy. The positive convexity of this overlay tends to counter the impact on drawdowns of the mechanical rebalancing strategy. The second alternative we call strategic rebalancing, which uses smart rebalancing timing based on trend-following signals – without a direct allocation to a trend-following strategy. For example, if the trend-following model suggests that stock markets are in a negative trend, rebalancing is delayed.

Notable quotations from the academic research paper:

"A pure buy-and-hold portfolio has the drawback that the asset mix tends to drift over time and, as such, is untenable for investors who seek diversification. However, a stock-bond portfolio that regularly rebalances tends to underperform a buy-and-hold portfolio at times of continued outperformance of one of the assets. Using a simple two-period model, we explain the main intuition behind this effect: rebalancing means selling (relative) winners, and if winners continue to outperform, that detracts from performance.

As stocks typically have more volatile returns than bonds, relative returns tend to be driven by stocks. Hence, of particular interest are episodes with continued negative (absolute and relative) stock performance, such as the 2007-2009 global financial crisis. In Figure 2, we contrast the monthly-rebalanced and buy-and-hold cumulative performance over the financial crisis period, where both start with an initial 60-40 stock-bond capital allocation. The maximum drawdown of the monthly-rebalanced portfolio is 1.2 times (or 5 percentage points) worse than that of the buy-and-hold portfolio, right at the time when financial markets turmoil is greatest.
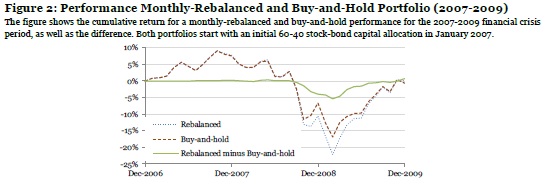
Rebalanced and not rebalanced portfolio

In earlier work, Granger et al. (2014) formally show that rebalancing is similar to starting with a buy-and-hold portfolio and adding a short straddle (selling both a call and a put option) on the relative value of the portfolio assets. The option-like payoff to rebalancing induces negative convexity by magnifying drawdowns when there are pronounced divergences in asset returns. We show that time-series momentum (or trend) strategies, applied to futures on the same stock and bond markets, are natural complements to a rebalanced portfolio. This is because the trend payoff tends to mimic that of a long straddle option position, or exhibits positive convexity.
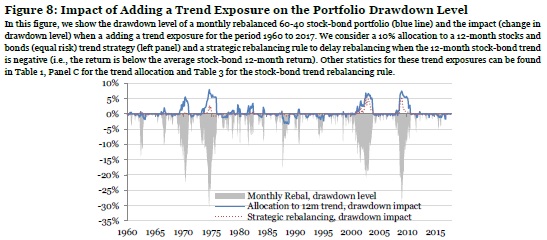
Trend exposure and portfolio drawdown

We evaluate how 1-, 3-, and 12-month trend strategies perform during the five worst drawdowns for the 60-40 stock-bond portfolio. Allocating 10% to a trend strategy and 90% to a 60-40 monthly-rebalanced portfolio improves the average drawdown by about 5 percentage points, compared to a 100% allocation to a 60-40 monthly rebalanced portfolio. The trend allocation has no adverse impact on the average return over our sample period. That is, while one would normally expect a drag on the overall (long-term) performance when allocating to a defensive strategy, in our sample, the trend-following premium earned offsets the cost (or insurance premium) paid.

An alternative to a trend allocation is strategically timing and sizing rebalancing trades, which we label strategic rebalancing. We first consider a range of popular heuristic rules, varying the rebalancing frequency, using thresholds, and trading only partially back to the 60-40 asset mix. Such heuristic rules reduce the average maximum drawdown level for the five crises considered by up to 1 percentage point. However, using strategic rebalancing rules based on either the past stock or past stock-bond relative returns gives improvements of 2 to 3 percentage points."


Are you looking for more strategies to read about? Check http://quantpedia.com/Screener

Do you want to see performance of trading systems we described? Check http://quantpedia.com/Chart/Performance

Do you want to know more about us? Check http://quantpedia.com/Home/About


Follow us on:

Facebook: https://www.facebook.com/quantpedia/

Twitter: https://twitter.com/quantpedia


Continue reading

Subscribe for Newsletter

Be first to know, when we publish new content


    logo
    The Encyclopedia of Quantitative Trading Strategies

    Log in