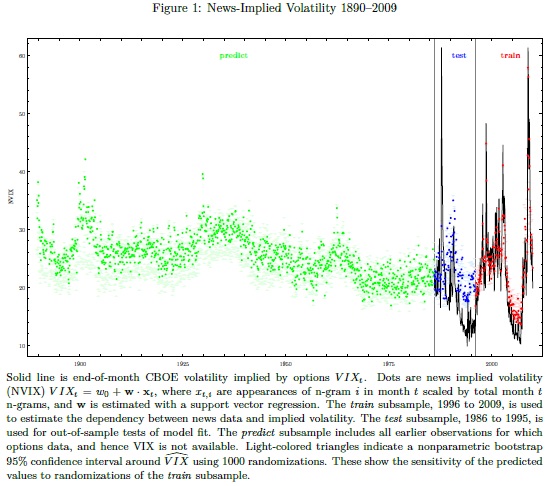
We present an interesting academic paper with a methodology that allows estimating VIX (volatility risk) since the year 1890 …
Authors: Manela, Moreira
Title: News Implied Volatility and Disaster Concerns
Link: https://papers.ssrn.com/sol3/papers.cfm?abstract_id=2382197
Abstract:
We construct a text-based measure of uncertainty starting in 1890 using front-page articles of the Wall Street Journal. News implied volatility (NVIX) peaks during stock market crashes, times of policy-related uncertainty, world wars and financial crises. In US post-war data, periods when NVIX is high are followed by periods of above average stock returns, even after controlling for contemporaneous and forward-looking measures of stock market volatility. News coverage related to wars and government policy explains most of the time variation in risk premia our measure identifies. Over the longer 1890-2009 sample that includes the Great Depression and two world wars, high NVIX predicts high future returns in normal times, and rises just before transitions into economic disasters. The evidence is consistent with recent theories emphasizing time variation in rare disaster risk as a source of aggregate asset prices fluctuations.
Notable quotations from the academic research paper:
"This paper aims to quantify this “spirit of the times”, which after the dust settles is forgotten, and only hard data remains to describe the period. Specifically, our goal is to measure people’s perception of uncertainty about the future, and to use this measurement to investigate what types of uncertainty drive aggregate stock market risk premia.
We start from the idea that time-variation in the topics covered by the business press is a good proxy for the evolution of investors’ concerns regarding these topics.
We estimate a news-based measure of uncertainty based on the co-movement between the front-page coverage of the Wall Street Journal and options-implied volatility (VIX). We call this measure News Implied Volatility, or NVIX for short. NVIX has two useful features that allow us to further our understanding of the relationship between uncertainty and expected returns:
(i) it has a long time-series, extending back to the last decade of the nineteen century, covering periods of large economic turmoil, wars, government policy changes, and crises of various sorts;
(ii) its variation is interpretable and provides insight into the origins of risk variation.
The first feature enables us to study how compensation for risks reflected in newspaper coverage has fluctuated over time, and the second feature allows us to identify which kinds of risk were important to investors.
We rely on machine learning techniques to uncover information from this rich and unique text dataset. Specifically, we estimate the relationship between option prices and the frequency of words using Support Vector Regression. The key advantage of this method over Ordinary Least Squares is its ability to deal with a large feature space. We find that NVIX predicts VIX well out-of-sample, with a root mean squared error of 7.48 percentage points (R2 = 0.19). When we replicate our methodology with realized volatility instead of VIX, we find that it works well even as we go decades back in time, suggesting newspaper word-choice is fairly stable over this period.

We study whether fluctuations in NVIX encode information about equity risk premia. We begin by focusing on the post-war period commonly studied in the literature for which high-quality stock market data is available. We find strong evidence that times of greater investor uncertainty are followed by times of above average stock market returns. A one standard deviation increase in NVIX predicts annualized excess returns higher by 3.3 percentage points over the next year and 2.9 percentage points annually over the next two years.
Interpretability, a key feature of the text-based approach, enables us to investigate what type of news drive the ability of NVIX to predict returns. We decompose the text into five categories plausibly related (to a varying degree) to disaster concerns: war, financial intermediation, government policy, stock markets, and natural disasters. We find that a large part of the variation in risk premia is related to wars (53%) and government policy (27%). A substantial part of the time-series variation in risk premia NVIX identifies is driven by concerns tightly related to the type of events discussed in the rare disasters literature."
Are you looking for more strategies to read about? Check http://quantpedia.com/Screener
Do you want to see a performance of trading systems we described? Check http://quantpedia.com/Chart/Performance
Do you want to know more about us? Check http://quantpedia.com/Home/About
Follow us on:
Facebook: https://www.facebook.com/quantpedia/
Twitter: https://twitter.com/quantpedia


