Equity long short

Three New Insights from Academic Research Related to Equity Momentum Strategy

4.August 2019

What are the main insights?

– The momentum spread (the difference of the formation-period recent 6-month returns between winners and losers) negatively predicts future momentum profit in the long-term (but not in the following month), the negative predictability is mainly driven by the old momentum spread (old momentum stocks are based on whether a stock has been identified as a momentum stock for more than three months)

– The momentum profits based on total stock returns can be decomposed into three components: a long-term average alpha component that reverses, a stock beta component that accounts for the dynamic market exposure (and momentum crash risk), and a residual return component that drives the momentum effect (and subsumes total-return momentum)

– The profitability and the optimal combination of ranking and holding periods of momentum strategies for a sample of Core and Peripheral European equity markets the profitability vary across markets

Continue reading

Two Versions of CAPM

19.July 2019

This week's analysis of selected financial research paper contains more text and no picture, but we still think it's worth reading …

Authors: Siddiqi

Title: CAPM: A Tale of Two Versions

Link: https://papers.ssrn.com/sol3/papers.cfm?abstract_id=3350280

Abstract:

Given that categorization is the core of cognition, we argue that investors do not view firms in isolation. Rather, they view them within a framework of categories that represent prior knowledge. This involves sorting a given firm into a category and using categorization-induced inferences to form earnings and discount-rate expectations. If earnings-aspect is categorization-relevant, then earnings estimates are refined, whereas discount-rates are confounded with the category-exemplar. The opposite happens when discount-rates are categorization relevant. Earnings-focused approach such as DCF, generally used by institutional investors, leads to a version of CAPM in which the relationship between average excess return and stock beta is flat (possibly negative). Value effect and size premium (controlling for quality) arise in this version. Discount-rate focused approach such as multiples or comparables valuation, typically used by individual investors, leads to a second version in which the relationship is strongly positive with growth stocks doing better. The two-version CAPM accounts for several recent empirical findings including fundamentally different intraday vs overnight behavior, as well as behavior on macroeconomic announcement days. Momentum is expected to be an overnight phenomenon, which is consistent with empirical findings. We argue that, perhaps, our best shot at observing classical CAPM in its full glory is a laboratory experiment with subjects who have difficulty categorizing (such as in autism spectrum disorders).

Notable quotations from the academic research paper:

"Consider the following two empirical observations:

Firstly, stock prices behave very differently with respect to their sensitivity to market risk (beta) at specific times. Typically, average excess return and beta relationship is flatter than expected. It could even be negative. However, during specific times, this relationship is strongly positive, such as on days when macroeconomic announcements are made or during the night.

Secondly, a hue, which is halfway between yellow and orange, is seen as yellow on a banana and orange on a carrot. In this article, we argue that the two observations are driven by the same underlying mechanism.

The second observation is an example of the implications of categorization for color calibration. In this article, we argue that the first observation is also due to categorization, which gives rise to two versions of CAPM. In one version, the relationship between expected return and stock beta is flatter than expected or could even be negative, whereas in the second version, this relationship is strongly positive.

Categorization is the mental operation by which brain classifies objects and events. We do not experience the world as a series of unique events. Rather, we make sense of our experiences within a framework of categories that represent prior knowledge. That is, new information is only understood in the context of prior knowledge.

Here, in accord with cognitive science literature, we present a view of categorization that has both an upside as well as a downside, and apply this nuanced perspective to the capital asset pricing model (CAPM). If categorization is fundamental to how our brains make sense of information, then investor behavior, like any other domain of human behaviour, should also be viewed through this lens. This means that the traditional view that each firm is viewed in isolation needs to be altered. When an investor considers a firm, she views it within a framework of categories that represent prior knowledge. This involves sorting a given firm into a category based on attributes that are deemed categorization-relevant. Categorization-induced inferences help refine such attributes while confounding categorization-irrelevant attributes with the category-exemplar.

Valuation requires estimating earnings (cash-flows) potential and estimating discount-rates. Even among firms that sell similar products (same sector) some may have more similar earnings potential, whereas other may have more similar discount-rates. The former type may include firms with similar earnings-related fundamentals but very different levels of debt ratio and equity betas. Also, their multiples (generally related to inverse of the discount-rate) such as P/E, EV/Sales or EV/EBITDA could be very different. The latter type may include firms with similar debt ratios and equity betas or similar P/E and EV/EBITDA but quite different earnings or cash-flows fundamentals.

We argue that, an earnings-focused approach, such as discounted cash-flows (DCF), tends to categorize the former type of firms together, whereas, the relative valuation approach (RV) based on multiples such as P/E or EV/EBITDA tends to categorize the latter types of firms together. In other words, the choice of a valuation approach introduces a bias in how firms are categorized.

In this paper, we take discounted cash-flows (DCF) as the prototype of an earnings-potential focused approach, and valuation by multiples or relative valuation (RV) as the prototype discount-rate focused approach.

We show that when earnings aspect is categorization-relevant (as in DCF analysis), a version of CAPM is obtained, which displays a flatter or even negative relationship between stock beta and expected excess returns. Betting-against-beta anomaly is observed along with the value effect, as well as the size premium after controlling for quality (consistent with the findings in Asness et al 2018). We argue that this is the default version which typically prevails. While categorizing firms, if investors are focused on the discount rate aspect (as in RV analysis), then the discount-rates are refined whereas earnings estimates are confounded with the category-exemplar. A second version of CAPM arises. In this version, there is a strong positive relationship between beta and expected excess return.

One way to make sense of the co-existence of two versions is to classify investors as either earnings-focused or discount rate-focused. If earnings-focused investors dominate, then the first version is observed. If the discount-rate-focused investors dominate, then the second version is observed. Note, that earnings-focused approach (such as DCF) is typically employed by large institutional investors, whereas RV approach is associated with individual investors (and with sell-side equity analysts who publish research reports for individual investors).

If institutional investors are earnings-focused and individual investors are discount rate-focused, then the trading behavior of each type can be observed to make specific predictions:

1) Institutional investors typically avoid trading at the open and prefer to trade in the afternoon near the market close. The objective is to time the trade when the market is most liquid to avoid any adverse price impact. This means that trade at open is dominated by individual investors. So, one expects to see the relationship between stock beta and average return to be strongly positive (second version) overnight and flat or even negative (first version) intraday.

2) Institutional traders typically trade in the right direction prior to macroeconomic announcement days (suggesting superior information) with institutional trading volume falling sharply on macro-announcement days. As trade on such days is dominated by individual investors, one expects to see a strongly positive relationship (second version) on macro-announcement days.

3) The first version generally dominates intraday due to institutional investors being dominant. As the corresponding CAPM version comes with size and value effects, the prediction is that size and value are primarily intraday phenomena.

4) We show that, all else equal, discount rate-focused investors have higher willingness-to-pay than earnings-focused investors. If discount rate-focused investors dominate trade at open, whereas earnings-focused investors are active intraday, then one expects prices to typically rise overnight from close-to-open and fall intraday between open-to-close.

5) If momentum traders, who buy past winners and short past losers, are primarily individual investors, then one expects momentum to be an overnight phenomenon observed between close-to-open. This is because individual traders dominate trade at or near open.

"


Are you looking for more strategies to read about? Check http://quantpedia.com/Screener

Do you want to see performance of trading systems we described? Check http://quantpedia.com/Chart/Performance

Do you want to know more about us? Check http://quantpedia.com/Home/About


Follow us on:

Facebook: https://www.facebook.com/quantpedia/

Twitter: https://twitter.com/quantpedia

Youtube: https://www.youtube.com/channel/UC_YubnldxzNjLkIkEoL-FXg


Continue reading

50 Years in PEAD (Post Earnings Announcement Drift) Research

5.July 2019

A new research paper related to:

#33 – Post-Earnings Announcement Effect

Authors: Sojka

Title: 50 Years in PEAD Research

Link: https://papers.ssrn.com/sol3/papers.cfm?abstract_id=3281679

Abstract:

Analysing earning’s predictive power on stock returns was in the heart of academic research since late 60’s. First introduced to academic world in 1967 during seminar “Analysis of Security Prices” by Chicago University Professors Ray Ball and Philip Brown. In the next four decades was extensively analysed by many academics and is now a well-documented anomaly and is referred to as Post Earnings Announcement Drift (PEAD). This phenomenon is still at the centre of academic research because it stands at odds with efficient market hypothesis which assumes that all information is instantaneously reflected in stock prices. Professional investors are also closely looking at PEAD as it implies that it is easy to beat the market average by simply ranking stocks based on their earnings surprise and investing in the top decile, quintile or quartile and shorting the bottom part. Academic evidence shows that this strategy produces an abnormal return of somewhere between 2.6% and 9.37% per quarter, according to various authors. In this paper I will present existing evidence supporting and contradicting “PEAD”, the history of academic research in that field and various techniques used to verify the phenomenon. The paper is organised as follows: first the history of the PEAD academic research is presented, in the second more recent evidence and research techniques used by authors are presented and finally conclusions and various critics of PEAD are shown.

Notable quotations from the academic research paper:

"Post Earnings Announcement Drift is a measure of markets inability to price correctly information contained in earnings report. Since it was first spotted by Ball and Brown (1968), it went through rigorous academic scrutiny, first to test if it really exists (Ball (1978), Latane and Jones (1977)), then to measure its magnitude in various time frames, to offer explanations for its existence and find more PEAD variations. On average academics found that the postponed response to earnings information produces about 6% abnormal 60 days return (Dechow et al (2013)). The whole market reaction attributed to earnings report, measured from 60 days prior to earnings release to 60 days after is estimated at 18%, which means that about a third of the whole market response is delayed – Dechow et al (2013).

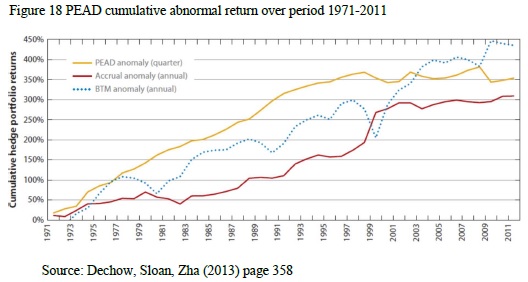
Figure 18 presents cumulative PEAD strategy abnormal returns for a 40-years period from 1971 to 2011. The total abnormal return of the strategy is an astonishing 350%, which is beat only by BTM (Book-to-Market) strategy. PEAD profits are very consistent up to late 90’s, then we can observe dips in the abnormal returns during internet bubble (1991-2001) and then during market recovery after 2008 crash. Since the middle of the 90’s PEAD returns became riskier and much lower than in the previous 25 years, it may be attributed to wider academic research in the field and wider recognition of the phenomenon among investors.

PEAD strategy chart

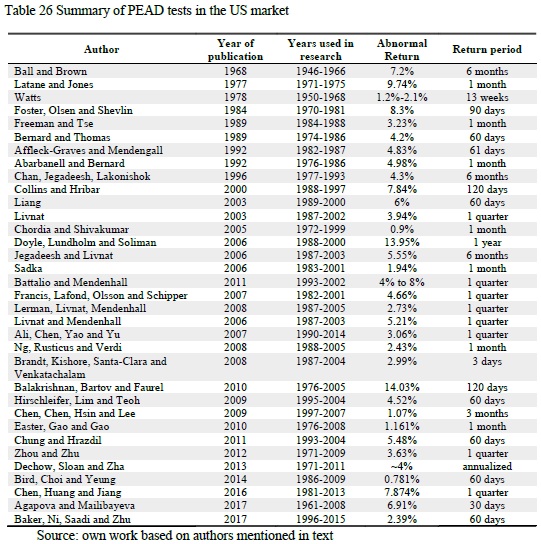
The PEAD strategy is not easy to implement in practice as it requires large scale data collection and data processing, more recent advancements in information processing technologies may also affect the magnitude of PEAD exploitation. A dominant part of research on PEAD was conducted in the US and based on US stock market data. The magnitude of PEAD computed by academics across time, since 1968 when first academic paper mentioning PEAD was published, up to the most recent evidence, are shown in Table 26.

Summary of PEAD tests

PEAD premium computed based on US market data by academics is not easily comparable. There are differences in period studied, subset of stocks used, definitions of expected earnings or unexpected earnings signal altogether. Among the results presented in Table 26, the highest return 14.03% in 120 days presented by Balakrishnan et al (2009) and the lowest is Chordia and Shivakumar (2005) 0.9% in 1 month. Both of those research papers confirm PEAD premium existence, but Chordia and Shivakumar (2005) focus their attention on explaining joint anomalies of momentum and PEAD, and form portfolios each month regardless of profit announcement date, taking last announced earnings in their SUE ranking, which obviously weakens the earnings signal."


Are you looking for more strategies to read about? Check http://quantpedia.com/Screener

Do you want to see performance of trading systems we described? Check http://quantpedia.com/Chart/Performance

Do you want to know more about us? Check http://quantpedia.com/Home/About


Follow us on:

Facebook: https://www.facebook.com/quantpedia/

Twitter: https://twitter.com/quantpedia

Youtube: https://www.youtube.com/channel/UC_YubnldxzNjLkIkEoL-FXg


Continue reading

The Best of Strategies for the Times of Crisis

26.June 2019

We at Quantpedia are not the only ones who are interested in finding strategies that can be used to mitigate the impacts of the large equity corrections. We have already written a short article about a lottery/skewness strategy in commodities, which offers some protection in a time of crisis. Our users can also screen a list of strategies that can be used as a hedge/diversification for equity markets during downturns. A new research paper written by Harvey, Hoyle, Rattray, Sargaison, Taylor and Van Hemert explores the same question and analyzes the performance of different tools that investors could deploy during equity bear markets. We sincerely recommend it …

Authors: Harvey, Hoyle, Rattray, Sargaison, Taylor, Van Hemert

Title: The Best of Strategies for the Worst of Times: Can Portfolios be Crisis Proofed?

Link: https://papers.ssrn.com/sol3/papers.cfm?abstract_id=3383173

Abstract:

In the late stages of long bull markets, a popular question arises: What steps can an investor take to mitigate the impact of the inevitable large equity correction? However, hedging equity portfolios is notoriously difficult and expensive. We analyze the performance of different tools that investors could deploy. For example, continuously holding short-dated S&P 500 put options is the most reliable defensive method but also the most costly strategy. Holding ‘safe-haven’ US Treasury bonds produces a positive carry, but may be an unreliable crisis-hedge strategy, as the post-2000 negative bond-equity correlation is a historical rarity. Long gold and long credit protection portfolios sit in between puts and bonds in terms of both cost and reliability. Dynamic strategies that performed well during past drawdowns include: futures time-series momentum (which benefits from extended equity sell-offs) and a quality strategy that takes long/short positions in the highest/lowest quality company stocks (which benefits from a ‘flight-to-quality’ effect during crises). We examine both large equity drawdowns and recessions. We also provide some out-of-sample evidence of the defensive performance of these strategies relative to an earlier, related paper.

Notable quotations from the academic research paper:

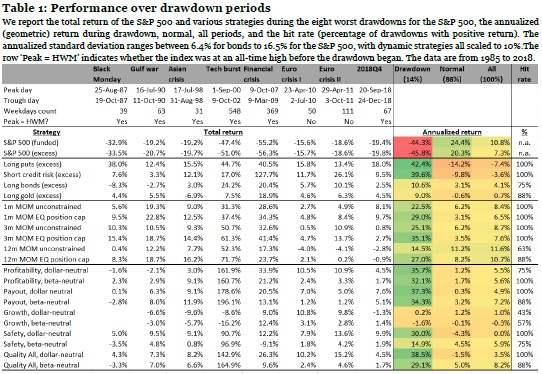
"The typical investment portfolio is highly concentrated in equities leaving investors vulnerable to large drawdowns. We examine the performance of a number of candidate defensive strategies, both active and passive, between 1985 and 2018, with a particular emphasis on the eight worst drawdowns (the instances where the S&P 500 fell by more than 15%) and three US recessions. To guard against overfitting, we provide out-of-sample evidence of the performance of these strategies in the 2018Q4 drawdown that occurred after we wrote an earlier, related paper.

We begin with two passive strategies, both of which benefit directly from a falling equity market. A strategy that buys, and then rolls, one-month S&P 500 put options performs well in each of the eight equity drawdown periods. However, it is very costly during the ‘normal’ times, which constitute 86% of our sample and expansionary (non-recession) times, which constitute 93% of our observations. As such, passive option protection seems too expensive to be a viable crisis hedge. A strategy that is long credit protection (short credit risk) also benefits during each of the eight equity drawdown periods, but in a more uneven manner, doing particularly well during the 2007-2009 Financial Crisis, which was a credit crisis. Nevertheless, the credit protection strategy is less costly during normal times and non-recessions than the put buying strategy.

Next, we consider so-called ‘safe-haven’ investments. A strategy that holds long positions in 10-year US Treasuries performed well in the post-2000 equity drawdowns, but was less effective during previous equity sell-offs. This is consistent with the negative bond-equity correlation witnessed post-2000, which is atypical from the longer historical perspective. As we move beyond the extreme monetary easing that has characterized the post-Financial Crisis period, it is possible that the bond-equity correlation may revert to the previous norm, rendering a long bond strategy a potentially unreliable crisis hedge. A long gold strategy generally performs better during crisis periods than at normal times, consistent with its reputation as a safe-haven security. However, its appeal as a crisis hedge is diminished by the fact that its long-run return, measured over the 1985-2018 period, is close to zero and that it carries substantial idiosyncratic risk unrelated to equity markets.

We then turn our attention to dynamic strategies.

Time-series momentum strategies add to winning positions (ride winners) and reduce losing positions (cut losers), much like a dynamic replication of an option straddle strategy. We show that such strategies performed well over the eight equity drawdowns and three recessions. We also explore limiting the equity exposure (no long positions allowed), which we find enhances the crisis performance.

Next, we consider long-short US equity strategies. A review of the factors proposed in the academic literature suggests that those that take long positions in high-quality and short positions in low-quality companies are most promising as crisis hedges, since they benefit from flights to quality when panic hits markets. The definition of a quality business is, of course, open to debate. However, broadly speaking, such companies will be profitable, growing, have safer balance sheets, and run investor-friendly policies in areas such as payout ratios. We examine a host of quality metrics, and illustrate the importance of a beta-neutral (common in practice) rather than a dollar-neutral (common in academic studies) portfolio construction.

performance of passive trading strategies

performance over drawdown period

"


Are you looking for more strategies to read about? Check http://quantpedia.com/Screener

Do you want to see performance of trading systems we described? Check http://quantpedia.com/Chart/Performance

Do you want to know more about us? Check http://quantpedia.com/Home/About


Follow us on:

Facebook: https://www.facebook.com/quantpedia/

Twitter: https://twitter.com/quantpedia

Youtube: https://www.youtube.com/channel/UC_YubnldxzNjLkIkEoL-FXg


Continue reading

Time-Series Momentum Works Everywhere

16.June 2019

It looks that time series momentum is one of the most prevalent effects in finance. Once again, an academic paper shows that it works in every corner of financial markets – in traditional assets, alternative assets and even in long short equity factors …

Authors: Babu, Levine, Ooi, Pedersen, Stamelos

Title: Trends Everywhere

Link: https://papers.ssrn.com/sol3/papers.cfm?abstract_id=3386035

Abstract:

We provide new out-of-sample evidence on trend-following investing by studying its performance for 82 securities not previously examined and 16 long-short equity factors. Specifically, we study the performance of time series momentum for emerging market equity index futures, fixed income swaps, emerging market currencies, exotic commodity futures, credit default swap indices, volatility futures, and long-short equity factors. We find that time series momentum has worked across these asset classes and across several trend horizons. We examine the co-movement of trends across asset classes and factors, the performance during different market environments, and discuss the implications for investors.

Notable quotations from the academic research paper:

"Our full data contains 156 assets, of which 58 are the “traditional assets” studied in the literature cited above, 82 are “alternative assets,” meaning futures, forwards, and swaps not previously studied, and 16 are “factors” constructed as long-short equity portfolios. In other words, we collect so much new data that the number of new assets outnumbers the “traditional assets” studied in the literature. While we broaden the universe, we only consider investable liquid assets or strategies.

We find strong evidence for time series momentum across the assets and factors that we study. Over our sample period, the gross Sharpe ratio of 12-month time series momentum for traditional assets is 1.17, and the strategy delivers an even higher Sharpe ratio of 1.34 for the alternative assets. The Sharpe ratio for long-short equity factors is 0.95, and, when we diversify across all three asset groups, the combined trend-following strategy yields a gross Sharpe ratio of 1.60.

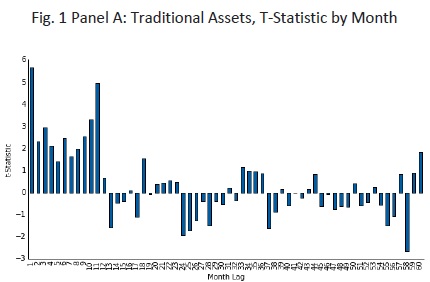
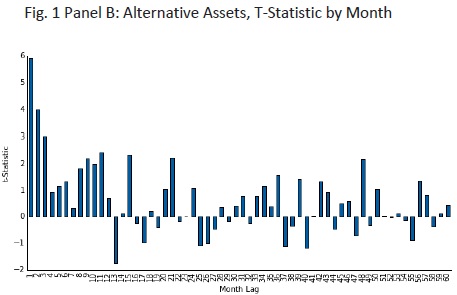
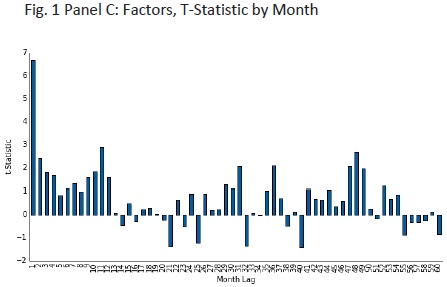
Figure 1 reports the t-statistics from the regression, using lags ranging from 1 month to 60 months. Panel A reports the results for traditional assets. The positive t-statistics for the first 12 months indicate return continuation – that is, trends – and t-statistics larger than 2 in magnitude are statistically significant, consistent with earlier findings. For lags above 12 months, we see some negative coefficients, indicating trend reversals, although these tend to be statistically insignificant. Panel B extends the analysis to alternative assets, which also display strong return continuation for the first 12 months, and more mixed returns beyond 12 months. Panel C extends the analysis to equity factor portfolios, showing that time series predictability is feature of more than just traditional and alternative assets, but also of equity factors, with positive t-statistics across the most recent 12 months. These results demonstrate the remarkable pervasiveness of return continuation for the most recent 12 months, but not for returns beyond 12 months, across a range of assets and equity factors.

Traditional assets. Our data for traditional assets are the prices of 58 liquid futures and forwards, consisting of 9 developed equity index futures, 13 developed bond futures, 12 cross-currency forward pairs (from nine underlying currencies), and 24 commodity futures.

t-stat for traditional assets

Alternative assets. Our data for alternative assets consist of prices for 7 emerging market equity index futures, 17 fixed income swaps, 24 emerging market cross currency pairs, 21 commodity futures, 5 credit default swap indices, and 8 volatility futures.

t-stat for alternative assets

Equity factors. For equity factors, our data consist of 16 of the most well-cited and robust single-name stock selection factors

t-stat for factors

"


Are you looking for more strategies to read about? Check http://quantpedia.com/Screener

Do you want to see performance of trading systems we described? Check http://quantpedia.com/Chart/Performance

Do you want to know more about us? Check http://quantpedia.com/Home/About


Follow us on:

Facebook: https://www.facebook.com/quantpedia/

Twitter: https://twitter.com/quantpedia

Youtube: https://www.youtube.com/channel/UC_YubnldxzNjLkIkEoL-FXg


Continue reading

Equity Momentum in Years 1820-1930

10.June 2019

Once again, our favorite type of study – an out of sample research study based on data from 19th and beginning of 20th century.  Interesting research paper related to all equity momentum strategies …

Authors: Trigilia, Wang

Title: Momentum, Echo and Predictability: Evidence from the London Stock Exchange (1820-1930)

Link: https://papers.ssrn.com/sol3/papers.cfm?abstract_id=3373164

Abstract:

We study momentum and its predictability within equities listed at the London Stock Exchange (1820-1930). At the time, this was the largest and most liquid stock market and it was thinly regulated, making for a good laboratory to perform out-of-sample tests. Cross-sectionally, we find that the size and market factors are highly profitable, while long-term reversals are not. Momentum is the most profitable and volatile factor. Its returns resemble an echo: they are high in long-term formation portfolios, and vanish in short-term ones. We uncover momentum in dividends as well. When controlling for dividend momentum, price momentum loses significance and profitability. In the time-series, despite the presence of a few momentum crashes, dynamically hedged portfolios do not improve the performance of static momentum. We conclude that momentum returns are not predictable in our sample, which casts some doubt on the success of dynamic hedging strategies.

Notable quotations from the academic research paper:

"This paper studies momentum and its predictability in the context of the rst modern stock market, the London Stock Exchange (LSE), from the 1820s to the 1920s.

Factors' performance. Compared to the U.S. post-1926, we find that the market has been less profi table – averaging 5% annually (but also less volatile). Its Sharpe ratio has been 0.34, not too far from the 0.43 of CRSP. The Small-Minus-Big (SMB) factor delivered a 4.85% average annual return, much higher than that found in U.S. post-1926. The risk-free rate, as proxied by the interest on British Government's consols, has been close to 3.3% throughout the period, despite the many large changes in supply (i.e., in the outstanding stock of public debt). As for momentum (UMD), consistent with the existing evidence it has been the most profi table factor – with an average annual return close to 9% – and the most volatile – with 20% annual standard deviation.

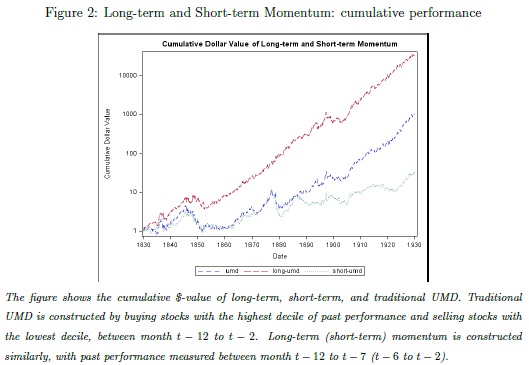
Momentum in years 1820-1930

Dissecting momentum returns. Recent literature debates whether momentum is long or short term. In our sample, UMD profi ts strongly depend on the formation period: they average at 10.6% annually for long-term formation (12 to 7 months) and 3.8% for short-term formation (6 to 2 months). So, our out-of-sample test confi rms that momentum is better described as a within-year echo.

To investigate the role of fundamentals as drivers of price momentum, we construct two sets of earnings momentum portfolio. The first earnings momentum portfolio is constructed based on the past dividend paid by the firm relative to its market cap. The portfolio buys stocks of the highest dividend-paying firms over a 12 to 2 months formation period, and shorts the stocks of the lowest ones. We find strong evidence that our dividend momentum (DIV) strategy is pro fitable across our sample: it yields a 5% average annual return with a standard deviation of 12%.

The second earnings momentum portfolio is constructed based on the dividend innovations. Speci cally, we look at the change of dividend year to year, and construct the DIV portfolio. The portfolio buys stocks with the highest change in dividend paid and shorts the stocks with the lowest ones. The DIV portfolio yield an over 24% return with a standard deviation of only 13.2%.

To discern whether price momentum seems driven by dividend momentum, we also test whether the alpha of the static UMD portfolio remains signi ficant and positive after we control for the Fama-French three factors plus the dividend momentum portfolio. In the EW sample, price momentum delivers excess returns of about 8.8% after controlling for the Fama-French three factors, signifi cant at the 1%. However, introducing DIV momentum reduces the alpha to 2.9%, and the alpha is insigni ficantly di fferent from zero. As for VW portfolios, they deliver higher alphas but are less precisely estimated. In this case, the annualized alpha of price momentum drops by half from 11.2% to 5.8% after controlling for DIV momentum.

Momentum crashes. We find that the distribution of monthly momentum returns is left skewed and displays excess kurtosis. Within the five largest EW (VW) momentum crashes, investors lost 18% (26%) on average. The difference between the beta of the winners and that of the losers has been -2.4 (-3.5), on average, and the losses stemmed mostly from the performance of the losers, which averaged at 24% (21%) monthly return. We find little action in the winners portfolio, which returned on average 2% (-6%).

Predictability and dynamic hedging. Dynamic hedging consists in levering the portfolio when its realized volatility has been low and/or the market has been under-performing, and de-levering otherwise. We begin our analysis by looking at whether set of variables helps predicting momentum returns in our sample, and we find that it does not. Probably, this is because the crashes in our sample are more heterogeneous both in terms of origins and in terms of length. In particular, they do not necessarily occur when the market rebounds after a long downturn, and they tend to last for shorter periods of time. As a consequence, our out-of-sample test of the dynamic hedged UMD strategy shows that either it underperforms static momentum, or it does not improve its returns.

"


Are you looking for more strategies to read about? Check http://quantpedia.com/Screener

Do you want to see performance of trading systems we described? Check http://quantpedia.com/Chart/Performance

Do you want to know more about us? Check http://quantpedia.com/Home/About


Follow us on:

Facebook: https://www.facebook.com/quantpedia/

Twitter: https://twitter.com/quantpedia

Youtube: https://www.youtube.com/channel/UC_YubnldxzNjLkIkEoL-FXg


Continue reading

Subscribe for Newsletter

Be first to know, when we publish new content


    logo
    The Encyclopedia of Quantitative Trading Strategies

    Log in