Equity Momentum in Years 1820-1930
Once again, our favorite type of study – an out of sample research study based on data from 19th and beginning of 20th century. Interesting research paper related to all equity momentum strategies … Authors: Trigilia, Wang Title: Momentum, Echo and Predictability: Evidence from the London Stock Exchange (1820-1930) Link: https://papers.ssrn.com/sol3/papers.cfm?abstract_id=3373164 Abstract: We study momentum and its predictability within equities listed at the London Stock Exchange (1820-1930). At the time, this was the largest and most liquid stock market and it was thinly regulated, making for a good laboratory to perform out-of-sample tests. Cross-sectionally, we find that the size and market factors are highly profitable, while long-term reversals are not. Momentum is the most profitable and volatile factor. Its returns resemble an echo: they are high in long-term formation portfolios, and vanish in short-term ones. We uncover momentum in dividends as well. When controlling for dividend momentum, price momentum loses significance and profitability. In the time-series, despite the presence of a few momentum crashes, dynamically hedged portfolios do not improve the performance of static momentum. We conclude that momentum returns are not predictable in our sample, which casts some doubt on the success of dynamic hedging strategies. Notable quotations from the academic research paper: “This paper studies momentum and its predictability in the context of the rst modern stock market, the London Stock Exchange (LSE), from the 1820s to the 1920s. Factors’ performance. Compared to the U.S. post-1926, we find that the market has been less profi table – averaging 5% annually (but also less volatile). Its Sharpe ratio has been 0.34, not too far from the 0.43 of CRSP. The Small-Minus-Big (SMB) factor delivered a 4.85% average annual return, much higher than that found in U.S. post-1926. The risk-free rate, as proxied by the interest on British Government’s consols, has been close to 3.3% throughout the period, despite the many large changes in supply (i.e., in the outstanding stock of public debt). As for momentum (UMD), consistent with the existing evidence it has been the most profi table factor – with an average annual return close to 9% – and the most volatile – with 20% annual standard deviation.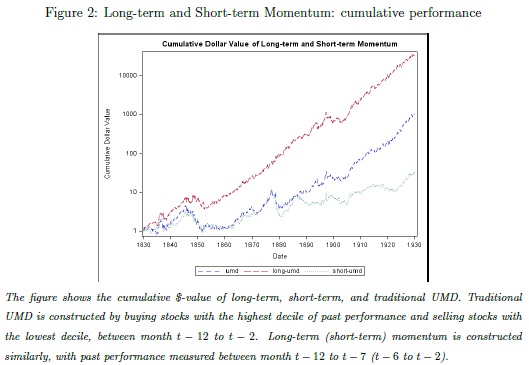
| Do you want to test these ideas yourself? We offer our readers Historical Trading Data Discounts. |
Are you looking for more strategies to read about? Sign up for our newsletter or visit our Blog or Screener.
Do you want to learn more about Quantpedia Premium service? Check how Quantpedia works, our mission and Premium pricing offer.
Do you want to learn more about Quantpedia Pro service? Check its description, watch videos, review reporting capabilities and visit our pricing offer.
Do you want algorithmic access to the full Quantpedia database via the API? Subscribe to Quantpedia Pro, ask for an API key, and explore the in/out-of-sample statistics, source academic papers, and code snippets — ideal for quantitative research, systematic trading workflows, and AI model training.
Are you looking for historical data or backtesting platforms? Check our list of Algo Trading Discounts.
Or follow us on:
Facebook Group, Facebook Page, Telegram, Twitter, Linkedin, Medium or Youtube
Share onLinkedInTwitterFacebookRefer to a friend


