Time-Series Momentum Works Everywhere
It looks that time series momentum is one of the most prevalent effects in finance. Once again, an academic paper shows that it works in every corner of financial markets – in traditional assets, alternative assets and even in long short equity factors …
Authors: Babu, Levine, Ooi, Pedersen, Stamelos
Title: Trends Everywhere
Link: https://papers.ssrn.com/sol3/papers.cfm?abstract_id=3386035
Abstract:
We provide new out-of-sample evidence on trend-following investing by studying its performance for 82 securities not previously examined and 16 long-short equity factors. Specifically, we study the performance of time series momentum for emerging market equity index futures, fixed income swaps, emerging market currencies, exotic commodity futures, credit default swap indices, volatility futures, and long-short equity factors. We find that time series momentum has worked across these asset classes and across several trend horizons. We examine the co-movement of trends across asset classes and factors, the performance during different market environments, and discuss the implications for investors.
Notable quotations from the academic research paper:
“Our full data contains 156 assets, of which 58 are the “traditional assets” studied in the literature cited above, 82 are “alternative assets,” meaning futures, forwards, and swaps not previously studied, and 16 are “factors” constructed as long-short equity portfolios. In other words, we collect so much new data that the number of new assets outnumbers the “traditional assets” studied in the literature. While we broaden the universe, we only consider investable liquid assets or strategies.
We find strong evidence for time series momentum across the assets and factors that we study. Over our sample period, the gross Sharpe ratio of 12-month time series momentum for traditional assets is 1.17, and the strategy delivers an even higher Sharpe ratio of 1.34 for the alternative assets. The Sharpe ratio for long-short equity factors is 0.95, and, when we diversify across all three asset groups, the combined trend-following strategy yields a gross Sharpe ratio of 1.60.
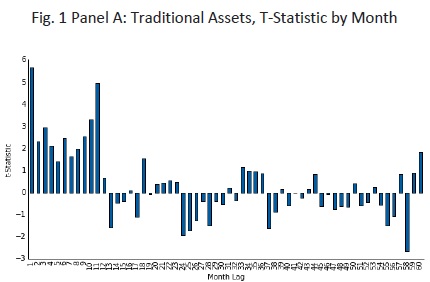
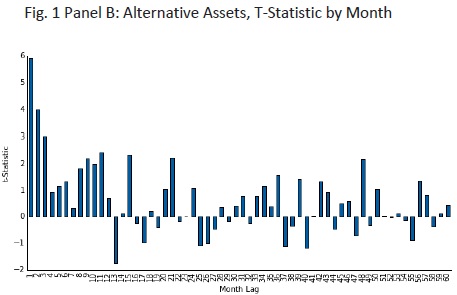
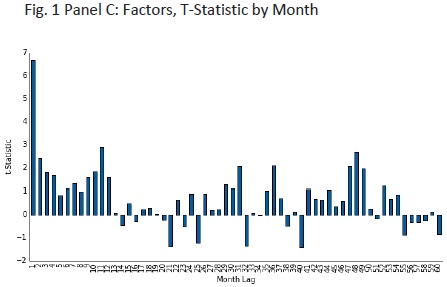
Figure 1 reports the t-statistics from the regression, using lags ranging from 1 month to 60 months. Panel A reports the results for traditional assets. The positive t-statistics for the first 12 months indicate return continuation – that is, trends – and t-statistics larger than 2 in magnitude are statistically significant, consistent with earlier findings. For lags above 12 months, we see some negative coefficients, indicating trend reversals, although these tend to be statistically insignificant. Panel B extends the analysis to alternative assets, which also display strong return continuation for the first 12 months, and more mixed returns beyond 12 months. Panel C extends the analysis to equity factor portfolios, showing that time series predictability is feature of more than just traditional and alternative assets, but also of equity factors, with positive t-statistics across the most recent 12 months. These results demonstrate the remarkable pervasiveness of return continuation for the most recent 12 months, but not for returns beyond 12 months, across a range of assets and equity factors.
Traditional assets. Our data for traditional assets are the prices of 58 liquid futures and forwards, consisting of 9 developed equity index futures, 13 developed bond futures, 12 cross-currency forward pairs (from nine underlying currencies), and 24 commodity futures.
Alternative assets. Our data for alternative assets consist of prices for 7 emerging market equity index futures, 17 fixed income swaps, 24 emerging market cross currency pairs, 21 commodity futures, 5 credit default swap indices, and 8 volatility futures.
Equity factors. For equity factors, our data consist of 16 of the most well-cited and robust single-name stock selection factors
Are you looking for more strategies to read about? Sign up for our newsletter or visit our Blog or Screener.
Do you want to learn more about Quantpedia Premium service? Check how Quantpedia works, our mission and Premium pricing offer.
Do you want to learn more about Quantpedia Pro service? Check its description, watch videos, review reporting capabilities and visit our pricing offer.
Do you want algorithmic access to the full Quantpedia database via the API? Subscribe to Quantpedia Pro, ask for an API key, and explore the in/out-of-sample statistics, source academic papers, and code snippets — ideal for quantitative research, systematic trading workflows, and AI model training.
Are you looking for historical data or backtesting platforms? Check our list of Algo Trading Discounts.
Or follow us on:
Facebook Group, Facebook Page, Twitter, Linkedin, Medium or Youtube
Share onLinkedInTwitterFacebookRefer to a friend


