Earnings announcement

How to Improve Post-Earnings Announcement Drift with NLP Analysis

11.October 2022

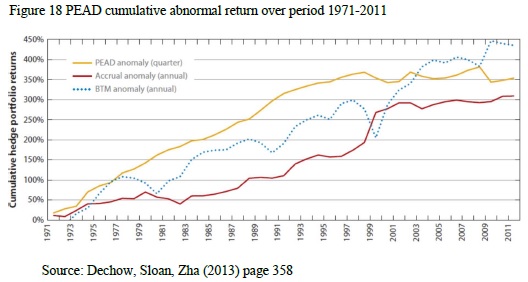
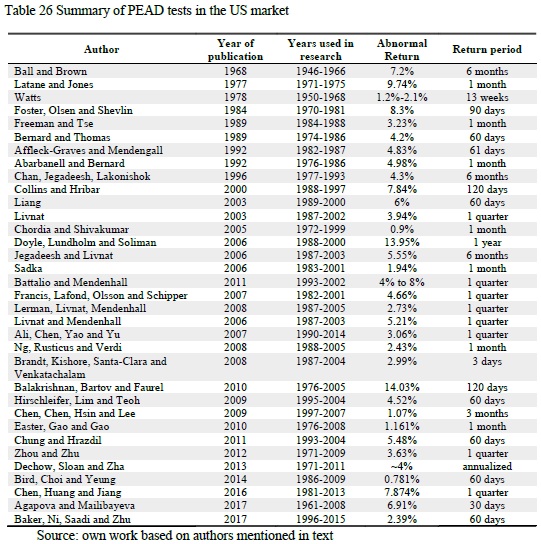
Post–earnings-announcement drift (abbr. PEAD) is a well-researched phenomenon that describes the tendency for a stock’s cumulative abnormal returns to drift in the direction of an earnings surprise for some time (several weeks or even several months) following an earnings announcement. There have been many explanations for the existence of this phenomenon. One of the most widely accepted explanations for the effect is that investors under-react to the earnings announcements. Although we already addressed such an effect in some of our previous articles and strategies, we now present a handy method of improving the PEAD by using linguistic analysis of earnings call transcripts.

Continue reading

New Machine Learning Model for CEOs Facial Expressions

9.August 2021


Nowadays, it is a standard that fillings such as 10-Ks and 10-Qs are analyzed with machine learning models. ML models can extract sentiment, similarity metrics and many more. However, words are not everything, and we humans also communicate in other forms. For example, we show our emotions through facial expressions, but the research on this topic in finance is scarce. Novel research by Banker et al. (2021) fills the gap and examines the CEOs facial expressions during CNBC’s video interviews about corporate earnings.

Continue reading

First-Half Month Cash-Flow News and Momentum in Stocks

24.September 2020

Stock prices react to the new information that investors continually receive from many sources. There are some major events, which are commonly connected with a new piece of information and subsequent reactions of investors. For example, quarterly earnings-announcements are the cause of the post-earnings announcement drift or PEAD. According to the PEAD, prices tend to continue to drift up (down) after positive (negative) news. But news related to quarterly announcements is not the only important information. A novel research paper written by the Hong and Yu explores implications of the month-end reporting, analyst revisions and management guidance that are coming to market usually in the first half of each month and are also connected with drifts that offer practitioners profitable opportunities.

Authors: Claire Yurong Hong and Jialin Yu

Title: Month-End Reporting, Cash-Flow News, and Asset Pricing

Continue reading

Pre-Announcement Returns

26.August 2020

Earnings announcement days are really important dates in a usual yearly corporate routine. The stock market usually reacts sharply on earnings announcement news and stocks on average earn statistically significant return excess of the market over the short window centred around the announcements. But how does the movement of stocks look before earnings announcement? The recent research paper written by Gao, Hu, and Zhang analyzes price action before and after earnings announcement and shows that a majority of the announcement month premium is realized during the pre-announcement period. Stocks with higher levels of uncertainty (stocks are sorted based on their option implied volatilities) experience larger pre-announcement returns and more uncertainty resolution during the pre-announcement period…

Authors: Gao, Chao and Hu, Grace Xing and Zhang, Xiaoyan.

Title: Uncertainty Resolution Before Earnings Announcements

Continue reading

50 Years in PEAD (Post Earnings Announcement Drift) Research

5.July 2019

A new research paper related to:

#33 – Post-Earnings Announcement Effect

Authors: Sojka

Title: 50 Years in PEAD Research

Link: https://papers.ssrn.com/sol3/papers.cfm?abstract_id=3281679

Abstract:

Analysing earning’s predictive power on stock returns was in the heart of academic research since late 60’s. First introduced to academic world in 1967 during seminar “Analysis of Security Prices” by Chicago University Professors Ray Ball and Philip Brown. In the next four decades was extensively analysed by many academics and is now a well-documented anomaly and is referred to as Post Earnings Announcement Drift (PEAD). This phenomenon is still at the centre of academic research because it stands at odds with efficient market hypothesis which assumes that all information is instantaneously reflected in stock prices. Professional investors are also closely looking at PEAD as it implies that it is easy to beat the market average by simply ranking stocks based on their earnings surprise and investing in the top decile, quintile or quartile and shorting the bottom part. Academic evidence shows that this strategy produces an abnormal return of somewhere between 2.6% and 9.37% per quarter, according to various authors. In this paper I will present existing evidence supporting and contradicting “PEAD”, the history of academic research in that field and various techniques used to verify the phenomenon. The paper is organised as follows: first the history of the PEAD academic research is presented, in the second more recent evidence and research techniques used by authors are presented and finally conclusions and various critics of PEAD are shown.

Notable quotations from the academic research paper:

"Post Earnings Announcement Drift is a measure of markets inability to price correctly information contained in earnings report. Since it was first spotted by Ball and Brown (1968), it went through rigorous academic scrutiny, first to test if it really exists (Ball (1978), Latane and Jones (1977)), then to measure its magnitude in various time frames, to offer explanations for its existence and find more PEAD variations. On average academics found that the postponed response to earnings information produces about 6% abnormal 60 days return (Dechow et al (2013)). The whole market reaction attributed to earnings report, measured from 60 days prior to earnings release to 60 days after is estimated at 18%, which means that about a third of the whole market response is delayed – Dechow et al (2013).

Figure 18 presents cumulative PEAD strategy abnormal returns for a 40-years period from 1971 to 2011. The total abnormal return of the strategy is an astonishing 350%, which is beat only by BTM (Book-to-Market) strategy. PEAD profits are very consistent up to late 90’s, then we can observe dips in the abnormal returns during internet bubble (1991-2001) and then during market recovery after 2008 crash. Since the middle of the 90’s PEAD returns became riskier and much lower than in the previous 25 years, it may be attributed to wider academic research in the field and wider recognition of the phenomenon among investors.

PEAD strategy chart

The PEAD strategy is not easy to implement in practice as it requires large scale data collection and data processing, more recent advancements in information processing technologies may also affect the magnitude of PEAD exploitation. A dominant part of research on PEAD was conducted in the US and based on US stock market data. The magnitude of PEAD computed by academics across time, since 1968 when first academic paper mentioning PEAD was published, up to the most recent evidence, are shown in Table 26.

Summary of PEAD tests

PEAD premium computed based on US market data by academics is not easily comparable. There are differences in period studied, subset of stocks used, definitions of expected earnings or unexpected earnings signal altogether. Among the results presented in Table 26, the highest return 14.03% in 120 days presented by Balakrishnan et al (2009) and the lowest is Chordia and Shivakumar (2005) 0.9% in 1 month. Both of those research papers confirm PEAD premium existence, but Chordia and Shivakumar (2005) focus their attention on explaining joint anomalies of momentum and PEAD, and form portfolios each month regardless of profit announcement date, taking last announced earnings in their SUE ranking, which obviously weakens the earnings signal."


Are you looking for more strategies to read about? Check http://quantpedia.com/Screener

Do you want to see performance of trading systems we described? Check http://quantpedia.com/Chart/Performance

Do you want to know more about us? Check http://quantpedia.com/Home/About


Follow us on:

Facebook: https://www.facebook.com/quantpedia/

Twitter: https://twitter.com/quantpedia

Youtube: https://www.youtube.com/channel/UC_YubnldxzNjLkIkEoL-FXg


Continue reading

Subscribe for Newsletter

Be first to know, when we publish new content


    logo
    The Encyclopedia of Quantitative Trading Strategies

    Log in