Trendfollowing

Two Centuries of Global Factor Premiums

7.March 2019

Related to all major factor strategies (trend, momentum, value, carry, seasonality and low beta/volatility):

Authors: Baltussen, Swinkels, van Vliet

Title: Global Factor Premiums

Link: https://papers.ssrn.com/sol3/papers.cfm?abstract_id=3325720

Abstract:

We examine 24 global factor premiums across the main asset classes via replication and new-sample evidence spanning more than 200 years of data. Replication yields ambiguous evidence within a unified testing framework with methods that account for p-hacking. The new-sample evidence reveals that the large majority of global factors are strongly present under conservative p-hacking perspectives, with limited out-of-sample decay of the premiums. Further, utilizing our deep sample, we find global factor premiums to be not driven by market, downside, or macroeconomic risks. These results reveal strong global factor premiums that present a challenge to asset pricing theories.

Notable quotations from the academic research paper:

"In this paper we study global factors premiums over a long and wide sample spanning the recent 217 years across equity index (but not single securities), bond, currency, and commodity markets.

The first objective of this study is to robustly and rigorously examine these global factor premiums from the perspective of ‘p-hacking’.

We take as our starting point the main global return factors published in the Journal of Finance and the Journal of Financial Economics during the period 2012-2018: time-series momentum (henceforth ‘trend’), cross-sectional momentum (henceforth ‘momentum’), value, carry, return seasonality and betting-against-beta (henceforth ‘BAB’). We examine these global factors in four major asset classes: equity indices, government bonds, commodities and currencies, hence resulting in a total of 24 global return factors.4

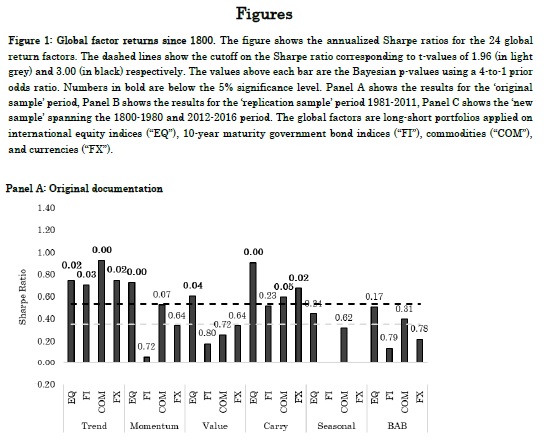
We work from the idea that these published factor premiums could be influenced by p-hacking and that an extended sample period is useful for falsification or verification tests. Figure 1, Panel A summarizes the main results of these studies.

Global factor strategies

Shown are the reported Sharpe ratio’s in previous publications, as well as the 5% significance cutoff in the grey-colored dashed line. In general, the studies show evidence on the global factor premiums, with 14 of the 22 factors (return seasonality is not tested in bonds and currencies) displaying significant Sharpe ratio’s at the conventional 5% significance level.

Global factor strategies 1981-20111

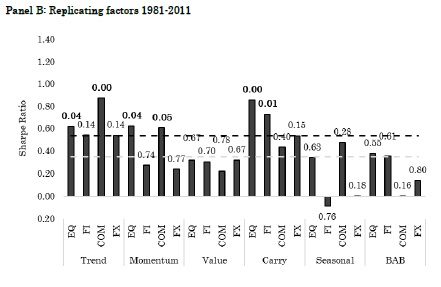
Further, most of the studies have differences in, amongst others, testing methodologies, investment universes and sample periods, choices that introduce degrees of freedom to the researcher. To mitigate the impact of such degrees of freedom, we reexamine the global return factors using uniform choices on testing methodology and investment universe over their average sample period (1981-2011). Figure 1, Panel B shows the results of this replicating exercise. We find that Sharpe ratios are marginally lower, with 12 of the 24 factor premiums being significant at the conventional 5% level.

Global factor strategies 1981-2011


The second objective of this study is to provide rigorous new sample evidence on the global return factors. To this end, we construct a deep, largely uncovered historical global database on the global return factors in the four major asset classes. This data consists of pre-sample data spanning the period 1800- 1980, supplemented with post-sample data from 2012-2016, such that we have an extensive new sample to conduct further analyses. If the global return factors were unintentionally the result of p-hacking, we would expect them to disappear for this new sample period.

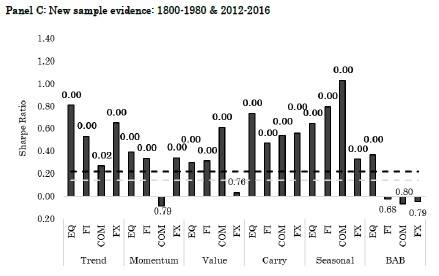
Our new sample findings reveal consistent and ubiquitous evidence for the large majority of global return factors. Figure 1, Panel C summarizes our main findings by depicting the historical Sharpe ratio’s in the new sample period. In terms of economic significance, the Sharpe ratios are substantial, with an average of 0.41. Remarkably, in contrast to most out-of-sample studies we see very limited ‘out-of-sample’ decay of factor premiums.

In terms of statistical significance and p-hacking perspectives, 19 of the 24 t-values are above 3.0,19 Bayesian p-values are below 5%, and the break-even prior odds generally need to be above 9,999 to have less than 5% probability that the null hypothesis is true."


Are you looking for more strategies to read about? Check http://quantpedia.com/Screener

Do you want to see performance of trading systems we described? Check http://quantpedia.com/Chart/Performance

Do you want to know more about us? Check http://quantpedia.com/Home/About


Follow us on:

Facebook: https://www.facebook.com/quantpedia/

Twitter: https://twitter.com/quantpedia


Continue reading

Why Is Allocation to Trend-Following Strategy So Low?

21.February 2019

Related to all trendfollowing strategies:

Authors: Dugan, Greyserman

Title: Skew and Trend Aversion

Link: https://papers.ssrn.com/sol3/papers.cfm?abstract_id=3315719

Abstract:

Despite evidence of the benefits to portfolio Sharpe ratio and variance, actual investor allocations to Trend Following strategies are typically 5% or less. Why is there such a significant discrepancy between the optimal allocation and actual allocation to Trend? We investigate known behavioral biases as a potential reason. While decision makers have other reasons to exclude Trend Following from their portfolios, in this paper, we explore loss aversion, recency bias, and the ambiguity effect as they pertain to Trend Following, and we call the combination of the three Trend Aversion. We quantify Trend Aversion and show that these biases are a viable explanation for suboptimal allocations to Trend. We demonstrate a direct connection between quantifications of known behavioral biases and current suboptimal allocations to Trend Following. Recognition of these relationships will help highlight the pitfalls of behavioral biases.

Notable quotations from the academic research paper:

"Investors may have reasons for excluding Trend Following from their portfolios ranging from time-horizon for performance, to drawdowns, to potential capacity issues. However, the strategy's long performance history shows that a meaningful allocation would have increased portfolio Sharpe ratio and reduced portfolio variance, and yet typical investments remain at or below 5%. Some investors have no exposure.

The strategy's quantitative nature, positive skew, and frequent but small losses act in concert to trigger loss aversion, recency bias, and the ambiguity e ffect. We call the combination of the three Trend Aversion.

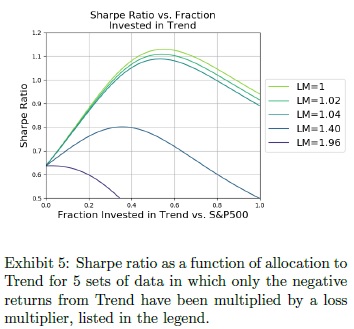
Sharpe ratio vs. Fraction invested in Trend


Our results show Trend Aversion is a viable explanation of suboptimal allocations to Trend Following. Decades of psychological research show that people mentally inflate losses by a factor of two. In this paper, we demonstrated that a loss multiplier between 1.5 and 2.5 would cause the typical allocation to Trend of 5% in a simple two asset portfolio, in an 11-asset portfolio with random allocations, and in two other 11-asset portfolio constructions with dynamic allocations. We showed that loss aversion can decrease allocators Sharpe ratios by up to 50%. Using lookback windows in a dynamically allocated portfolio, we demonstrated that recency bias drives down allocations to Trend. Finally, we showed that combinations of loss aversion and recency bias also drive Trend allocations to suboptimal levels.

Many investors who are subject to Trend Aversion as a practical matter, for example due to investment committees or reporting structures, are unsure of how to balance Trend Aversion with the bene ts of Trend Following to reach an allocation decision. By establishing a methodology to optimize allocations under loss aversion, we provide a framework which investors can use to formalize their allocation decisions. Investors who are subject to typical loss aversion should permanently allocate at least 5% to Trend Following, while investors whose loss aversion is lower can benefi t substantially by allocating materially more than 5%."


Are you looking for more strategies to read about? Check http://quantpedia.com/Screener

Do you want to see performance of trading systems we described? Check http://quantpedia.com/Chart/Performance

Do you want to know more about us? Check http://quantpedia.com/Home/About


Follow us on:

Facebook: https://www.facebook.com/quantpedia/

Twitter: https://twitter.com/quantpedia


Continue reading
Subscription Form

Subscribe for Newsletter

 Be first to know, when we publish new content
logo
The Encyclopedia of Quantitative Trading Strategies

Log in

QuantPedia
Privacy Overview

This website uses cookies so that we can provide you with the best user experience possible. Cookie information is stored in your browser and performs functions such as recognising you when you return to our website and helping our team to understand which sections of the website you find most interesting and useful.