Equity Factor Strategies In Frontier Markets
A new research paper related to all equity factor strategies …
Authors: Zaremba, Maydybura, Czapkiewicz, Arnaut
Title: Explaining Equity Anomalies In Frontier Markets: A Horserace of Factor Pricing Models
Link: https://papers.ssrn.com/sol3/papers.cfm?abstract_id=3378785
Abstract:
We are the first to compare the explanatory power of the major empirical asset pricing models over equity anomalies in the frontier markets. We replicate over 160 stock market anomalies in 23 frontier countries for years 1996–2017, and evaluate their performance with the factor models. The Carhart’s (1997) four-factor model outperforms both the recent Fama and French (2015) five-factor model and the q-model by Hou, Xue, and Zhang (2015). Its superiority is driven by the ability to explain the momentum-related anomalies. Inclusion of additional profitability and investment factors lead to no further major improvement in the performance. Nonetheless, none of the models is able to fully explain the abnormal returns on all of the anomaly portfolios.
Notable quotations from the academic research paper:
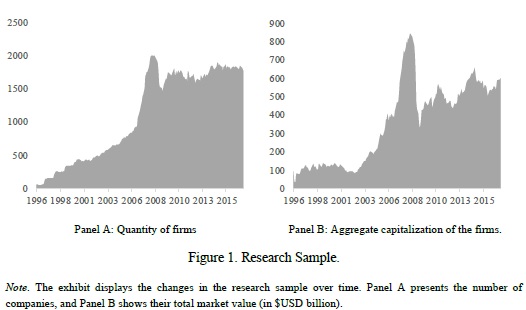
“In times of soaring correlations among global stocks and increasing controversies on anomaly performance in emerging stock markets, one specific asset class may offer a remedy: frontier equities. Deemed the least developed emerging markets, the frontier countries are scattered around the globe, with presence in Africa, Asia, Europe, and Latin America. Being very diverse both economically and geographically, they range from the wealthy oil-producing kingdoms in the Gulf to some of the poorest countries in Africa. While the current size of the frontier stock markets is still fairly small – the total capitalization of the MSCI Frontier Market Index constituents equaled $134 billion in May 2018 (MSCI, 2018), accounting for less than 0.4% of developed markets – yet, the interest in them is growing quickly.
Considering the future potential, along with the soaring interest of the international community, and the investment opportunities, it is surprising how underresearched – if not ignored – the frontier equities are. The number of academic studies on this stock market class seems astonishingly modest. This leaves numerous important questions, which may be of huge importance for global investors, unanswered. Which equity anomalies – discovered originally in developed countries – work also in the frontier stock markets? Could they be translated into profitable strategies using easily-to-implement quantitative methods? Finally, which asset pricing models and factors best summarize the cross-sectional return patterns and the equity anomalies in frontier countries? Could the recent five-factor framework by Fama and French (2015) or the q-model by Hou, Xue, and Zhang (2015) be also applied in this growing asset class? The principal target of this study is to close this gap in the existing body of literature at least partially.
The elevated liquidity constraints, higher trading costs, short sale unavailability accompanied by less sophisticated investors may potentially result in larger mispricing and more pronounced stock market anomalies.
Our research aims to contribute in three primary ways. Our first goal is to conduct the most comprehensive test on which equity anomalies, discovered originally in the developed countries, are also present in the frontier equities. Thus, we examine the performance of 167 anomalies from the finance literature, encompassing different classes of patterns related to value, trend following, investment, profitability, risk, and many others. The large-scale analysis available in broadly-accessible journals was either limited to the few most prominent strategies, such as size, value, and momentum (Blackburn and Cakici 2017, De Groot, Pang, and Swinkels 2012). Our study aims to take a substantial leap forward in understanding the multidimensionality of equity returns in the frontier markets.
Second, we research which of the broadly-acknowledged asset pricing models serve best in explaining the cross-section of anomaly returns in the frontier markets. In particular, we consider seven factor pricing models: the capital asset pricing model (Sharpe 1964), abbreviated CAPM, the three-factor model (Fama and French 1993), abbreviated FF3, the four-factor model (Carhart 1997), abbreviated C4, the five-factor model (Fama and French 2015), abbreviated FF5, the q-model by Hou, Xue, and Zhang (2015), the six-factor model by Fama and French (2018), abbreviated FF6, and the six-factor model by Barillas and Shanken (2018), abbreviated BS6.
Last but not least, our research may be regarded as a large out-of-sample test of equity anomalies.
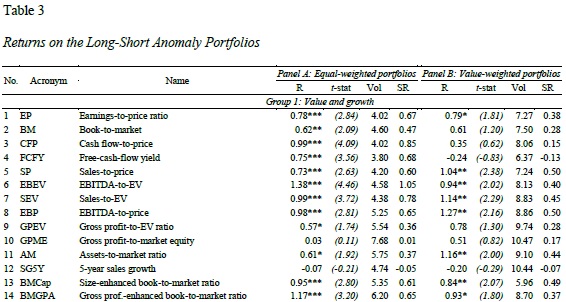
To answer our research questions, we replicate the 167 equity anomalies from Zaremba et al. (2018) in an extensive sample of over 3,600 companies from frontier markets from all over the world for years 1996 – 2017. We form the long-short anomaly portfolios and evaluate their returns using the seven considered factor pricing models: CAPM, FF3, C4, FF5, Q4, FF6, and BS6. We compare the models’ performance by employing a range of tools and statistics that assess their ability to explain the risk and mean returns jointly.
The principal findings of this study could be summarized as follows. First, out of the 167 anomaly portfolios, only 38% (19%) of the equal-weighted (value-weighted) long-short strategies produce profits significantly departing from zero at the 5% level. The successful return patterns are usually linked to the “value vs. growth” or trend following effects, verifying positively the arguments of Asness, Moskowitz, and Pedersen (2013) that value and momentum are everywhere.
Second, we demonstrate that Carhart’s (1997) four-factor model best explains the anomaly returns in frontier markets, outperforming other models in many ways. It displays lower average absolute intercepts and largest number of explained anomalies. Its cross-sectional and time-series R2 is higher CAPM, FF3, FF5, or Q4, and only marginally lower than in the case of FF6 and BS6.
Are you looking for more strategies to read about? Sign up for our newsletter or visit our Blog or Screener.
Do you want to learn more about Quantpedia Premium service? Check how Quantpedia works, our mission and Premium pricing offer.
Do you want to learn more about Quantpedia Pro service? Check its description, watch videos, review reporting capabilities and visit our pricing offer.
Do you want algorithmic access to the full Quantpedia database via the API? Subscribe to Quantpedia Pro, ask for an API key, and explore the in/out-of-sample statistics, source academic papers, and code snippets — ideal for quantitative research, systematic trading workflows, and AI model training.
Are you looking for historical data or backtesting platforms? Check our list of Algo Trading Discounts.
Or follow us on:
Facebook Group, Facebook Page, Twitter, Linkedin, Medium or Youtube
Share onLinkedInTwitterFacebookRefer to a friend


