Trendfollowing

How to Choose the Best Period for Indicators

3.December 2019

Academic literature recognizes a large set of indicators or factors that are connected with the various assets. These indicators can be utilized in a variety of trading strategies, which means that such indicators are popular among practitioners who seek to invest their funds. Usually, the indicators are connected with some evaluation period.

This paper aims to show some possible approaches to find the optimal evaluation periods of indicators. This is a key question among practitioners and therefore we see it as crucial to shed a light on this topic. Although we are focused on momentum strategies, the information in this paper is widely applicable also in the construction of any other trading strategy where the investor has to decide indicator’s period…

Continue reading

Equity Factor Strategies In Frontier Markets

12.July 2019

A new research paper related to all equity factor strategies …

Authors: Zaremba, Maydybura, Czapkiewicz, Arnaut

Title: Explaining Equity Anomalies In Frontier Markets: A Horserace of Factor Pricing Models

Link: https://papers.ssrn.com/sol3/papers.cfm?abstract_id=3378785

Abstract:

We are the first to compare the explanatory power of the major empirical asset pricing models over equity anomalies in the frontier markets. We replicate over 160 stock market anomalies in 23 frontier countries for years 1996–2017, and evaluate their performance with the factor models. The Carhart’s (1997) four-factor model outperforms both the recent Fama and French (2015) five-factor model and the q-model by Hou, Xue, and Zhang (2015). Its superiority is driven by the ability to explain the momentum-related anomalies. Inclusion of additional profitability and investment factors lead to no further major improvement in the performance. Nonetheless, none of the models is able to fully explain the abnormal returns on all of the anomaly portfolios.

Notable quotations from the academic research paper:

"In times of soaring correlations among global stocks and increasing controversies on anomaly performance in emerging stock markets, one specific asset class may offer a remedy: frontier equities. Deemed the least developed emerging markets, the frontier countries are scattered around the globe, with presence in Africa, Asia, Europe, and Latin America. Being very diverse both economically and geographically, they range from the wealthy oil-producing kingdoms in the Gulf to some of the poorest countries in Africa. While the current size of the frontier stock markets is still fairly small – the total capitalization of the MSCI Frontier Market Index constituents equaled $134 billion in May 2018 (MSCI, 2018), accounting for less than 0.4% of developed markets – yet, the interest in them is growing quickly.

Considering the future potential, along with the soaring interest of the international community, and the investment opportunities, it is surprising how underresearched – if not ignored – the frontier equities are. The number of academic studies on this stock market class seems astonishingly modest. This leaves numerous important questions, which may be of huge importance for global investors, unanswered. Which equity anomalies – discovered originally in developed countries – work also in the frontier stock markets? Could they be translated into profitable strategies using easily-to-implement quantitative methods? Finally, which asset pricing models and factors best summarize the cross-sectional return patterns and the equity anomalies in frontier countries? Could the recent five-factor framework by Fama and French (2015) or the q-model by Hou, Xue, and Zhang (2015) be also applied in this growing asset class? The principal target of this study is to close this gap in the existing body of literature at least partially.

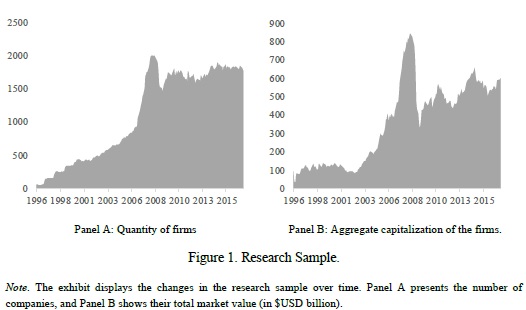
Research sample

The elevated liquidity constraints, higher trading costs, short sale unavailability accompanied by less sophisticated investors may potentially result in larger mispricing and more pronounced stock market anomalies.

Our research aims to contribute in three primary ways. Our first goal is to conduct the most comprehensive test on which equity anomalies, discovered originally in the developed countries, are also present in the frontier equities. Thus, we examine the performance of 167 anomalies from the finance literature, encompassing different classes of patterns related to value, trend following, investment, profitability, risk, and many others. The large-scale analysis available in broadly-accessible journals was either limited to the few most prominent strategies, such as size, value, and momentum (Blackburn and Cakici 2017, De Groot, Pang, and Swinkels 2012). Our study aims to take a substantial leap forward in understanding the multidimensionality of equity returns in the frontier markets.

Second, we research which of the broadly-acknowledged asset pricing models serve best in explaining the cross-section of anomaly returns in the frontier markets. In particular, we consider seven factor pricing models: the capital asset pricing model (Sharpe 1964), abbreviated CAPM, the three-factor model (Fama and French 1993), abbreviated FF3, the four-factor model (Carhart 1997), abbreviated C4, the five-factor model (Fama and French 2015), abbreviated FF5, the q-model by Hou, Xue, and Zhang (2015), the six-factor model by Fama and French (2018), abbreviated FF6, and the six-factor model by Barillas and Shanken (2018), abbreviated BS6.

Last but not least, our research may be regarded as a large out-of-sample test of equity anomalies.

To answer our research questions, we replicate the 167 equity anomalies from Zaremba et al. (2018) in an extensive sample of over 3,600 companies from frontier markets from all over the world for years 1996 – 2017. We form the long-short anomaly portfolios and evaluate their returns using the seven considered factor pricing models: CAPM, FF3, C4, FF5, Q4, FF6, and BS6. We compare the models’ performance by employing a range of tools and statistics that assess their ability to explain the risk and mean returns jointly.

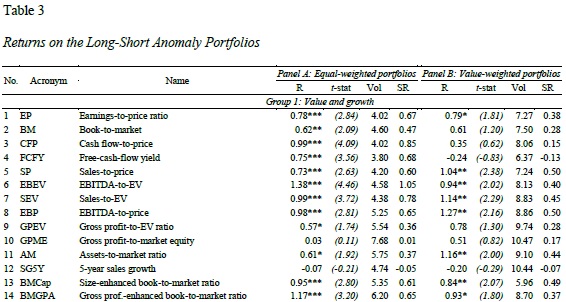
The principal findings of this study could be summarized as follows. First, out of the 167 anomaly portfolios, only 38% (19%) of the equal-weighted (value-weighted) long-short strategies produce profits significantly departing from zero at the 5% level. The successful return patterns are usually linked to the “value vs. growth” or trend following effects, verifying positively the arguments of Asness, Moskowitz, and Pedersen (2013) that value and momentum are everywhere.

Second, we demonstrate that Carhart’s (1997) four-factor model best explains the anomaly returns in frontier markets, outperforming other models in many ways. It displays lower average absolute intercepts and largest number of explained anomalies. Its cross-sectional and time-series R2 is higher CAPM, FF3, FF5, or Q4, and only marginally lower than in the case of FF6 and BS6.

Returns of long short portfolios

"


Are you looking for more strategies to read about? Check http://quantpedia.com/Screener

Do you want to see performance of trading systems we described? Check http://quantpedia.com/Chart/Performance

Do you want to know more about us? Check http://quantpedia.com/Home/About


Follow us on:

Facebook: https://www.facebook.com/quantpedia/

Twitter: https://twitter.com/quantpedia

Youtube: https://www.youtube.com/channel/UC_YubnldxzNjLkIkEoL-FXg


Continue reading

Better Rebalancing Strategy for Static Asset Allocation Strategies

13.March 2019

An interesting financial academic paper which analyzes an alternative approach to rebalancing of static asset allocation strategies:

Authors: Granger, Harvey, Rattray, Van Hemert

Title: Strategic Rebalancing

Link: https://papers.ssrn.com/sol3/papers.cfm?abstract_id=3330134

Abstract:

A mechanical rebalancing strategy, such as a monthly or quarterly reallocation towards fixed portfolio weights, is an active strategy. Winning asset classes are sold and losers are bought. During crises, when markets are often trending, this can lead to substantially larger drawdowns than a buy-and-hold strategy. Our paper shows that the negative convexity induced by rebalancing can be substantially mitigated, taking the popular 60-40 stock-bond portfolio as our use case. One alternative is an allocation to a trend-following strategy. The positive convexity of this overlay tends to counter the impact on drawdowns of the mechanical rebalancing strategy. The second alternative we call strategic rebalancing, which uses smart rebalancing timing based on trend-following signals – without a direct allocation to a trend-following strategy. For example, if the trend-following model suggests that stock markets are in a negative trend, rebalancing is delayed.

Notable quotations from the academic research paper:

"A pure buy-and-hold portfolio has the drawback that the asset mix tends to drift over time and, as such, is untenable for investors who seek diversification. However, a stock-bond portfolio that regularly rebalances tends to underperform a buy-and-hold portfolio at times of continued outperformance of one of the assets. Using a simple two-period model, we explain the main intuition behind this effect: rebalancing means selling (relative) winners, and if winners continue to outperform, that detracts from performance.

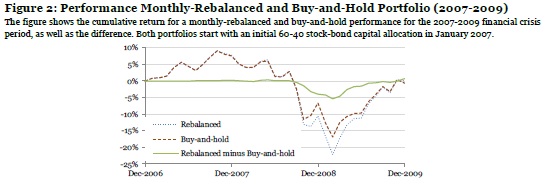
As stocks typically have more volatile returns than bonds, relative returns tend to be driven by stocks. Hence, of particular interest are episodes with continued negative (absolute and relative) stock performance, such as the 2007-2009 global financial crisis. In Figure 2, we contrast the monthly-rebalanced and buy-and-hold cumulative performance over the financial crisis period, where both start with an initial 60-40 stock-bond capital allocation. The maximum drawdown of the monthly-rebalanced portfolio is 1.2 times (or 5 percentage points) worse than that of the buy-and-hold portfolio, right at the time when financial markets turmoil is greatest.

Rebalanced and not rebalanced portfolio

In earlier work, Granger et al. (2014) formally show that rebalancing is similar to starting with a buy-and-hold portfolio and adding a short straddle (selling both a call and a put option) on the relative value of the portfolio assets. The option-like payoff to rebalancing induces negative convexity by magnifying drawdowns when there are pronounced divergences in asset returns. We show that time-series momentum (or trend) strategies, applied to futures on the same stock and bond markets, are natural complements to a rebalanced portfolio. This is because the trend payoff tends to mimic that of a long straddle option position, or exhibits positive convexity.

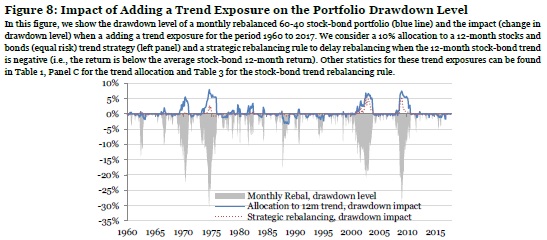
Trend exposure and portfolio drawdown

We evaluate how 1-, 3-, and 12-month trend strategies perform during the five worst drawdowns for the 60-40 stock-bond portfolio. Allocating 10% to a trend strategy and 90% to a 60-40 monthly-rebalanced portfolio improves the average drawdown by about 5 percentage points, compared to a 100% allocation to a 60-40 monthly rebalanced portfolio. The trend allocation has no adverse impact on the average return over our sample period. That is, while one would normally expect a drag on the overall (long-term) performance when allocating to a defensive strategy, in our sample, the trend-following premium earned offsets the cost (or insurance premium) paid.

An alternative to a trend allocation is strategically timing and sizing rebalancing trades, which we label strategic rebalancing. We first consider a range of popular heuristic rules, varying the rebalancing frequency, using thresholds, and trading only partially back to the 60-40 asset mix. Such heuristic rules reduce the average maximum drawdown level for the five crises considered by up to 1 percentage point. However, using strategic rebalancing rules based on either the past stock or past stock-bond relative returns gives improvements of 2 to 3 percentage points."


Are you looking for more strategies to read about? Check http://quantpedia.com/Screener

Do you want to see performance of trading systems we described? Check http://quantpedia.com/Chart/Performance

Do you want to know more about us? Check http://quantpedia.com/Home/About


Follow us on:

Facebook: https://www.facebook.com/quantpedia/

Twitter: https://twitter.com/quantpedia


Continue reading

Two Centuries of Global Factor Premiums

7.March 2019

Related to all major factor strategies (trend, momentum, value, carry, seasonality and low beta/volatility):

Authors: Baltussen, Swinkels, van Vliet

Title: Global Factor Premiums

Link: https://papers.ssrn.com/sol3/papers.cfm?abstract_id=3325720

Abstract:

We examine 24 global factor premiums across the main asset classes via replication and new-sample evidence spanning more than 200 years of data. Replication yields ambiguous evidence within a unified testing framework with methods that account for p-hacking. The new-sample evidence reveals that the large majority of global factors are strongly present under conservative p-hacking perspectives, with limited out-of-sample decay of the premiums. Further, utilizing our deep sample, we find global factor premiums to be not driven by market, downside, or macroeconomic risks. These results reveal strong global factor premiums that present a challenge to asset pricing theories.

Notable quotations from the academic research paper:

"In this paper we study global factors premiums over a long and wide sample spanning the recent 217 years across equity index (but not single securities), bond, currency, and commodity markets.

The first objective of this study is to robustly and rigorously examine these global factor premiums from the perspective of ‘p-hacking’.

We take as our starting point the main global return factors published in the Journal of Finance and the Journal of Financial Economics during the period 2012-2018: time-series momentum (henceforth ‘trend’), cross-sectional momentum (henceforth ‘momentum’), value, carry, return seasonality and betting-against-beta (henceforth ‘BAB’). We examine these global factors in four major asset classes: equity indices, government bonds, commodities and currencies, hence resulting in a total of 24 global return factors.4

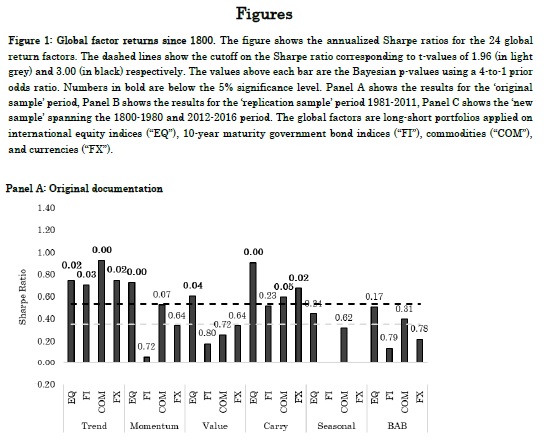
We work from the idea that these published factor premiums could be influenced by p-hacking and that an extended sample period is useful for falsification or verification tests. Figure 1, Panel A summarizes the main results of these studies.

Global factor strategies

Shown are the reported Sharpe ratio’s in previous publications, as well as the 5% significance cutoff in the grey-colored dashed line. In general, the studies show evidence on the global factor premiums, with 14 of the 22 factors (return seasonality is not tested in bonds and currencies) displaying significant Sharpe ratio’s at the conventional 5% significance level.

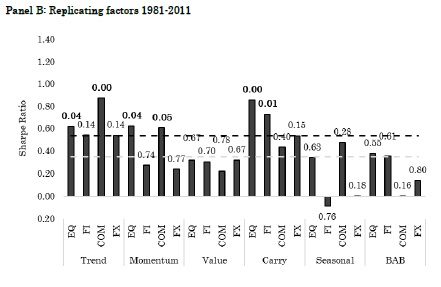
Global factor strategies 1981-20111

Further, most of the studies have differences in, amongst others, testing methodologies, investment universes and sample periods, choices that introduce degrees of freedom to the researcher. To mitigate the impact of such degrees of freedom, we reexamine the global return factors using uniform choices on testing methodology and investment universe over their average sample period (1981-2011). Figure 1, Panel B shows the results of this replicating exercise. We find that Sharpe ratios are marginally lower, with 12 of the 24 factor premiums being significant at the conventional 5% level.

Global factor strategies 1981-2011


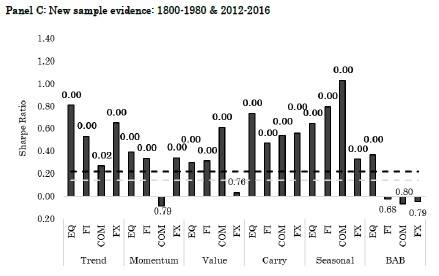
The second objective of this study is to provide rigorous new sample evidence on the global return factors. To this end, we construct a deep, largely uncovered historical global database on the global return factors in the four major asset classes. This data consists of pre-sample data spanning the period 1800- 1980, supplemented with post-sample data from 2012-2016, such that we have an extensive new sample to conduct further analyses. If the global return factors were unintentionally the result of p-hacking, we would expect them to disappear for this new sample period.

Our new sample findings reveal consistent and ubiquitous evidence for the large majority of global return factors. Figure 1, Panel C summarizes our main findings by depicting the historical Sharpe ratio’s in the new sample period. In terms of economic significance, the Sharpe ratios are substantial, with an average of 0.41. Remarkably, in contrast to most out-of-sample studies we see very limited ‘out-of-sample’ decay of factor premiums.

In terms of statistical significance and p-hacking perspectives, 19 of the 24 t-values are above 3.0,19 Bayesian p-values are below 5%, and the break-even prior odds generally need to be above 9,999 to have less than 5% probability that the null hypothesis is true."


Are you looking for more strategies to read about? Check http://quantpedia.com/Screener

Do you want to see performance of trading systems we described? Check http://quantpedia.com/Chart/Performance

Do you want to know more about us? Check http://quantpedia.com/Home/About


Follow us on:

Facebook: https://www.facebook.com/quantpedia/

Twitter: https://twitter.com/quantpedia


Continue reading

Why Is Allocation to Trend-Following Strategy So Low?

21.February 2019

Related to all trendfollowing strategies:

Authors: Dugan, Greyserman

Title: Skew and Trend Aversion

Link: https://papers.ssrn.com/sol3/papers.cfm?abstract_id=3315719

Abstract:

Despite evidence of the benefits to portfolio Sharpe ratio and variance, actual investor allocations to Trend Following strategies are typically 5% or less. Why is there such a significant discrepancy between the optimal allocation and actual allocation to Trend? We investigate known behavioral biases as a potential reason. While decision makers have other reasons to exclude Trend Following from their portfolios, in this paper, we explore loss aversion, recency bias, and the ambiguity effect as they pertain to Trend Following, and we call the combination of the three Trend Aversion. We quantify Trend Aversion and show that these biases are a viable explanation for suboptimal allocations to Trend. We demonstrate a direct connection between quantifications of known behavioral biases and current suboptimal allocations to Trend Following. Recognition of these relationships will help highlight the pitfalls of behavioral biases.

Notable quotations from the academic research paper:

"Investors may have reasons for excluding Trend Following from their portfolios ranging from time-horizon for performance, to drawdowns, to potential capacity issues. However, the strategy's long performance history shows that a meaningful allocation would have increased portfolio Sharpe ratio and reduced portfolio variance, and yet typical investments remain at or below 5%. Some investors have no exposure.

The strategy's quantitative nature, positive skew, and frequent but small losses act in concert to trigger loss aversion, recency bias, and the ambiguity e ffect. We call the combination of the three Trend Aversion.

Sharpe ratio vs. Fraction invested in Trend


Our results show Trend Aversion is a viable explanation of suboptimal allocations to Trend Following. Decades of psychological research show that people mentally inflate losses by a factor of two. In this paper, we demonstrated that a loss multiplier between 1.5 and 2.5 would cause the typical allocation to Trend of 5% in a simple two asset portfolio, in an 11-asset portfolio with random allocations, and in two other 11-asset portfolio constructions with dynamic allocations. We showed that loss aversion can decrease allocators Sharpe ratios by up to 50%. Using lookback windows in a dynamically allocated portfolio, we demonstrated that recency bias drives down allocations to Trend. Finally, we showed that combinations of loss aversion and recency bias also drive Trend allocations to suboptimal levels.

Many investors who are subject to Trend Aversion as a practical matter, for example due to investment committees or reporting structures, are unsure of how to balance Trend Aversion with the bene ts of Trend Following to reach an allocation decision. By establishing a methodology to optimize allocations under loss aversion, we provide a framework which investors can use to formalize their allocation decisions. Investors who are subject to typical loss aversion should permanently allocate at least 5% to Trend Following, while investors whose loss aversion is lower can benefi t substantially by allocating materially more than 5%."


Are you looking for more strategies to read about? Check http://quantpedia.com/Screener

Do you want to see performance of trading systems we described? Check http://quantpedia.com/Chart/Performance

Do you want to know more about us? Check http://quantpedia.com/Home/About


Follow us on:

Facebook: https://www.facebook.com/quantpedia/

Twitter: https://twitter.com/quantpedia


Continue reading
Subscription Form

Subscribe for Newsletter

 Be first to know, when we publish new content
logo
The Encyclopedia of Quantitative Trading Strategies

Log in