Machine learning

Using Deep Neural Networks to Enhance Time Series Momentum

22.June 2019

A new research paper related to:

#118 – Time Series Momentum

Authors: Lim, Zohren, Roberts

Title: Enhancing Time Series Momentum Strategies Using Deep Neural Networks

Link: https://papers.ssrn.com/sol3/papers.cfm?abstract_id=3369195

Abstract:

While time series momentum is a well-studied phenomenon in finance, common strategies require the explicit definition of both a trend estimator and a position sizing rule. In this paper, we introduce Deep Momentum Networks — a hybrid approach which injects deep learning based trading rules into the volatility scaling framework of time series momentum. The model also simultaneously learns both trend estimation and position sizing in a data-driven manner, with networks directly trained by optimising the Sharpe ratio of the signal. Backtesting on a portfolio of 88 continuous futures contracts, we demonstrate that the Sharpe-optimised LSTM improved traditional methods by more than two times in the absence of transactions costs, and continue outperforming when considering transaction costs up to 2-3 basis points. To account for more illiquid assets, we also propose a turnover regularisation term which trains the network to factor in costs at run-time.

Notable quotations from the academic research paper:

"While numerous papers have investigated the use of machine learning for financial time series prediction, they typically focus on casting the underlying prediction problem as a standard regression or classification task – with regression models forecasting expected returns, and classification models predicting the direction of future price movements. This approach, however, could lead to suboptimal performance in the context time-series momentum for several reasons.

Firstly, sizing positions based on expected returns alone does not take risk characteristics into account – such as the volatility or skew of the predictive returns distribution — which could inadvertently expose signals to large downside moves. This is particularly relevant as raw momentum strategies without adequate risk adjustments, such as volatility scaling, are susceptible to large crashes during periods of market panic. Furthermore, even with volatility scaling – which leads to positively skewed returns distributions and long-option-like behaviour – trend following strategies can place more losing trades than winning ones and still be profitable on the whole – as they size up only into large but infrequent directional moves. The fraction of winning trades is a meaningless metric of performance, given that it cannot be evaluated independently from the trading style of the strategy. Similarly, high classification accuracies may not necessarily translate into positive strategy performance, as profitability also depends on the magnitude of returns in each class. In light of the deficiencies of standard supervised learning techniques, new loss functions and training methods would need to be explored for position sizing – accounting for tradeoffs between risk and reward.

In this paper, we introduce a novel class of hybrid models that combines deep learning-based trading signals with the volatility scaling framework used in time series momentum strategies – which we refer to as the Deep Momentum Networks (DMNs). This improves existing methods from several angles.

Firstly, by using deep neural networks to directly generate trading signals, we remove the need to manually specify both the trend estimator and position sizing methodology – allowing them to be learnt directly using modern time series prediction architectures.

Secondly, by utilising automatic differentiation in existing backpropagation frameworks, we explicitly optimise networks for risk-adjusted performance metrics, i.e. the Sharpe ratio, improving the risk profile of the signal on the whole.

Lastly, retaining a consistent framework with other momentum strategies also allows us to retain desirable attributes from previous works – specifically volatility scaling, which plays a critical role in the positive performance of time series momentum strategies. This consistency also helps when making comparisons to existing methods, and facilitates the interpretation of different components of the overall signal by practitioners.

performance of trading strategies

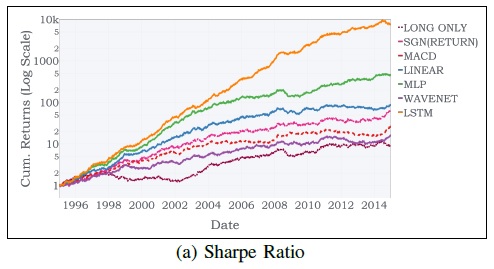
Referring to the cumulative returns plots for the rescaled portfolios in Exhibit 4, the benefits of direct outputs with Sharpe ratio optimisation can also be observed – with larger cumulative returns observed for linear, MLP and LSTM models compared to the reference benchmarks. Furthermore, we note the general underperformance of models which use standard regression and classification methods for trend estimation – hinting at the difficulties faced in selecting an appropriate position sizing function, and in optimising models to generate positions without accounting for risk."


Are you looking for more strategies to read about? Check http://quantpedia.com/Screener

Do you want to see performance of trading systems we described? Check http://quantpedia.com/Chart/Performance

Do you want to know more about us? Check http://quantpedia.com/Home/About


Follow us on:

Facebook: https://www.facebook.com/quantpedia/

Twitter: https://twitter.com/quantpedia

Youtube: https://www.youtube.com/channel/UC_YubnldxzNjLkIkEoL-FXg


Continue reading

Why Is Allocation to Trend-Following Strategy So Low?

21.February 2019

Related to all trendfollowing strategies:

Authors: Dugan, Greyserman

Title: Skew and Trend Aversion

Link: https://papers.ssrn.com/sol3/papers.cfm?abstract_id=3315719

Abstract:

Despite evidence of the benefits to portfolio Sharpe ratio and variance, actual investor allocations to Trend Following strategies are typically 5% or less. Why is there such a significant discrepancy between the optimal allocation and actual allocation to Trend? We investigate known behavioral biases as a potential reason. While decision makers have other reasons to exclude Trend Following from their portfolios, in this paper, we explore loss aversion, recency bias, and the ambiguity effect as they pertain to Trend Following, and we call the combination of the three Trend Aversion. We quantify Trend Aversion and show that these biases are a viable explanation for suboptimal allocations to Trend. We demonstrate a direct connection between quantifications of known behavioral biases and current suboptimal allocations to Trend Following. Recognition of these relationships will help highlight the pitfalls of behavioral biases.

Notable quotations from the academic research paper:

"Investors may have reasons for excluding Trend Following from their portfolios ranging from time-horizon for performance, to drawdowns, to potential capacity issues. However, the strategy's long performance history shows that a meaningful allocation would have increased portfolio Sharpe ratio and reduced portfolio variance, and yet typical investments remain at or below 5%. Some investors have no exposure.

The strategy's quantitative nature, positive skew, and frequent but small losses act in concert to trigger loss aversion, recency bias, and the ambiguity e ffect. We call the combination of the three Trend Aversion.

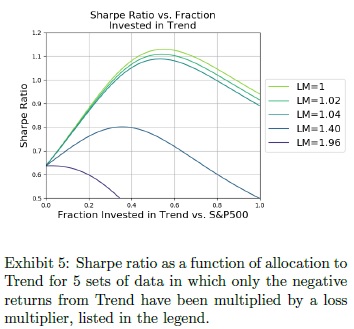
Sharpe ratio vs. Fraction invested in Trend


Our results show Trend Aversion is a viable explanation of suboptimal allocations to Trend Following. Decades of psychological research show that people mentally inflate losses by a factor of two. In this paper, we demonstrated that a loss multiplier between 1.5 and 2.5 would cause the typical allocation to Trend of 5% in a simple two asset portfolio, in an 11-asset portfolio with random allocations, and in two other 11-asset portfolio constructions with dynamic allocations. We showed that loss aversion can decrease allocators Sharpe ratios by up to 50%. Using lookback windows in a dynamically allocated portfolio, we demonstrated that recency bias drives down allocations to Trend. Finally, we showed that combinations of loss aversion and recency bias also drive Trend allocations to suboptimal levels.

Many investors who are subject to Trend Aversion as a practical matter, for example due to investment committees or reporting structures, are unsure of how to balance Trend Aversion with the bene ts of Trend Following to reach an allocation decision. By establishing a methodology to optimize allocations under loss aversion, we provide a framework which investors can use to formalize their allocation decisions. Investors who are subject to typical loss aversion should permanently allocate at least 5% to Trend Following, while investors whose loss aversion is lower can benefi t substantially by allocating materially more than 5%."


Are you looking for more strategies to read about? Check http://quantpedia.com/Screener

Do you want to see performance of trading systems we described? Check http://quantpedia.com/Chart/Performance

Do you want to know more about us? Check http://quantpedia.com/Home/About


Follow us on:

Facebook: https://www.facebook.com/quantpedia/

Twitter: https://twitter.com/quantpedia


Continue reading

Authoritarian Countries Have Inflated GDP

13.February 2019

There has been the shadow of suspicion that autocratic regimes are slightly manipulating GDP growth numbers. A recent academic paper offers interesting idea how to double check suspicious claims of growth …

Authors: Martinez

Title: How Much Should We Trust the Dictator's GDP Growth Estimates?

Link: https://papers.ssrn.com/sol3/papers.cfm?abstract_id=3093296

Abstract:

I study the manipulation of GDP growth statistics in non-democracies by comparing the self-reported GDP figures to the nighttime lights recorded by satellites from outer space. I show that the night-lights elasticity of GDP is systematically larger in more authoritarian regimes. This autocracy gradient in the elasticity is not explained by potential differences in a large set of factors, including economic structure and levels of development, across countries with different forms of government. The gradient is larger when countries have a stronger incentive to exaggerate economic performance or when the institutions that constrain the manipulation of official statistics are weaker. I estimate that the most authoritarian regimes inflate yearly GDP growth rates on average by a factor of 1.15-1.3 and show that correcting for data manipulation provides a more nuanced view on the economic success of non-democracies in recent years.

Notable quotations from the academic research paper:

"Governments themselves usually produce economic estimates, which gives rise to a moral hazard problem, as they are constantly tempted to exaggerate just how well the economy is doing. GDP stands out in this regard as perhaps the most widely used measure of economic activity. As such, it is probably the most profi table for governments to manipulate.

This paper uses nighttime luminosity to detect and measure the manipulation of GDP growth statistics in non-democracies. GDP and nighttime lights provide complementary measures of economic activity, but while GDP is self-reported by governments and prone to manipulation, night lights are recorded by satellites from outer space and are much less vulnerable. Using panel data for 179 countries between 1992 and 2008, I study the relationship between reported GDP figures and nighttime lights across political regimes. In particular, I examine whether the same amount of growth in lights translates into systematically larger amounts of GDP growth in autocracies than in democracies.

The main result of the paper is that the night-lights elasticity of GDP is signi ficantly larger in more autocratic regimes. In other words, I find that a constant amount of growth in lights translates into higher reported GDP growth in autocracies than in democracies. A large battery of further robustness tests indicates that the autocracy gradient in the night-lights elasticity of GDP is not driven by cross-country di erences in other factors that may be potentially correlated with regime type, including geography, economic structure or levels of development.

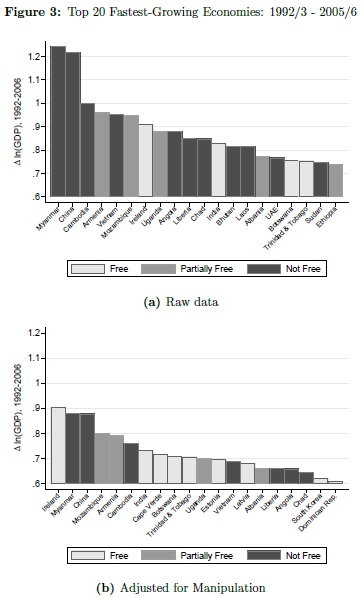
The observed magnitude of the variation in the night-lights elasticity of GDP across regimes is substantial. The results indicate that the most authoritarian governments inflate yearly GDP growth by a factor of 1.15-1.3. I use these estimates to adjust the long-run growth rates for data manipulation in autocracies. This adjustment has important implications for our understanding of relative economic performance at the turn of the XXI century.


fastest growing countries

"


Are you looking for more strategies to read about? Check http://quantpedia.com/Screener

Do you want to see an overview of our database of trading strategies? Check https://quantpedia.com/Chart

Do you want to know how we are searching new strategies? Check https://quantpedia.com/Home/How

Do you want to know more about us? Check http://quantpedia.com/Home/About


Follow us on:

Facebook: https://www.facebook.com/quantpedia/

Twitter: https://twitter.com/quantpedia

Continue reading

ETFs Increase Correlation of International Equity Markets

4.January 2019

Everybody can see that international equity markets are highly correlated (and especially during past 10-15 years). A new interesting financial research paper shows that ETF arbitrage mechanism is one of the key channels through which U.S. shocks propagate to local economies leading to increased return correlation with the U.S. market:

Authors: Filippou, Gozluklu, Rozental

Title: ETF Arbitrage and International Correlation

Link: https://papers.ssrn.com/sol3/papers.cfm?abstract_id=3287417

Abstract:

Assets under management of exchange-traded funds (ETF) have been growing significantly, yet the majority of ETF trades still occur on U.S. exchanges. We show that investment decisions of both institutional and retail investors when trading international country ETFs are mostly driven by shocks related to U.S. fundamentals, measured by VIX, rather than local country risks. Investors react only to negative news about local economies. When U.S. economic uncertainty increases, investors leave the country ETF market and switch to Cash ETF products. We demonstrate that ETF arbitrage mechanism is one of the key channels through which U.S. shocks propagate to local economies leading to increased return correlation with the U.S. market both in time-series and cross-sectional dimensions. We find that countries with stronger ETF price-discovery and lower limits to arbitrage tend to have a higher comovement with the U.S. market.

Notable quotations from the academic research paper:

"Signi ficant innovations in financial products made international investments increasingly possible. Over the recent years, exchange-traded funds experienced a double-digit growth in assets under management. Nevertheless, the short-run interdependence of trading across major international ETFs and its association with local and global risk aversion remain understudied. While the majority of earlier studies focuses on direct eff ects of ETFs on the underlying securities in the basket that it tracks, we examine the indirect e ffect of ETF trading as a transmission mechanism of U.S. market shocks to foreign country equity markets.

We provide a view that as the U.S. accommodates the largest share of ETF global trading volume, its market conditions directly impact the decisions of country ETF investors. We show that international ETF market participants trade based on shocks related to U.S. fundamentals rather than local ones, and propagate those shocks to local markets. The shock transmission is performed via ETF arbitrage. We argue that such arbitrage activity is one of the few mechanisms responsible for increasing correlation between the U.S. market and the rest of the world.

This high cross-country correlation limits the ability of investors to cheaply diversify U.S. risk via international ETF investments. In addition, ETFs often provide an easier access to less integrated emerging markets or to countries were direct investments are costly (e.g., Brazil). However, the transmission of U.S. shocks to those markets limits the diversi fication bene ts of emerging market strategies.

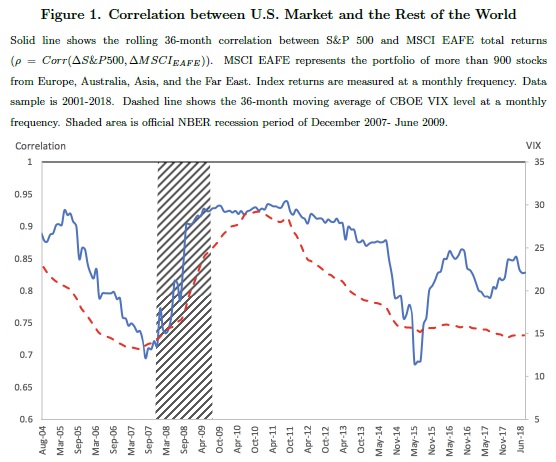
correlation

We fi rst test the hypothesis whether country ETF investors react to changes in the U.S. rather than local economic uncertainty, as measured by CBOE Volatility Index (VIX). To this end, we compute order imbalances of retail investors (e.g., Boehmer, Jones, and Zhang, 2017), and trades of di fferent size, capturing high frequency trading (HFT) and institutional trades. Focusing on a large cross-section of 41 countries, we find strong association between ETF order imbalances and U.S. VIX, indicating that international investment decisions are mainly driven by the latter measure, rather than its local counterparts. For example, an increase in the U.S. VIX results in a selling pressure in the country ETF market. Such result is robust to di fferent volatility regimes and is consistent across di fferent types of investors. Asymmetric response analysis confi rms that country ETF investors only react to positive changes in local VIX, which correspond to negative news in the local markets. Moreover, we observe that, when reacting to an increase in U.S. uncertainty, investors switch to safer assets such as cash equivalent ETFs. We also find that investors respond to changes in U.S. political uncertainty di fferently than to economic uncertainty – they leave the U.S. stock market and buy international country-level ETFs. However, they do not react to local political uncertainty and the economic eff ect of political risk is much smaller than of changes in U.S. VIX.

In order to access the impact of ETF arbitrage on correlation of country returns with the U.S. market, we regress daily innovations in such correlation on a proxy for ETF arbitrage during di fferent volatility regimes. We provide time-series evidence that during periods of high volatility in the U.S., an increase in the arbitrage activity by the authorized participant (AP) (as measured by net share creation/redemption) results in an increase in innovation in such daily correlation. We argue that during periods of high volatility in the U.S. market, it is harder for investors to distinguish between noise and fundamental component of the order flow. Consequently, based on wake-up call hypothesis investor may treat U.S. shocks as relevant to their own country and consume such shocks via ETF arbitrage.

We also explain cross-country variation in return correlation with the U.S. market. According to Ben-David, Franzoni, and Moussawi (2018), non-fundamental shocks must be reversed over time. This suggests that if all shocks transmitted from ETF market to local economies were non-fundamental, ETF arbitrage would not contribute towards increased correlation. In contrast, if the price deviation from the NAV is due to faster incorporation of fundamental information in ETF market, then arbitrage should a ffect returns of underlying index, and such e ffect should not be reverted. If such fundamental information is common both to U.S. and local market, one should observe a higher correlation between them.

Consistent with the literature, we argue that ETF transmits both fundamental and noise shocks to the underlying economies. We show that countries that have a higher degree of price discovery in their ETFs have on average a higher correlation with the U.S. market. In these markets fundamental information gets incorporated into ETF prices faster than in the Net Asset Value (NAV), and therefore, market makers closely follow and learn from changes in ETF prices. This is the case when derivative securities price the underlying assets, rather than the other way around. In addition, in order for fundamental shocks to get transmitted to underlying markets, the authorised participants (AP) must engage in arbitrage activity. We find that the lower the limits to ETF arbitrage the higher is the correlation between a country and the U.S. market. Neither the international trade channel nor the business cycles alter this result."


Are you looking for more strategies to read about? Check http://quantpedia.com/Screener

Do you want to see an overview of our database of trading strategies? Check https://quantpedia.com/Chart

Do you want to know how we are searching new strategies? Check https://quantpedia.com/Home/How

Do you want to know more about us? Check http://quantpedia.com/Home/About


Follow us on:

Facebook: https://www.facebook.com/quantpedia/

Twitter: https://twitter.com/quantpedia

Continue reading

Subscribe for Newsletter

Be first to know, when we publish new content


    logo
    The Encyclopedia of Quantitative Trading Strategies

    Log in