Machine learning

The Knowledge Graphs for Macroeconomic Analysis with Alternative Big Data

25.June 2021

There are many known relationships among macroeconomic variables in economics, while some of them are even presented as “laws”—for example, money supply and inflation or benchmark interest rates and inflation. However, the well-known economic models usually utilize only a small amount of variables. Nowadays, with the advances in machine learning and big data fields, these established models might be improved. A possible solution is presented in the research paper of Yang et al. (2020). The authors construct knowledge graphs where they connect widely recognized variables such as GDP, inflation, etc., with other more or less known variables based on the massive textual data from financial journals and research reports published by leading think tanks, consulting firms or asset management companies. With the help of advanced natural language processing, it is possible to basically “read “all the relevant published research and find the relationships among the macroeconomic variables. While this task could take years for human readers, the machine learning method can go through these texts in a much shorter time.

Continue reading

Hierarchical Risk Parity

21.February 2020

Various risk parity methodologies are a popular choice for the construction of better diversified and balanced portfolios. It is notoriously hard to predict the future performance of the majority of asset classes. Risk parity approach overcomes this shortcoming by building portfolios using only assets’ risk characteristics and correlation matrix. A new research paper written by Lohre, Rother and Schafer builds on the foundation of classical risk parity methods and presents hierarchical risk parity technique. Their method uses graph theory and machine learning to build a hierarchical structure of the investment universe. Such structure allows better division of assets into clusters with similar characteristics without relying on classical correlation analysis. These portfolios then offer better tail risk management, especially for skewed assets and style factor strategies.

Authors: Lohre, Rother and Schafer

Title: Hierarchical Risk Parity: Accounting for Tail Dependencies in Multi-Asset Multi-Factor Allocations

Continue reading

Alternative Fair-Value Models for Currency Value Strategy

17.January 2020

The idea of buying an investment asset for a lower price than a fair-value is the cornerstone of value factor strategies. Various value strategies were popularized by famous investor Benjamin Graham (and his successors like Warren Buffett) and were firstly employed in the stock market. This idea of looking for investment opportunities that can be bought cheaply can also be applied in currency markets – Currency Value Factor strategy. There is, however, one catch – an investor must know the fair-value exchange rate for currencies. The most popular equilibrium exchange rate model used for this purpose is based on PPP (purchasing power parity). A new research paper written by Ca’ Zorzi, Cap, Mijakovic, and Rubaszek analyzes two additional models – Behavioral Equilibrium Exchange Rate (BEER) and the Macroeconomic Balance (MB) approach to assess which model has the best forecasting power.

Authors: Ca’ Zorzi, Cap, Mijakovic, Rubaszek

Title: The Predictive Power of Equilibrium Exchange Rate Models

Continue reading

The CAPE Ratio and Machine Learning

10.January 2020

Professor Robert Shiller’s work and his famous CAPE (cyclically-adjusted price-to-earnings) ratio is well known among the investment community. His methodology for assessing a valuation of the U.S. equity market is not the first one but is surely the most cited and the most discussed. There are numerous papers that tweak or adjust Shiller’s methodology to assess better if U.S. equities are under- or over-valued. We recommend the work of Wang, Ahluwalia, Aliaga-Diaz, and Davis (all from The Vanguard Group ) in which they use a combination of machine learning and a regression-based approach to obtain forecasted CAPE ratio, and subsequently, U.S. stock market returns, more accurately.

Authors: Wang, Ahluwalia, Aliaga-Diaz, Davis

Title: The Best of Both Worlds: Forecasting US Equity Market Returns using a Hybrid Machine Learning – Time Series Approach

Continue reading

Using Deep Neural Networks to Enhance Time Series Momentum

22.June 2019

A new research paper related to:

#118 – Time Series Momentum

Authors: Lim, Zohren, Roberts

Title: Enhancing Time Series Momentum Strategies Using Deep Neural Networks

Link: https://papers.ssrn.com/sol3/papers.cfm?abstract_id=3369195

Abstract:

While time series momentum is a well-studied phenomenon in finance, common strategies require the explicit definition of both a trend estimator and a position sizing rule. In this paper, we introduce Deep Momentum Networks — a hybrid approach which injects deep learning based trading rules into the volatility scaling framework of time series momentum. The model also simultaneously learns both trend estimation and position sizing in a data-driven manner, with networks directly trained by optimising the Sharpe ratio of the signal. Backtesting on a portfolio of 88 continuous futures contracts, we demonstrate that the Sharpe-optimised LSTM improved traditional methods by more than two times in the absence of transactions costs, and continue outperforming when considering transaction costs up to 2-3 basis points. To account for more illiquid assets, we also propose a turnover regularisation term which trains the network to factor in costs at run-time.

Notable quotations from the academic research paper:

"While numerous papers have investigated the use of machine learning for financial time series prediction, they typically focus on casting the underlying prediction problem as a standard regression or classification task – with regression models forecasting expected returns, and classification models predicting the direction of future price movements. This approach, however, could lead to suboptimal performance in the context time-series momentum for several reasons.

Firstly, sizing positions based on expected returns alone does not take risk characteristics into account – such as the volatility or skew of the predictive returns distribution — which could inadvertently expose signals to large downside moves. This is particularly relevant as raw momentum strategies without adequate risk adjustments, such as volatility scaling, are susceptible to large crashes during periods of market panic. Furthermore, even with volatility scaling – which leads to positively skewed returns distributions and long-option-like behaviour – trend following strategies can place more losing trades than winning ones and still be profitable on the whole – as they size up only into large but infrequent directional moves. The fraction of winning trades is a meaningless metric of performance, given that it cannot be evaluated independently from the trading style of the strategy. Similarly, high classification accuracies may not necessarily translate into positive strategy performance, as profitability also depends on the magnitude of returns in each class. In light of the deficiencies of standard supervised learning techniques, new loss functions and training methods would need to be explored for position sizing – accounting for tradeoffs between risk and reward.

In this paper, we introduce a novel class of hybrid models that combines deep learning-based trading signals with the volatility scaling framework used in time series momentum strategies – which we refer to as the Deep Momentum Networks (DMNs). This improves existing methods from several angles.

Firstly, by using deep neural networks to directly generate trading signals, we remove the need to manually specify both the trend estimator and position sizing methodology – allowing them to be learnt directly using modern time series prediction architectures.

Secondly, by utilising automatic differentiation in existing backpropagation frameworks, we explicitly optimise networks for risk-adjusted performance metrics, i.e. the Sharpe ratio, improving the risk profile of the signal on the whole.

Lastly, retaining a consistent framework with other momentum strategies also allows us to retain desirable attributes from previous works – specifically volatility scaling, which plays a critical role in the positive performance of time series momentum strategies. This consistency also helps when making comparisons to existing methods, and facilitates the interpretation of different components of the overall signal by practitioners.
performance of trading strategies

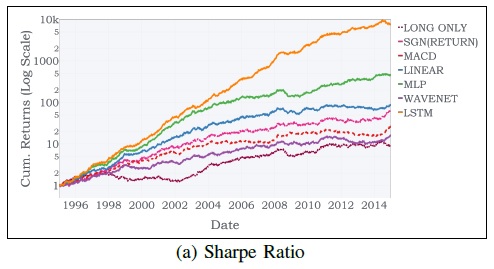
Referring to the cumulative returns plots for the rescaled portfolios in Exhibit 4, the benefits of direct outputs with Sharpe ratio optimisation can also be observed – with larger cumulative returns observed for linear, MLP and LSTM models compared to the reference benchmarks. Furthermore, we note the general underperformance of models which use standard regression and classification methods for trend estimation – hinting at the difficulties faced in selecting an appropriate position sizing function, and in optimising models to generate positions without accounting for risk."


Are you looking for more strategies to read about? Check http://quantpedia.com/Screener

Do you want to see performance of trading systems we described? Check http://quantpedia.com/Chart/Performance

Do you want to know more about us? Check http://quantpedia.com/Home/About


Follow us on:

Facebook: https://www.facebook.com/quantpedia/

Twitter: https://twitter.com/quantpedia

Youtube: https://www.youtube.com/channel/UC_YubnldxzNjLkIkEoL-FXg


Continue reading

Why Is Allocation to Trend-Following Strategy So Low?

21.February 2019

Related to all trendfollowing strategies:

Authors: Dugan, Greyserman

Title: Skew and Trend Aversion

Link: https://papers.ssrn.com/sol3/papers.cfm?abstract_id=3315719

Abstract:

Despite evidence of the benefits to portfolio Sharpe ratio and variance, actual investor allocations to Trend Following strategies are typically 5% or less. Why is there such a significant discrepancy between the optimal allocation and actual allocation to Trend? We investigate known behavioral biases as a potential reason. While decision makers have other reasons to exclude Trend Following from their portfolios, in this paper, we explore loss aversion, recency bias, and the ambiguity effect as they pertain to Trend Following, and we call the combination of the three Trend Aversion. We quantify Trend Aversion and show that these biases are a viable explanation for suboptimal allocations to Trend. We demonstrate a direct connection between quantifications of known behavioral biases and current suboptimal allocations to Trend Following. Recognition of these relationships will help highlight the pitfalls of behavioral biases.

Notable quotations from the academic research paper:

"Investors may have reasons for excluding Trend Following from their portfolios ranging from time-horizon for performance, to drawdowns, to potential capacity issues. However, the strategy's long performance history shows that a meaningful allocation would have increased portfolio Sharpe ratio and reduced portfolio variance, and yet typical investments remain at or below 5%. Some investors have no exposure.

The strategy's quantitative nature, positive skew, and frequent but small losses act in concert to trigger loss aversion, recency bias, and the ambiguity e ffect. We call the combination of the three Trend Aversion.

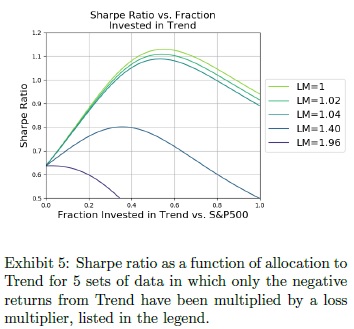
Sharpe ratio vs. Fraction invested in Trend


Our results show Trend Aversion is a viable explanation of suboptimal allocations to Trend Following. Decades of psychological research show that people mentally inflate losses by a factor of two. In this paper, we demonstrated that a loss multiplier between 1.5 and 2.5 would cause the typical allocation to Trend of 5% in a simple two asset portfolio, in an 11-asset portfolio with random allocations, and in two other 11-asset portfolio constructions with dynamic allocations. We showed that loss aversion can decrease allocators Sharpe ratios by up to 50%. Using lookback windows in a dynamically allocated portfolio, we demonstrated that recency bias drives down allocations to Trend. Finally, we showed that combinations of loss aversion and recency bias also drive Trend allocations to suboptimal levels.

Many investors who are subject to Trend Aversion as a practical matter, for example due to investment committees or reporting structures, are unsure of how to balance Trend Aversion with the bene ts of Trend Following to reach an allocation decision. By establishing a methodology to optimize allocations under loss aversion, we provide a framework which investors can use to formalize their allocation decisions. Investors who are subject to typical loss aversion should permanently allocate at least 5% to Trend Following, while investors whose loss aversion is lower can benefi t substantially by allocating materially more than 5%."


Are you looking for more strategies to read about? Check http://quantpedia.com/Screener

Do you want to see performance of trading systems we described? Check http://quantpedia.com/Chart/Performance

Do you want to know more about us? Check http://quantpedia.com/Home/About


Follow us on:

Facebook: https://www.facebook.com/quantpedia/

Twitter: https://twitter.com/quantpedia


Continue reading

Subscribe for Newsletter

Be first to know, when we publish new content


    logo
    The Encyclopedia of Quantitative Trading Strategies

    Log in