The Knowledge Graphs for Macroeconomic Analysis with Alternative Big Data
There are many known relationships among macroeconomic variables in economics, while some of them are even presented as “laws”—for example, money supply and inflation or benchmark interest rates and inflation. However, the well-known economic models usually utilize only a small amount of variables. Nowadays, with the advances in machine learning and big data fields, these established models might be improved. A possible solution is presented in the research paper of Yang et al. (2020). The authors construct knowledge graphs where they connect widely recognized variables such as GDP, inflation, etc., with other more or less known variables based on the massive textual data from financial journals and research reports published by leading think tanks, consulting firms or asset management companies. With the help of advanced natural language processing, it is possible to basically “read “all the relevant published research and find the relationships among the macroeconomic variables. While this task could take years for human readers, the machine learning method can go through these texts in a much shorter time.
Moreover, the usage of the knowledge graphs is shown in a forecasting problem of either inflation or investment. As the paper shows, the knowledge graphs could be utilized for variable selection with the ability to find alternative and novel relationships. Lastly, the forecasts based on knowledge graphs are also compared to the more traditional “baseline “approach, and authors compare the methods on both short and long-term forecasting periods.
Authors: Yucheng Yang, Yue Pang, Guanhua Huang and Weinan E
Title: The Knowledge Graph for Macroeconomic Analysis with Alternative Big Data
Link: https://arxiv.org/abs/2010.05172
Abstract:
The current knowledge system of macroeconomics is built on interactions among a small number of variables, since traditional macroeconomic models can mostly handle a handful of inputs. Recent work using big data suggests that a much larger number of variables are active in driving the dynamics of the aggregate economy. In this paper, we introduce a knowledge graph (KG) that consists of not only linkages between traditional economic variables but also new alternative big data variables. We extract these new variables and the linkages by applying advanced natural language processing (NLP) tools on the massive textual data of academic literature and research reports. As one example of the potential applications, we use it as the prior knowledge to select variables for economic forecasting models in macroeconomics. Compared to statistical variable selection methods, KG-based methods achieve significantly higher forecasting accuracy, especially for long run forecasts.
As always we present several interesting figures:
Notable quotations from the academic research paper:
“The whole knowledge system of macroeconomics is built on our understanding of the interactions among these small number of variables. With the rise of big data and machine learning, we now have the opportunity to develop more sophisticated models with a much larger number of variables (McCracken and Ng, 2016; Coulombe et al., 2019). In order to do this effectively, a new knowledge system is needed to describe both the statistical and structural relationships of the traditional as well as the many new economic variables.
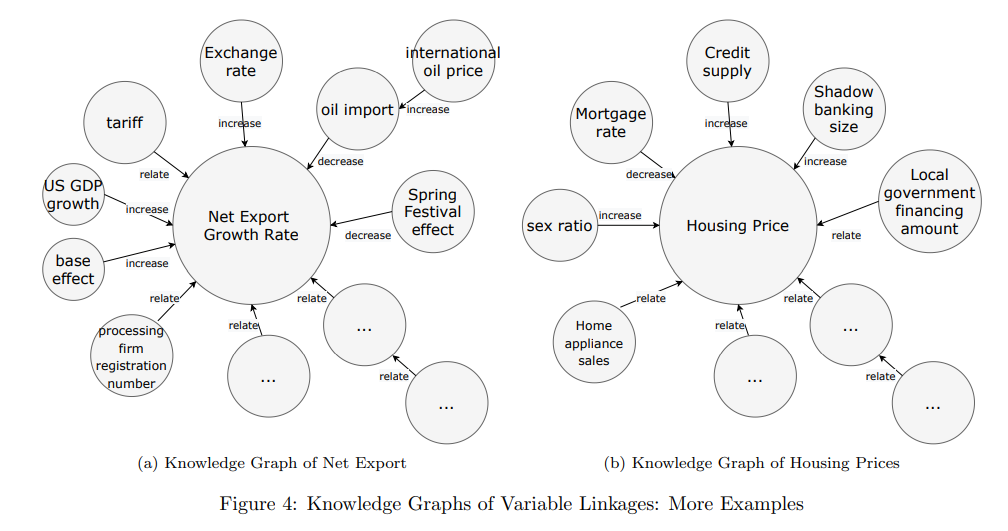
We design an algorithm to extract from massive textual data (1) traditional variables of interest (like GDP, inflation rate, housing price, etc.), (2) alternative data variables (like electricity usage, migration flow, etc.), as well as (3) the relationships (positive correlation, negative correlation, etc.) among these variables. After some post-processing including resolving coreferences, we build a knowledge graph by starting with traditional variable of interests as the centers, and expanding in a step-wise fashion to include the relevant alternative variables.
| Do you want to test these ideas yourself? We offer our readers Historical Trading Data Discounts. |
The knowledge graph we construct provides a new knowledge system for macroeconomics, and has many potential applications. One application we are particularly interested in is to formulate macroeconomics as a problem of reinforcement learning (RL) (Sutton and Barto, 2018; Silver et al., 2016). A RL framework consists of the following essential components: the state space and the environment, the action space, the system dynamics and the reward functions. In this regard, the knowledge graph of linkages among economic variables plays the role of the state space and the environment.
In this paper, we also apply the knowledge graph of economic variables
to a simple but more concrete task: variable selection in economic forecasting. Different from previous work using statistical tools to do variable selection, we use the knowledge graph as the prior knowledge to select variables for economic forecasting models. We will see that compared to statistical methods, the KG-based method achieves significantly higher forecasting accuracy, especially for long term forecasts.
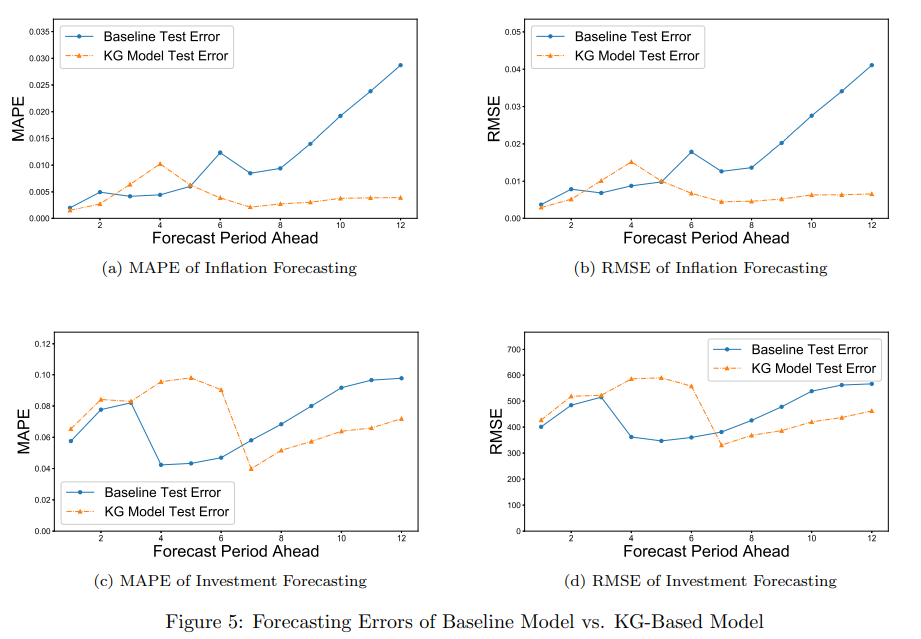
For different forecasting periods (from one month to 12 months), the forecasting errors on the test sets for both the baseline model and KG-based model are presented in Figure 5. We report the mean absolute percentage error (MAPE) in the left panels, and the root mean squared error (RMSE) in the right panels, and the results are qualitatively the same. For inflation forecasting (upper panels), compared to the baseline model, the KG-based model achieves higher forecasting accuracy in general. In short term forecasting (within five months), the forecasting errors for both models are comparable to each other, and the baseline model even outperforms the KG-based model in some horizons. However, in long run forecasting, the performance of the baseline model gets worse, while the KG-based model achieves a stable and much higher accuracy than the baseline method. Similar arguments also hold for nominal investment forecasting. The general trend revealed by Figure 5 are consistent with our expectation that short term forecasting relies more on data, while long term forecasting relies more on capturing the underlying logic in the problem. The baseline model is more of a pure data-driven model, whereas the KG-based model tries to capture the underlying logic. The better long term performance of the KG-based model serves as a confirmation that the relationships described in the knowledge graph correctly represents the true logic of the economic system under investigation.”
Are you looking for more strategies to read about? Sign up for our newsletter or visit our Blog or Screener.
Do you want to learn more about Quantpedia Premium service? Check how Quantpedia works, our mission and Premium pricing offer.
Do you want to learn more about Quantpedia Pro service? Check its description, watch videos, review reporting capabilities and visit our pricing offer.
Do you want algorithmic access to the full Quantpedia database via the API? Subscribe to Quantpedia Pro, ask for an API key, and explore the in/out-of-sample statistics, source academic papers, and code snippets — ideal for quantitative research, systematic trading workflows, and AI model training.
Are you looking for historical data or backtesting platforms? Check our list of Algo Trading Discounts.
Or follow us on:
Facebook Group, Facebook Page, Telegram, Twitter, Linkedin, Medium or Youtube
Share onLinkedInTwitterFacebookRefer to a friend


