A new interesting financial research paper gives an idea to build a diversified portfolio of leveraged ETFs (scaled down to have the same risk as a benchmark asset allocation built from a non-leveraged ETFs) to beat benchmark asset allocation. However, caution is needed as the most of the outperformance is due to inherent leveraged position in bonds because excess ratio of cash in portfolio (which is the result of using leveraged ETFs instead of non-leveraged ETFs) is invested in a short to medium term bonds:
Authors: Trainor, Chhachhi, Brown
Title: A Portfolio of Leveraged Exchange Traded Funds
Link: https://papers.ssrn.com/sol3/papers.cfm?abstract_id=3272486
Abstract:
Leveraged exchange traded funds (LETFs) are marketed as short-term trading vehicles that magnify the daily returns of an underlying index. With the proliferation of LETFs over the last 10 years, a diversified portfolio that mimics the returns of a 100% investment can be created using only a fraction of the investor’s wealth. Results suggest a portfolio created with LETFs outperforms a portfolio using traditional ETFs by approximately 0.6% to 1.4% annually by investing the excess wealth in a diversified or short to mid-duration bond portfolio. Downside risk is reduced using LETFs because the majority of the LETF portfolio is invested in a relatively safe bond fund.
Notable quotations from the academic research paper:
"Leveraged exchange traded funds (LETFs) were first listed in 2006 by Proshares, although leveraged mutual funds have been around since 1993. Although Proshares introduced +/- 2x products, Direxion upped the leverage ante with +/- 3x funds in late 2008. Because LETFs are designed to return a daily multiple, the constant daily leverage results in uncertain realized leverage over longer periods of time. In general, realized leverage tends to fall over time due to the volatility of returns.
With the expanded scope of the LETF market, it is now possible to create a diversified portfolio of LETFs that mimic a typical investor’s portfolio. By using 2x or even 3x funds, only a fraction of the investor’s portfolio is needed to attain the same exposure an investor has using standard ETFs and/or mutual funds. The downside is the higher expense ratios of LETFs, their internal financing costs, general leverage decay, and trading costs due to needed rebalancing to maintain the correct exposure. The upside is the excess wealth available that can be invested in relatively safe assets, and if the return to the invested excess wealth exceeds the higher cost of LETFs, returns should be enhanced.
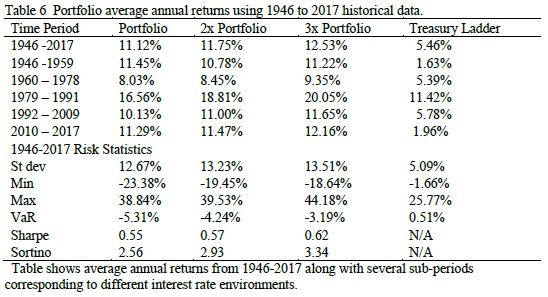
This study shows a portfolio using 2x or 3x LETFs outperforms a portfolio using standard ETFs based on the same underlying indexes. This is possible since a 2x needs only 50% while a 3x needs only 33% of the wealth to create the same exposure to the underlying indexes. Even in the low interest environment from 2010-17, a portfolio of 2x LETFs outperforms a portfolio of standard ETFs by 0.9% annually. A portfolio of 3x LETFs outperforms by 1.8% annually.
Simulated LETF returns since 1946 show a portfolio of 2x LETFs can be expected to outperform a standard portfolio by 0.6% while a 3x LETFs outperforms by 1.4% after expenses. The caveat to this strategy is LETF portfolios must be rebalanced as their initial positions deviate from “optimal” asset allocations even faster than standard portfolios. A 10% barrier threshold keeps the risk exposure within reasonable bounds while keeping 2x rebalancing requirements to roughly each quarter and 3x to approximately monthly.
A critical determinant of the success of this strategy is the magnitude of returns to the capital not invested in the LETFs. This study assumes excess capital is invested in a short-term bond ladder and if the return to this ladder exceeds the borrowing cost from the implied leverage of LETFs and their higher expense ratios, LETF portfolios outperform. Historically, this occurs the majority of the time with 0.6% to 1.4% average annual outperformance with a simultaneous reduction in downside risk."
Are you looking for more strategies to read about? Check http://quantpedia.com/Screener
Do you want to see an overview of our database of trading strategies? Check https://quantpedia.com/Chart
Do you want to know how we are searching new strategies? Check https://quantpedia.com/Home/How
Do you want to know more about us? Check http://quantpedia.com/Home/About
Follow us on:
Facebook: https://www.facebook.com/quantpedia/
Twitter: https://twitter.com/quantpedia
Share onLinkedInTwitterFacebookRefer to a friend


