Value

Two Versions of CAPM

19.July 2019

This week's analysis of selected financial research paper contains more text and no picture, but we still think it's worth reading …

Authors: Siddiqi

Title: CAPM: A Tale of Two Versions

Link: https://papers.ssrn.com/sol3/papers.cfm?abstract_id=3350280

Abstract:

Given that categorization is the core of cognition, we argue that investors do not view firms in isolation. Rather, they view them within a framework of categories that represent prior knowledge. This involves sorting a given firm into a category and using categorization-induced inferences to form earnings and discount-rate expectations. If earnings-aspect is categorization-relevant, then earnings estimates are refined, whereas discount-rates are confounded with the category-exemplar. The opposite happens when discount-rates are categorization relevant. Earnings-focused approach such as DCF, generally used by institutional investors, leads to a version of CAPM in which the relationship between average excess return and stock beta is flat (possibly negative). Value effect and size premium (controlling for quality) arise in this version. Discount-rate focused approach such as multiples or comparables valuation, typically used by individual investors, leads to a second version in which the relationship is strongly positive with growth stocks doing better. The two-version CAPM accounts for several recent empirical findings including fundamentally different intraday vs overnight behavior, as well as behavior on macroeconomic announcement days. Momentum is expected to be an overnight phenomenon, which is consistent with empirical findings. We argue that, perhaps, our best shot at observing classical CAPM in its full glory is a laboratory experiment with subjects who have difficulty categorizing (such as in autism spectrum disorders).

Notable quotations from the academic research paper:

"Consider the following two empirical observations:

Firstly, stock prices behave very differently with respect to their sensitivity to market risk (beta) at specific times. Typically, average excess return and beta relationship is flatter than expected. It could even be negative. However, during specific times, this relationship is strongly positive, such as on days when macroeconomic announcements are made or during the night.

Secondly, a hue, which is halfway between yellow and orange, is seen as yellow on a banana and orange on a carrot. In this article, we argue that the two observations are driven by the same underlying mechanism.

The second observation is an example of the implications of categorization for color calibration. In this article, we argue that the first observation is also due to categorization, which gives rise to two versions of CAPM. In one version, the relationship between expected return and stock beta is flatter than expected or could even be negative, whereas in the second version, this relationship is strongly positive.

Categorization is the mental operation by which brain classifies objects and events. We do not experience the world as a series of unique events. Rather, we make sense of our experiences within a framework of categories that represent prior knowledge. That is, new information is only understood in the context of prior knowledge.

Here, in accord with cognitive science literature, we present a view of categorization that has both an upside as well as a downside, and apply this nuanced perspective to the capital asset pricing model (CAPM). If categorization is fundamental to how our brains make sense of information, then investor behavior, like any other domain of human behaviour, should also be viewed through this lens. This means that the traditional view that each firm is viewed in isolation needs to be altered. When an investor considers a firm, she views it within a framework of categories that represent prior knowledge. This involves sorting a given firm into a category based on attributes that are deemed categorization-relevant. Categorization-induced inferences help refine such attributes while confounding categorization-irrelevant attributes with the category-exemplar.

Valuation requires estimating earnings (cash-flows) potential and estimating discount-rates. Even among firms that sell similar products (same sector) some may have more similar earnings potential, whereas other may have more similar discount-rates. The former type may include firms with similar earnings-related fundamentals but very different levels of debt ratio and equity betas. Also, their multiples (generally related to inverse of the discount-rate) such as P/E, EV/Sales or EV/EBITDA could be very different. The latter type may include firms with similar debt ratios and equity betas or similar P/E and EV/EBITDA but quite different earnings or cash-flows fundamentals.

We argue that, an earnings-focused approach, such as discounted cash-flows (DCF), tends to categorize the former type of firms together, whereas, the relative valuation approach (RV) based on multiples such as P/E or EV/EBITDA tends to categorize the latter types of firms together. In other words, the choice of a valuation approach introduces a bias in how firms are categorized.

In this paper, we take discounted cash-flows (DCF) as the prototype of an earnings-potential focused approach, and valuation by multiples or relative valuation (RV) as the prototype discount-rate focused approach.

We show that when earnings aspect is categorization-relevant (as in DCF analysis), a version of CAPM is obtained, which displays a flatter or even negative relationship between stock beta and expected excess returns. Betting-against-beta anomaly is observed along with the value effect, as well as the size premium after controlling for quality (consistent with the findings in Asness et al 2018). We argue that this is the default version which typically prevails. While categorizing firms, if investors are focused on the discount rate aspect (as in RV analysis), then the discount-rates are refined whereas earnings estimates are confounded with the category-exemplar. A second version of CAPM arises. In this version, there is a strong positive relationship between beta and expected excess return.

One way to make sense of the co-existence of two versions is to classify investors as either earnings-focused or discount rate-focused. If earnings-focused investors dominate, then the first version is observed. If the discount-rate-focused investors dominate, then the second version is observed. Note, that earnings-focused approach (such as DCF) is typically employed by large institutional investors, whereas RV approach is associated with individual investors (and with sell-side equity analysts who publish research reports for individual investors).

If institutional investors are earnings-focused and individual investors are discount rate-focused, then the trading behavior of each type can be observed to make specific predictions:

1) Institutional investors typically avoid trading at the open and prefer to trade in the afternoon near the market close. The objective is to time the trade when the market is most liquid to avoid any adverse price impact. This means that trade at open is dominated by individual investors. So, one expects to see the relationship between stock beta and average return to be strongly positive (second version) overnight and flat or even negative (first version) intraday.

2) Institutional traders typically trade in the right direction prior to macroeconomic announcement days (suggesting superior information) with institutional trading volume falling sharply on macro-announcement days. As trade on such days is dominated by individual investors, one expects to see a strongly positive relationship (second version) on macro-announcement days.

3) The first version generally dominates intraday due to institutional investors being dominant. As the corresponding CAPM version comes with size and value effects, the prediction is that size and value are primarily intraday phenomena.

4) We show that, all else equal, discount rate-focused investors have higher willingness-to-pay than earnings-focused investors. If discount rate-focused investors dominate trade at open, whereas earnings-focused investors are active intraday, then one expects prices to typically rise overnight from close-to-open and fall intraday between open-to-close.

5) If momentum traders, who buy past winners and short past losers, are primarily individual investors, then one expects momentum to be an overnight phenomenon observed between close-to-open. This is because individual traders dominate trade at or near open.

"


Are you looking for more strategies to read about? Check http://quantpedia.com/Screener

Do you want to see performance of trading systems we described? Check http://quantpedia.com/Chart/Performance

Do you want to know more about us? Check http://quantpedia.com/Home/About


Follow us on:

Facebook: https://www.facebook.com/quantpedia/

Twitter: https://twitter.com/quantpedia

Youtube: https://www.youtube.com/channel/UC_YubnldxzNjLkIkEoL-FXg


Continue reading

Equity Factor Strategies In Frontier Markets

12.July 2019

A new research paper related to all equity factor strategies …

Authors: Zaremba, Maydybura, Czapkiewicz, Arnaut

Title: Explaining Equity Anomalies In Frontier Markets: A Horserace of Factor Pricing Models

Link: https://papers.ssrn.com/sol3/papers.cfm?abstract_id=3378785

Abstract:

We are the first to compare the explanatory power of the major empirical asset pricing models over equity anomalies in the frontier markets. We replicate over 160 stock market anomalies in 23 frontier countries for years 1996–2017, and evaluate their performance with the factor models. The Carhart’s (1997) four-factor model outperforms both the recent Fama and French (2015) five-factor model and the q-model by Hou, Xue, and Zhang (2015). Its superiority is driven by the ability to explain the momentum-related anomalies. Inclusion of additional profitability and investment factors lead to no further major improvement in the performance. Nonetheless, none of the models is able to fully explain the abnormal returns on all of the anomaly portfolios.

Notable quotations from the academic research paper:

"In times of soaring correlations among global stocks and increasing controversies on anomaly performance in emerging stock markets, one specific asset class may offer a remedy: frontier equities. Deemed the least developed emerging markets, the frontier countries are scattered around the globe, with presence in Africa, Asia, Europe, and Latin America. Being very diverse both economically and geographically, they range from the wealthy oil-producing kingdoms in the Gulf to some of the poorest countries in Africa. While the current size of the frontier stock markets is still fairly small – the total capitalization of the MSCI Frontier Market Index constituents equaled $134 billion in May 2018 (MSCI, 2018), accounting for less than 0.4% of developed markets – yet, the interest in them is growing quickly.

Considering the future potential, along with the soaring interest of the international community, and the investment opportunities, it is surprising how underresearched – if not ignored – the frontier equities are. The number of academic studies on this stock market class seems astonishingly modest. This leaves numerous important questions, which may be of huge importance for global investors, unanswered. Which equity anomalies – discovered originally in developed countries – work also in the frontier stock markets? Could they be translated into profitable strategies using easily-to-implement quantitative methods? Finally, which asset pricing models and factors best summarize the cross-sectional return patterns and the equity anomalies in frontier countries? Could the recent five-factor framework by Fama and French (2015) or the q-model by Hou, Xue, and Zhang (2015) be also applied in this growing asset class? The principal target of this study is to close this gap in the existing body of literature at least partially.

Research sample

The elevated liquidity constraints, higher trading costs, short sale unavailability accompanied by less sophisticated investors may potentially result in larger mispricing and more pronounced stock market anomalies.

Our research aims to contribute in three primary ways. Our first goal is to conduct the most comprehensive test on which equity anomalies, discovered originally in the developed countries, are also present in the frontier equities. Thus, we examine the performance of 167 anomalies from the finance literature, encompassing different classes of patterns related to value, trend following, investment, profitability, risk, and many others. The large-scale analysis available in broadly-accessible journals was either limited to the few most prominent strategies, such as size, value, and momentum (Blackburn and Cakici 2017, De Groot, Pang, and Swinkels 2012). Our study aims to take a substantial leap forward in understanding the multidimensionality of equity returns in the frontier markets.

Second, we research which of the broadly-acknowledged asset pricing models serve best in explaining the cross-section of anomaly returns in the frontier markets. In particular, we consider seven factor pricing models: the capital asset pricing model (Sharpe 1964), abbreviated CAPM, the three-factor model (Fama and French 1993), abbreviated FF3, the four-factor model (Carhart 1997), abbreviated C4, the five-factor model (Fama and French 2015), abbreviated FF5, the q-model by Hou, Xue, and Zhang (2015), the six-factor model by Fama and French (2018), abbreviated FF6, and the six-factor model by Barillas and Shanken (2018), abbreviated BS6.

Last but not least, our research may be regarded as a large out-of-sample test of equity anomalies.

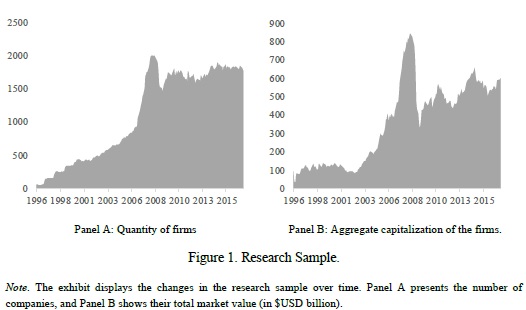
To answer our research questions, we replicate the 167 equity anomalies from Zaremba et al. (2018) in an extensive sample of over 3,600 companies from frontier markets from all over the world for years 1996 – 2017. We form the long-short anomaly portfolios and evaluate their returns using the seven considered factor pricing models: CAPM, FF3, C4, FF5, Q4, FF6, and BS6. We compare the models’ performance by employing a range of tools and statistics that assess their ability to explain the risk and mean returns jointly.

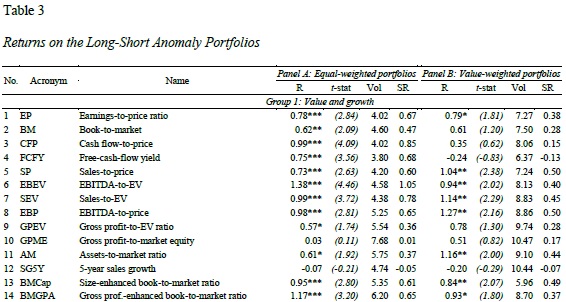
The principal findings of this study could be summarized as follows. First, out of the 167 anomaly portfolios, only 38% (19%) of the equal-weighted (value-weighted) long-short strategies produce profits significantly departing from zero at the 5% level. The successful return patterns are usually linked to the “value vs. growth” or trend following effects, verifying positively the arguments of Asness, Moskowitz, and Pedersen (2013) that value and momentum are everywhere.

Second, we demonstrate that Carhart’s (1997) four-factor model best explains the anomaly returns in frontier markets, outperforming other models in many ways. It displays lower average absolute intercepts and largest number of explained anomalies. Its cross-sectional and time-series R2 is higher CAPM, FF3, FF5, or Q4, and only marginally lower than in the case of FF6 and BS6.

Returns of long short portfolios

"


Are you looking for more strategies to read about? Check http://quantpedia.com/Screener

Do you want to see performance of trading systems we described? Check http://quantpedia.com/Chart/Performance

Do you want to know more about us? Check http://quantpedia.com/Home/About


Follow us on:

Facebook: https://www.facebook.com/quantpedia/

Twitter: https://twitter.com/quantpedia

Youtube: https://www.youtube.com/channel/UC_YubnldxzNjLkIkEoL-FXg


Continue reading

The Impact of Crowding on Alternative Risk Premiums

17.May 2019

Related to all factor strategies …

Author: Baltas

Title: The Impact of Crowding in Alternative Risk Premia Investing

Link: https://papers.ssrn.com/sol3/papers.cfm?abstract_id=3360350

Abstract:

Crowding is a major concern for investors in the alternative risk premia space. By focusing on the distinct mechanics of various systematic strategies, we contribute to the discussion with a framework that provides insights on the implications of crowding on subsequent strategy performance. Understanding such implications is key for strategy design, portfolio construction, and performance assessment. Our analysis shows that divergence premia, like momentum, are more likely to underperform following crowded periods. Conversely, convergence premia, like value, show signs of outperformance as they transition into phases of larger investor flows.

Notable quotations from the academic research paper:

"Crowding risk is listed as one of the most important impediments for investing in alternative risk premia. We contribute to this industry debate by exploring the mechanics of the various ARP in the event of investor flows, and study the implications of crowdedness on subsequent performance.

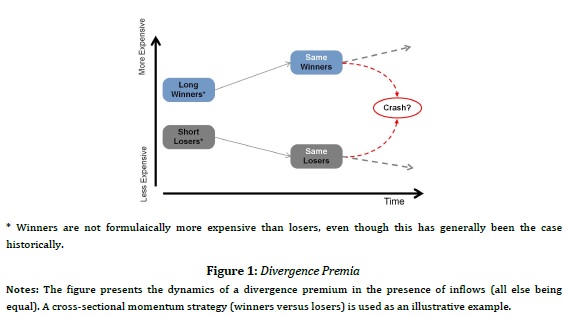
The cornerstone of our methodology is the classification of the ARP strategies into divergence and convergence premia. Divergence premia, like momentum, lack a fundamental anchor and inherently embed a self-reinforcing mechanism (e.g. in momentum, buying outperforming assets, and selling underperforming ones). This lack of a fundamental anchor creates the coordination problem that Stein (2009) describes, which can ultimately have a destabilising effect.

Divergence factor

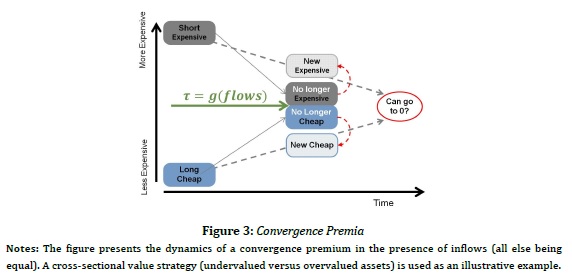
Conversely, convergence premia, like value, embed a natural anchor (e.g. the valuation spread between undervalued and overvalued assets) that acts as an self-correction mechanism (as undervalued assets are no longer undervalued if overbought). Extending Stein’s (2009) views, such dynamics suggest that investor flows are actually likely to have a stabilising effect for convergence premia.

Convergence premia

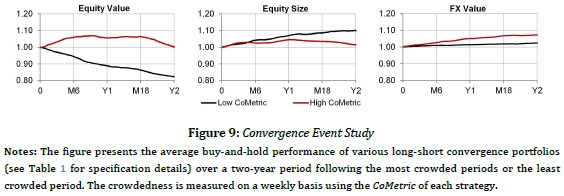
In order to test these hypotheses we use the pairwise correlation of factor-adjusted returns of assets in the same peer group (outperforming assets, undervalued assets and so on so forth) as a metric for crowding.

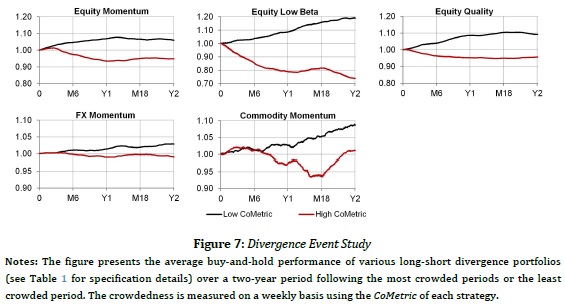
We provide empirical evidence in line with these hypotheses. Divergence premia within equity, commodity and currency markets are more likely to underperform following crowded periods.

All divergence premias

Whereas convergence premia show signs of outperformance as they transition into phases of higher investor flows.

All convergence premias"


Are you looking for more strategies to read about? Check http://quantpedia.com/Screener

Do you want to see performance of trading systems we described? Check http://quantpedia.com/Chart/Performance

Do you want to know more about us? Check http://quantpedia.com/Home/About


Follow us on:

Facebook: https://www.facebook.com/quantpedia/

Twitter: https://twitter.com/quantpedia


Continue reading

Two Centuries of Global Factor Premiums

7.March 2019

Related to all major factor strategies (trend, momentum, value, carry, seasonality and low beta/volatility):

Authors: Baltussen, Swinkels, van Vliet

Title: Global Factor Premiums

Link: https://papers.ssrn.com/sol3/papers.cfm?abstract_id=3325720

Abstract:

We examine 24 global factor premiums across the main asset classes via replication and new-sample evidence spanning more than 200 years of data. Replication yields ambiguous evidence within a unified testing framework with methods that account for p-hacking. The new-sample evidence reveals that the large majority of global factors are strongly present under conservative p-hacking perspectives, with limited out-of-sample decay of the premiums. Further, utilizing our deep sample, we find global factor premiums to be not driven by market, downside, or macroeconomic risks. These results reveal strong global factor premiums that present a challenge to asset pricing theories.

Notable quotations from the academic research paper:

"In this paper we study global factors premiums over a long and wide sample spanning the recent 217 years across equity index (but not single securities), bond, currency, and commodity markets.

The first objective of this study is to robustly and rigorously examine these global factor premiums from the perspective of ‘p-hacking’.

We take as our starting point the main global return factors published in the Journal of Finance and the Journal of Financial Economics during the period 2012-2018: time-series momentum (henceforth ‘trend’), cross-sectional momentum (henceforth ‘momentum’), value, carry, return seasonality and betting-against-beta (henceforth ‘BAB’). We examine these global factors in four major asset classes: equity indices, government bonds, commodities and currencies, hence resulting in a total of 24 global return factors.4

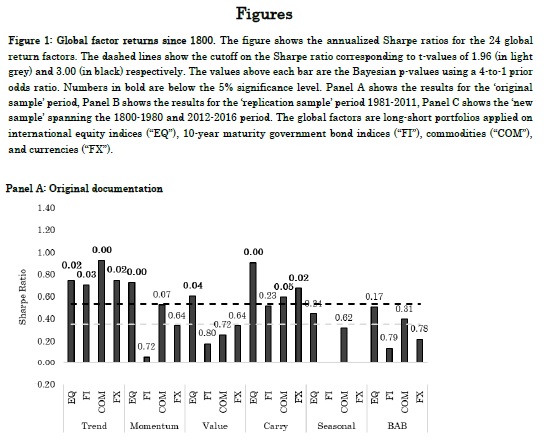
We work from the idea that these published factor premiums could be influenced by p-hacking and that an extended sample period is useful for falsification or verification tests. Figure 1, Panel A summarizes the main results of these studies.

Global factor strategies

Shown are the reported Sharpe ratio’s in previous publications, as well as the 5% significance cutoff in the grey-colored dashed line. In general, the studies show evidence on the global factor premiums, with 14 of the 22 factors (return seasonality is not tested in bonds and currencies) displaying significant Sharpe ratio’s at the conventional 5% significance level.

Global factor strategies 1981-20111

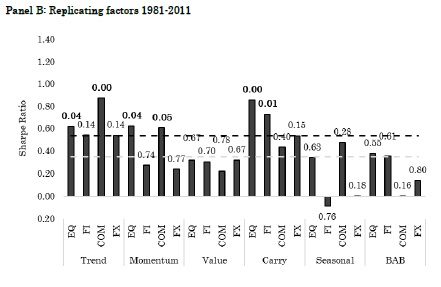
Further, most of the studies have differences in, amongst others, testing methodologies, investment universes and sample periods, choices that introduce degrees of freedom to the researcher. To mitigate the impact of such degrees of freedom, we reexamine the global return factors using uniform choices on testing methodology and investment universe over their average sample period (1981-2011). Figure 1, Panel B shows the results of this replicating exercise. We find that Sharpe ratios are marginally lower, with 12 of the 24 factor premiums being significant at the conventional 5% level.

Global factor strategies 1981-2011


The second objective of this study is to provide rigorous new sample evidence on the global return factors. To this end, we construct a deep, largely uncovered historical global database on the global return factors in the four major asset classes. This data consists of pre-sample data spanning the period 1800- 1980, supplemented with post-sample data from 2012-2016, such that we have an extensive new sample to conduct further analyses. If the global return factors were unintentionally the result of p-hacking, we would expect them to disappear for this new sample period.

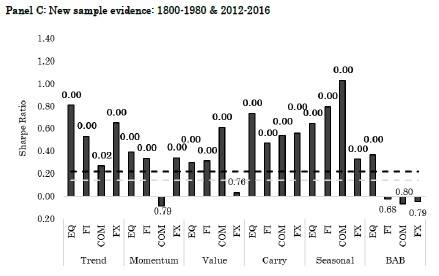
Our new sample findings reveal consistent and ubiquitous evidence for the large majority of global return factors. Figure 1, Panel C summarizes our main findings by depicting the historical Sharpe ratio’s in the new sample period. In terms of economic significance, the Sharpe ratios are substantial, with an average of 0.41. Remarkably, in contrast to most out-of-sample studies we see very limited ‘out-of-sample’ decay of factor premiums.

In terms of statistical significance and p-hacking perspectives, 19 of the 24 t-values are above 3.0,19 Bayesian p-values are below 5%, and the break-even prior odds generally need to be above 9,999 to have less than 5% probability that the null hypothesis is true."


Are you looking for more strategies to read about? Check http://quantpedia.com/Screener

Do you want to see performance of trading systems we described? Check http://quantpedia.com/Chart/Performance

Do you want to know more about us? Check http://quantpedia.com/Home/About


Follow us on:

Facebook: https://www.facebook.com/quantpedia/

Twitter: https://twitter.com/quantpedia


Continue reading

Fund Flows of Active Funds Significantly Affect Value and Size Factors

27.February 2019

A new academic paper related to:

#25 – Size Factor
#26 – Value (Book-to-Market) Factor

Authors: Hung, Song, Xiang

Title: Fragile Factor Premia

Link: https://papers.ssrn.com/sol3/papers.cfm?abstract_id=3312837

Abstract:

We demonstrate that returns and volatilities of the Fama-French size and value factors are significantly determined by non-fundamental flow-induced trading from actively managed equity mutual funds. Mutual fund flows are largely ignorant about systematic risks. These non-fundamental shifts in demand induce large return heterogeneity within and across the Fama-French size and book-to-market portfolios. We show that aggregate mutual fund flow- induced trades across the size and book-to-market spectrum significantly influence the size and value premia, followed by large subsequent reversals. We also find that the expected volatilities of mutual funds’ flow-induced trades strongly predict future factor volatilities. Our results highlight the importance of non-fundamental demand shocks in determining factor premia and factor volatilities.

Notable quotations from the academic research paper:

"Mutual fund trading has a considerable price impact on individual stocks. However, some more recent work suggests that mutual fund investors are largely ignorant about systematic risks, when allocating capitals among mutual funds. Empirically, it remains unclear how trades induced by the non-fundamental mutual fund flows impact returns and volatilities of size and value, the two prominent factors. This paper aims to fi ll this gap.

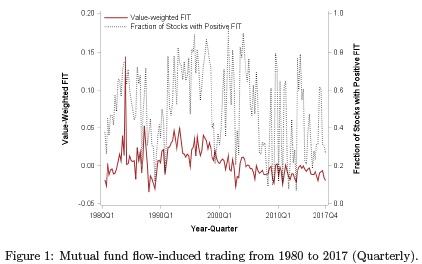
In our study, we use a bottom-up approach and estimate mutual fund flow-induced trading (FIT) for each stock-quarter from 1980 to 2017. In a nutshell, FIT measures the magnitude of flow-driven trading by the aggregate equity mutual fund industry on a particular stock in a given quarter. We use FIT rather than the entire realized trading of mutual funds because FIT only captures those trades that are driven by the demand shifts from mutual fund investors, which are largely ignorant about fundamentals

Fund flows

Our main fi ndings are as follows.

We fi nd that returns of the six FF size and book-to-market portfolios are largely determined by the uninformed mutual fund flow-induced trades. Within each of the six FF portfolios, stocks with higher FIT have higher return performance.

Mutual funds' flow-driven trades can even revert the positive size and value premia. That is, within the same book-to-market portfolios, we find large-cap stocks with above-median FIT outperform small-cap stocks with below-median FIT. Within the same size portfolios, growth stocks with above-median FIT outperform value stocks with below-median FIT.

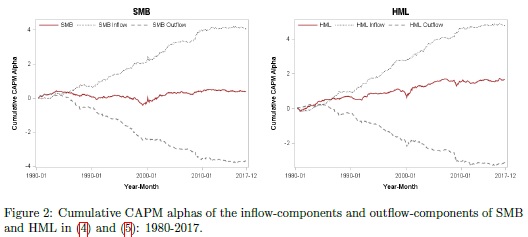
Value & Size Factor

We decompose the value minus growth returns (HML) into two components: (i) value-inflow minus growth-outflow returns (HMLInflow) and (ii) value-outflow minus growth-inflow (HMLOutflow). We decompose the small minus big returns (SMB) into the sum of (i) small-inflow minus big-outflow returns (SMBInflow) and (ii) small-outflow minus big-inflow returns (SMBOutflow). Figure 2 report the average monthly returns and alphas of SMB, HML, and their inflow and outflow components.

In sum, we find that the size premium is due to the component of small-inflow stocks minus big-outflow stocks, while the value premium is due to the component of value-inflow stocks minus growth-outflow stocks."


Are you looking for more strategies to read about? Check http://quantpedia.com/Screener

Do you want to see performance of trading systems we described? Check http://quantpedia.com/Chart/Performance

Do you want to know more about us? Check http://quantpedia.com/Home/About


Follow us on:

Facebook: https://www.facebook.com/quantpedia/

Twitter: https://twitter.com/quantpedia


Continue reading

Cash-Flow Beta Doesn’t Explain the Value Premium

31.January 2019

A new research paper related mainly to:

#26 – Value (Book-to-Market) Anomaly

Authors: Zhou

Title: Can Cash-Flow Beta Explain the Value Premium?

Link: https://papers.ssrn.com/sol3/papers.cfm?abstract_id=3244791

Abstract:

It is well documented that the cash flow beta can partly explain the source of the value premium. This paper presents an empirical test that cast doubt on this widely accepted belief. We double sort the stocks with their value and quality dimension and obtain four corner portfolios: (A) expensive quality, (B) cheap junk, (C) cheap quality and (D) expensive junk stocks. Prior research has shown that the value premium concentrates on cheap quality minus expensive junk (i.e. undervalued minus overvalued) but is not significant in cheap junk minus expensive quality stocks. If cash-flow beta is the source of the value premium, we would expect a larger cash-flow beta difference between the cheap quality and expensive junk portfolio. However, our empirical test shows that β_CF ((B) cheap junk) – β_CF ((A) expensive quality) >>β_CF ((C) cheap quality)-β_CF ((D) expensive junk). In other words, B minus A does not contribute to the profit of the value premium but contribute most to the difference of the cash flow beta between value and growth portfolios. Therefore, our result may serve as evidence that the cash flow beta may only spuriously explain the value premium. Or, at least, the cash-flow risk premium estimated in the portfolio regression approach is biased.

Notable quotations from the academic research paper:

"The value premium is one of the most important anomalies in the field of asset pricing. It is well known that the market beta fails to explain the value premium in the dataset after 1963.

Campbell and Vuolteenaho (2004) first proposed a “good beta, bad beta” model to solve this dilemma. They decompose the traditional market beta into two components: A good beta is the beta that measures a stock’s covariance with the temporary market movement or discount rate news, which is usually induced by changing market sentiment and varying risk aversion; A bad beta measures a stock’s comovement with market-wide fundamental cash-flow news. Campbell and Vuolteenaho (2004) and Cohen, Polk, Vuolteenaho(2009) argue that investors will regard wealth decrease induced by discount rate news as less significant because it tends to be temporary and the investors will be compensated by better future investment opportunity in an increased discount rate environment. A rational investor will demand higher return for the bad beta than the good beta.

Together with Campbell and Vuolteenaho (2004), Cohen, Polk, Vuolteenaho(2009), Campbell, Polk and Vuolteenaho (2010) and Da and Warachka (2009) among others, use different proxy for the cash-flow news and find that value stocks have a higher cash-flow beta than growth stocks. They conclude that cash-flow beta is one of the sources of the value premium. In this paper, we present an empirical test that question this widely accepted belief.

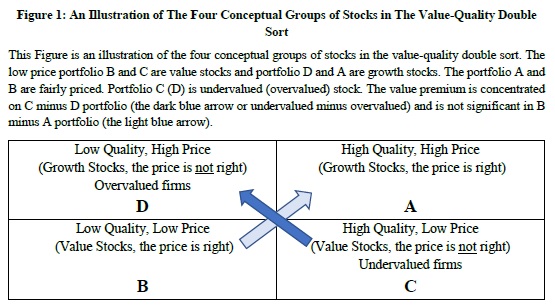
Our test double-sorts the stocks by value and quality dimension. In a conceptual simplified picture, Figure 1 illustrates four groups of stocks: (A) high quality, high price (expensive quality), (B) low quality, low price (cheap junk), (C) high quality, low price (cheap quality), and (D) low quality, high price (expensive junk). The price of portfolio A and B is thought to be “right” as their price is more aligned with the quality. Portfolio C (D) is the undervalued (overvalued) stocks.

value vs. quality

High price portfolio A and D are growth stocks, and low price portfolio B and C are value stocks. The value premium is the return of ( + ) − ( + ) = ( − ) + ( − ) . ( − ) and ( − ) are represented respectively by the light blue and dark blue arrow in Figure 1.

When the price is “right”, the value premium is not significant. The value premium is concentrated on ( − ), but not on ( − ). The return of the four portfolio have the relationship: R > R ≈ R > R .

If the cash flow beta is the source of the value premium and the value premium is concentrated on ( − ), one would naturally expect that f( ) − f( ) ≫ f( ) − f( ), in which, f is the cash flow beta. However, in our
test, we find the opposite results: f( ) − f( ) ≫ f( ) − f( ). ( − ) does not contribute to the profit of the value premium while f( ) − f( ) contribute the most to the cash-flow beta difference between the value and growth portfolio.

If the cash-flow beta represents a risk, we take most of the risk in the value-junk minus growth quality portfolio, but we earn no profit or even negative profit. We take very little or negative risk in the value-quality minus growth-junk portfolio, but we earn most of the profit of the value premium. We need to find a plausible explanation to this phenomena before we conclude that the cash-flow risk is the source of the value premium. A fundamental reason of our result is that, on the value dimension, higher return links to a higher cash-flow beta, while on the quality dimension, higher return links to a lower cash-flow beta."


Are you looking for more strategies to read about? Check http://quantpedia.com/Screener

Do you want to see an overview of our database of trading strategies? Check https://quantpedia.com/Chart

Do you want to know how we are searching new strategies? Check https://quantpedia.com/Home/How

Do you want to know more about us? Check http://quantpedia.com/Home/About


Follow us on:

Facebook: https://www.facebook.com/quantpedia/

Twitter: https://twitter.com/quantpedia

Continue reading

Subscribe for Newsletter

Be first to know, when we publish new content


    logo
    The Encyclopedia of Quantitative Trading Strategies

    Log in