YTD Performance of Equity Factors
Actual situation on financial markets changes extremely fast. At the time we are writing this blog post (Monday morning at 23rd of March) we have End-of-Day data to Friday’s close (20th of March) and a few hours of trading action from Monday and VIX currently stands over 70. Markets are in turmoil, and there exist very few investors who are unscathed by current global events related to coronavirus pandemic.
Equities are in an ugly volatile bear market; commodities are falling, gold is down from its peak. Even the US Treasuries, which are often considered as an ultimate “safe-heaven” asset, have a volatile two weeks behind. It’s a good time to revisit how are various groups of algorithmic trading strategies navigating current troubled times.
We have the luck that our database currently contains over 250 strategy ideas with a backtesting code. Therefore, we have the ability to dip into this inventory and select some examples quickly. It this article, we would like to pick a few well-known long-short equity factor strategies. We will revisit our database in some subsequent posts and analyze the performance of other groups of strategies to see how they are able to weather the storm.
The selected sample for this short article consists of 7 well-known equity factor strategies – size, value, momentum, quality, investment, short-term reversal and low volatility factors. All strategies are backtested in QuantConnect framework. Investment universe in all 7 cases consists of 1000 US stocks with the highest liquidity (defined as stocks with the highest average monthly dollar turnover). We are interested in factor strategies which are investable in real life, therefore we are building our investment universe from stocks which have sufficient liquidity—this way we are mimicking liquidity constraints of a typical medium to a large-sized hedge fund. We will publish our code and all equity curves at the end of the article.
Trading rules for each strategy are as follows:
Size Factor: Strategy goes long 20% of firms with the smallest market capitalization and goes short 20% of firms with the highest market capitalization. The portfolio is rebalanced yearly, and stocks are weighted equally.
Value Factor: Strategy goes long 20% of firms with the lowest P/B ratio and goes short 20% of firms with the highest P/B ratio. The portfolio is rebalanced yearly, and stocks are weighted equally.
Momentum Factor: Strategy goes long 20% of firms with the highest performance during the previous 12-months (with the last month skipped) and goes short 20% of firms with the lowest performance during the previous 12-months (with the last month skipped). The portfolio is rebalanced monthly, and stocks are weighted equally.
Short-Term Reversal Factor: Strategy goes long 20% of firms with the lowest performance during the previous month and goes short 20% of firms with the highest performance during the previous month. The portfolio is rebalanced monthly, and stocks are weighted equally.
Low-Volatility Factor: Strategy goes long 20% of firms with the lowest average daily volatility during the previous 36-months and goes short 20% of firms with the highest average daily volatility in the last 36-months. The portfolio is rebalanced monthly, and stocks are weighted equally.
Investment Factor: Strategy goes long 20% of firms with the lowest investments ( Investments is the growth of total assets for the fiscal year ending in t-1 divided by total assets at the end of t-1 ) and goes short 20% of firms with the highest investments. The portfolio is rebalanced yearly, and stocks are weighted equally.
Quality Factor: Strategy goes long 20% of firms with the highest ROA (Return on assets (ROA) calculated as quarterly earnings (Compustat quarterly item IBQ – income before extraordinary items) divided by one-quarter-lagged assets (item ATQ – total assets) and goes short 20% of firms with the lowest quality. The portfolio is rebalanced monthly, and stocks are weighted equally.
Now, our goal is not to achieve the academic purity of selected factor strategies. We know that there are a lot of different methodologies to calculate selected factors (as there are, for example, for the quality factor, etc.). We do not have the ambition to judge which methodology is the best. Our goal is to pick an easy method and move to the next point of our article – analysis of how various strategies perform in the current bear market.
Our analysis shows that we have two groups of factors: strong winners and bad losers. There is no middle ground. A current bear market is ruthless, equity long-short factor strategies either totally nailed it and had a stellar performance or totally disappointed.
Let’s see factor performance in one chart and then we can look at each factor separately:
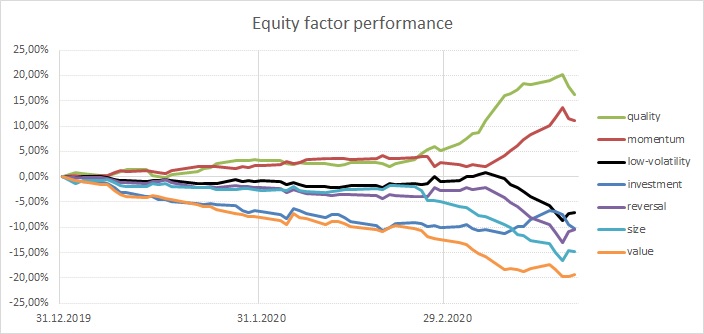
Among the winners are:
Quality Factor – is often considered as a good factor for a time of stress as profitable and strong companies usually outperform during a bear market (see for example paper by Jensen-Gaard: Equity Investment Styles: Recent evidence on the existence and cyclicality of investment styles). The current crisis is not different. As a side note – Warren Buffet, who is a notable proponent of value investing, or a quality + low beta investing – as this research paper shows, is strongly outperforming S&P500 on a relative basis during the current bear market.
| Algo Trading Promo Codes are available exclusively for Quantpedia’s readers. |
Momentum Factor – this can probably be expected. We have spent a lot of time by analyzing hundreds of different trading strategies to uncover how they perform during bear markets. Most of the academic research papers related to equity momentum trading strategy show that this factor performs well during the first stages of crises (as it usually shorts stocks with strong downward momentum and buys stocks which are not falling fast). However, momentum crashes usually occurs right as the market rebounds following previous large declines. Therefore if anybody wants to use momentum factor as a part of the overall portfolio, it is better to use some more sophisticated version of this strategy and not to be caught later (see Three Methods to Fix Momentum Crashes).
And what are the losers?
Size Factor – this can be probably expected too. Large stocks are usually less risky and more stable companies. If the government steps into financial markets and starts to intervene to save the economy, it will probably do so by bailing out the largest companies which will benefit the most from any rescue package.
Low volatility – now that’s a real surprise. Its advocates have long promoted low volatility factor as the “ultimate smart beta” factor. Who could resist the promise of higher performance and lower risk than classical market-cap-weighted indexes? Countless of low-volatility tilt products popped out during last years, and it seems they arbitraged away all of the low-volatility premia. It seems that low-volatility factor has become a victim of its own success.
Value Factor – value had a disappointing performance during the previous several years, and many analysts had written it off. Unfortunately, the year 2020 is also not among the lucky years for value factor.
Investment Factor – back-test shows that investment factor has not crashed during the March crisis but was gradually under-performing from the beginning of the year.
Short-Term Reversal Factor – is a complementary strategy to the popular momentum factor. Usually under-performs at the beginning of the crisis, so it’s not a surprise that it is among losers also during the current bear market. The strategy usually performs well around the bottom of the bear market, when stocks which were not performing well strongly rebound.
Conclusion:
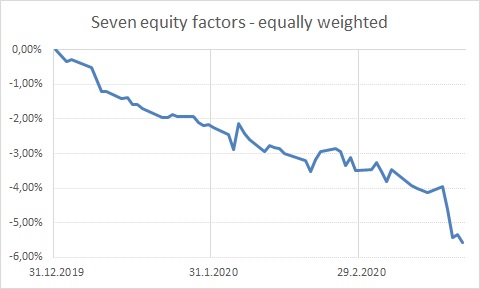
All in all, up-to-date performance of selected equity factor strategies was in line with expectations. The biggest surprise is the low-volatility factor which paid a high toll for its popularity. If there is one lesson from the current trend, then it would be the old saying – diversification, diversification, diversification. Do not bet everything on one factor (or two, or three). It makes sense to employ multiple factor strategies at once. Here we have the diversified, equally-weighted portfolio based on all seven equity long-short factors. It is still in red numbers, but nothing extremely disappointing as several individual factors.
Are you looking for strategies applicable in bear markets? Check Quantpedia’s Bear Market Strategies
Are you looking for more strategies to read about? Sign up for our newsletter or visit our Blog or Screener.
Do you want to learn more about Quantpedia Premium service? Check how Quantpedia works, our mission and Premium pricing offer.
Do you want to learn more about Quantpedia Pro service? Check its description, watch videos, review reporting capabilities and visit our pricing offer.
Do you want algorithmic access to the full Quantpedia database via the API? Subscribe to Quantpedia Pro, ask for an API key, and explore the in/out-of-sample statistics, source academic papers, and code snippets — ideal for quantitative research, systematic trading workflows, and AI model training.
Are you looking for historical data or backtesting platforms? Check our list of Algo Trading Discounts.
Or follow us on:
Facebook Group, Facebook Page, Telegram, Twitter, Linkedin, Medium or Youtube
Share onLinkedInTwitterFacebookRefer to a friend


