Cryptocurrency Volatility Index
Whenever traders want to assess the stock market’s mood, there is one really popular and useful index the most of them turn to. Yes, you guessed it right, it’s CBOE’s VIX Index. And which index can we use if we want to determine the mood of the cryptocurrencies? We can turn to a paper written by Fabian Woebbeking, which offers the methodology to compute two cryptocurrency volatility indexes (CVX & CVX76). The CVX and CVX76 Indexes also extract the market’s expectation of future volatility from option prices, but from options on the Bitcoin. The research suggests that the cryptocurrency option market has finally reached a sufficient market size to extract stable cryptocurrency volatility information.
Authors: Fabian Woebbeking
Title: Cryptocurrency Volatility Markets
Link: https://papers.ssrn.com/sol3/papers.cfm?abstract_id=3639098
Abstract:
In this paper we compute a cryptocurrency volatility index (CVX) that extracts the market’s expectation of future volatility from option prices. Our method addresses the challenging liquidity environment of this young asset class and allows us to extract stable market implied volatilities. Calculations are based on two potential index methodologies, using granular intra-day cryptocurrency options data, which spans over several months and includes the COVID-19 pandemic period. CVX data therefore captures `normal’ market dynamics as well as a distress and recovery period. Comparing our data to existing volatility benchmarks for traditional asset classes, such as VIX (equity) or GVX (gold), shows that cryptocurrency volatility dynamics are often disconnected from traditional markets, yet, share common shocks..
Notable quotations from the academic research paper:
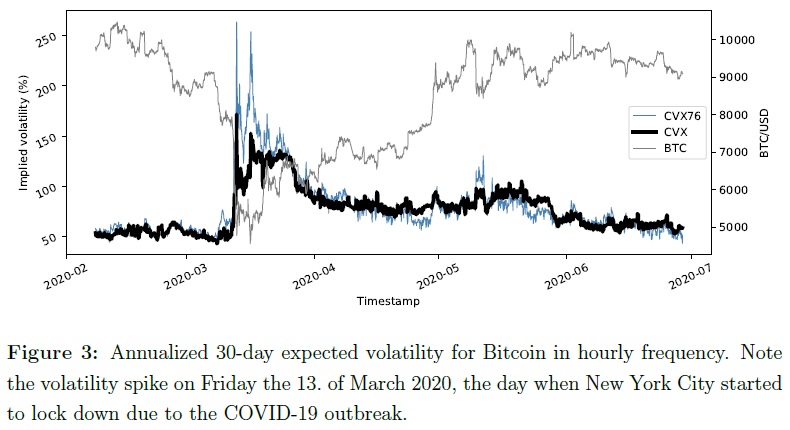
“Figure 3 shows the expected Bitcoin volatility in hourly frequency as captured by CVX and CVX76. CVX is the model free annualized expected volatility over the next 30-days, which is based on mid-prices for Bitcoin options (see Section 3.2). CVX76 is based on the Black 76 model implied volatility and interpolated from a volatility surface for each timestamp in the data (see Section 3.3). Both indices are based on the same option data.
| Do you want to test these ideas yourself? We offer our readers Historical Trading Data Discounts. |
The volatility indices CVX and CVX76 often appear inversely related to their underlying. This is a typical observation for volatility indices. On one hand, market corrections are typically more rapid than upward moves and cause spikes in volatility. On the other hand, with a net long position over all investors in the underlying, the demand for downside protection drives volatility prices especially when markets are falling.
Di fferences between CVX and CVX76 are obviously owed to the fundamentally di fferent calculation methods, however, both methods a principally designed to measure the same information, i.e. 30-day market implied volatility. It appears that CVX76 is similar to CVX in `normal’ markets, but produces much more extreme results during times of strong market movements. We present evidence that both indices share a strong bound and that CVX76 tends to return to the level of CVX – not vice versa – which supports the argument that
- CVX is a more accurate representation of market expected volatility,
- the deviation of the indices is caused by the CVX76 normality assumption, and
- the (CVX – CVX76) spread bears potential as a tail-risk indicator.
In a nutshell, out-of-the-money option prices, especially during strong market moves, are higher than suggested by a light-tailed normal distribution. This e ffect is compensated by a particularly high Black-76 implied volatility.”
Are you looking for more strategies to read about? Sign up for our newsletter or visit our Blog or Screener.
Do you want to learn more about Quantpedia Premium service? Check how Quantpedia works, our mission and Premium pricing offer.
Do you want to learn more about Quantpedia Pro service? Check its description, watch videos, review reporting capabilities and visit our pricing offer.
Do you want algorithmic access to the full Quantpedia database via the API? Subscribe to Quantpedia Pro, ask for an API key, and explore the in/out-of-sample statistics, source academic papers, and code snippets — ideal for quantitative research, systematic trading workflows, and AI model training.
Are you looking for historical data or backtesting platforms? Check our list of Algo Trading Discounts.
Or follow us on:
Facebook Group, Facebook Page, Telegram, Twitter, Linkedin, Medium or Youtube
Share onLinkedInTwitterFacebookRefer to a friend


