Market Sentiment and an Overnight Anomaly
Abstract
Various research papers show that market sentiment, also called investor sentiment, plays a role in market returns. Market sentiment refers to the general mood on the financial markets and investors’ overall tendency to trade. The mood on the market is divided into two main types, bullish and bearish. Naturally, rising prices indicate bullish sentiment. On the other hand, falling prices indicate bearish sentiment. This paper shows various ways to measure market sentiment and its influence on returns.
Additionally, we take a look at an overnight anomaly in combination with three market sentiment indicators. We analyse the Brain Market sentiment indicator in addition to VIX and the short-term trend in SPY ETF. Our aim is not to build a trading system. Instead, it is to analyze financial markets behaviour. Overall the transaction costs of this kind of strategy would be high. However, more appropriate than using this system on its own would be to use it as an overlay when deciding when to make trades.
Market Sentiment and an Overnight Anomaly
Numerous traders have noticed that the US stocks have significantly higher return during the night session compared to the daily session. Multiple academic studies have confirmed this suspicion and found that the US equity premium is mostly due to overnight returns. This notion is called an overnight anomaly, and it is described in more detail by Cooper, Cliff and Gulen in “Return Differences between Trading and Non-Trading Hours: Like Night and Day” and in “Overnight Return, the Invisible Hand Behind The Intraday Return? A Retrospective” by Branch and Ma.
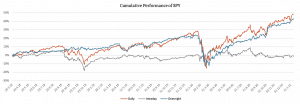
The figure below shows the cumulative daily, intraday and overnight performance of SPY from January 2018 till January 2021. This period includes two bear markets, one in December 2018 and another one in March of 2020, as well as periods of bull markets. As we can see, the majority of the equity premium comes from the overnight return.
|
SPY |
3Y Cumulative |
3Y |
Sharpe |
Average |
Average |
DD |
CAR/ |
|
Daily |
15.25% |
23.27% |
0.66 |
0.07% |
1.44% |
-34.10% |
0.45 |
|
Intraday |
-0.44% |
15.02% |
-0.03 |
0.00% |
0.93% |
-22.41% |
-0.02 |
|
Overnight |
13.62% |
16.24% |
0.84 |
0.05% |
1.01% |
-29.41% |
0.46 |
As we have suspected, the overnight performance of SPY is significantly higher than the intraday performance, however it can still be improved. One way to improve it further could be by looking at the sentiment in the financial markets as described by, Anchada Charoenrook in “Does Sentiment Matter?”.
How To Measure Market Sentiment
Market sentiment refers to the general mood on the financial markets and the overall tendency of investors to trade. Market sentiment, sometimes called investor sentiment, distinguishes between two main types, bullish and bearish. Naturally, rising prices are connected with bullish market sentiment. On the other hand, falling prices are connected with bearish market sentiment.
| Algo Trading Data Discounts are available exclusively for Quantpedia’s readers. |
There are numerous ways to measure sentiment in the financial markets. Traditional sentiment indicators include the CBOE Volatility Index (VIX), High-Low Index or Bullish Percent Index (BPI). Another way to measure sentiment is by using various news sources, social media or other market sentiment indicators. We managed to obtain data for the Brain Market Sentiment (BMS) Indicator and are using it as an example of news sentiment data set in our analysis.
The BMS indicator gives a score on the market’s general mood by analysing thousands of news from financial media using Natural Language Processing technology. Firstly, relevant news sources are selected and clustered by topic. After that, a sentiment is assigned to each topic (1 for positive sentiment, -1 for negative). Every day the BMS provides an aggregate score for the news topic sentiment. It varies between 0 and 100, depending on the percentage of positive topics from that day. BRAIN offers Market Sentiment data for various regions like the US, EU and Asia as well as Global data.
An Overnight Anomaly
Inspired by “Making Money While You Sleep? Anomalies in International Day and Night Returns” by Aretz and Bartram and “Strikingly Suspicious Overnight and Intraday Returns” by Knuteson, we decided to test whether we can improve the overnight performance of SPY by using sentiment indicators. Firstly, using the OHLC data of SPY, we calculate its intraday and overnight performance. In addition to the SPY data, we use the trend predictors to know when to expect an increase/ decrease in performance. The SPY close price, VIX close price and BMS value are used as trend predictors. To analyse whether there is a relationship between what the predictors tell us and the performance, we do the following steps: On day t-1, we calculate the 10-day moving average of SPY close prices, VIX close prices and BMS values separately. After that, on day t-1, we compare the price of SPY (/price of VIX /value of BMS) with its 10-day moving average. In the last step, we analyse SPY’s overnight performance on day t depending on whether the SPY price (/VIX price /BMS value) is above or below its 10-day moving average. We repeat this process with 20- and 50-day moving averages.
Our hypotheses are that the SPY’s overnight performance would be higher when the price of SPY is over its moving average (VIX is below its moving average), and it would be lower when the price of SPY is below its moving average (or VIX is above its moving average). Another hypothesis we have is that the BMS trend predictor would affect SPY’s overnight performance similarly to VIX and SPY, so that the performance would be higher when the value of BMS is above its moving average and lower when the value of BMS is below its moving average.
The following figure shows SPY’s overnight cumulative performances based on a 20 – day moving average and various signals.
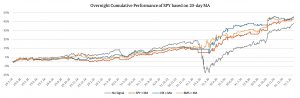
The figure above shows significant improvement of performance when the price of SPY is above its moving average, when the price of VIX is below its moving average or when the value of BMS is above its moving average. We see that all three sentiment indicators improve the performance of the overnight anomaly.
Without using any signal, we get a performance of 13.62% p.a. and a Sharpe Ratio of 0.84. When using the BMS indicator (value of BMS > 20-day MA) the performance is 15.07% p.a. and Sharpe Ratio is 1.71. When using signal from VIX (the price of VIX < 20-day MA) we get the performance of 15.70% p.a., additionally, the Sharpe Ratio is 1.80 and when using SPY itself (the price of SPY > 20-day MA), we get the performance of 15.52% p.a. and the Sharpe Ratio of 1.92. The table below shows the risk characteristics for the abovementioned scenarios.
|
SPY Overnight Performance |
3Y Cumulative |
3Y |
Sharpe |
Average |
Average |
DD |
CAR/ | |
|
20-day |
No signal |
13.62% |
16.24% |
0.84 |
0.05% |
1.01% |
-29.41% |
0.46 |
|
SPY signal |
SPY>MA |
15.62% |
8.14% |
1.92 |
0.06% |
0.50% |
-5.31% |
2.94 |
|
VIX signal |
VIX<MA |
15.70% |
8.72% |
1.80 |
0.06% |
0.54% |
-6.77% |
2.32 |
|
BMS signal |
BMS>MA |
15.07% |
8.84% |
1.71 |
0.06% |
0.55% |
-6.63% |
2.27 |
The resultant equity curves of all three strategies are not strongly correlated. An average correlation is just below 0.6, so it means that every sentiment indicator probably captures independent information, and a summary portfolio built on all three news sentiment indicators can be better than individual parts.
Combining Multiple Strategies
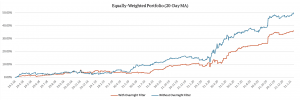
Therefore, because all three strategies improved the original portfolio’s performance, we combine them to create an equally-weighted portfolio. This portfolio has a significantly higher Sharpe Ratio and lower drawdowns than each of the individual portfolios. We repeat this process with the 10- and 50-day moving average. The figure below shows the cumulative return and the table shows the risk characteristics for the equally-weighted portfolios.
| Equally-Weighted Portfolio |
3Y Cumulative |
3Y |
Sharpe |
Average |
Average |
DD |
CAR/ | |
| 10-day MA | 14.02% | 7.77% | 1.80 | 0.05% | 0.48% | -5.28% | 2.65% | |
|
20-day MA |
15.58% |
7.33% |
2.12 |
0.06% |
0.45% |
-3.98% |
3.91 | |
|
50-day MA |
11.97% |
6.74% |
1.78 |
0.04% |
0.42% |
-3.21% |
3.72 |
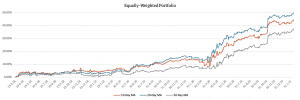
The 20-day moving average equally-weighted portfolio has the highest performance and Sharpe Ratio of all three equally-weighted portfolios.
Additional Filters
Additionally, we try to filter the performance based on previous overnight/ intraday performance. We analyse how the performance behaves if the prior overnight (/intraday) performance is above or below zero. The results show that the performance significantly improves when the previous overnight performance is below zero. Moreover, we analyse the equally-weighted portfolio, which combined the three portfolios mentioned above. The following table shows the results of all risk characteristics.
|
SPY performance |
3Y Cumulative |
3Y |
Sharpe |
Average |
Average |
DD |
CAR/ | |
|
SPY > MA |
Overnight < 0 |
11.75% |
5.89% |
2.00 |
0.04% |
0.37% |
-3.53% |
3.33 |
|
VIX < MA |
Overnight < 0 |
11.72% |
6.62% |
1.77 |
0.04% |
0.41% |
-4.99% |
2.35 |
|
BMS > MA |
Overnight < 0 |
11.36% |
7.02% |
1.62 |
0.04% |
0.44% |
-4.17% |
2.73 |
|
Equally-weighted |
11.67% |
5.57% |
0.20 |
0.04% |
0.35% |
-2.92% |
0.38 |
The figure below shows the cumulative returns of the three portfolios, which use the additional overnight filter. The last filtering step (an additional overnight filter) might be questionable, and we dissuade from using it because of its high complexity and low added value.
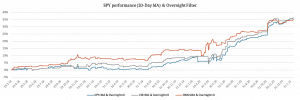
Lastly, we present a chart and a table that compares two equally-weighted portfolios, both based on 20-day MA. The first one does not use the overnight filter, while the second one does. As we can see, the overnight filter does not improve the equally-weighted portfolio’s performance, and the Sharpe Ratio of the two strategies is about the same.
|
Equally-Weighted |
3Y Cumulative |
3Y |
Sharpe |
Average |
Average |
DD |
CAR/ |
|
Without an |
15.58% |
7.33% |
2.12 |
0.06% |
0.45% |
-3.98% |
3.91 |
|
With an |
11.67% |
5.57% |
2.10 |
0.04% |
0.35% |
-2.92% |
4.00 |
Conclusion
This research confirms the results found by Cooper, Cliff and Gulen in “Return Differences between Trading and Non-Trading Hours: Like Night and Day” and shows that the overnight return is much greater than the intraday return, and additionally, it is even more significant when applying the right VIX, SPY or BMS signals. Further, the overnight performance increases even more when using the combination of all three signals in an equally-weighted portfolio. To sum everything up, our aim was not to build a trading system but to analyse financial markets behaviour. We did not add transactional costs to our calculation, even though they are not negligible because of the trading frequency. Overall the transaction costs of this kind of strategy would be very high. However, more appropriate than using this system on its own is to use it as an overlay. If you are deciding when to make trades, it might be useful to postpone trade from close to the next open or vice versa depending on the signal based on the market sentiment.
Author:
Daniela Hanicova, Quant Analyst, Quantpedia
Related literature
- Aretz, Kevin and Bartram, Söhnke M., Making Money While You Sleep? Anomalies in International Day and Night Returns (March 18, 2021). Available at SSRN: https://papers.ssrn.com/sol3/papers.cfm?abstract_id=2670841
- Branch, Ben S. and Ma, Aixin, Overnight Return, the Invisible Hand Behind The Intraday Return? A Retrospective (March 15, 2021). Available at SSRN: https://papers.ssrn.com/sol3/papers.cfm?abstract_id=3259614
- Charoenrook, Anchada, Does Sentiment Matter? (March 18, 2021). Available at: http://apps.olin.wustl.edu/workingpapers/pdf/2008-12-003.pdf
- Cooper, Michael J. and Cliff, Michael T. and Gulen, Huseyin, Return Differences between Trading and Non-Trading Hours: Like Night and Day (March 11, 2021). Available at SSRN: https://papers.ssrn.com/sol3/papers.cfm?abstract_id=1004081
- Knuteson, Bruce, Strikingly Suspicious Overnight and Intraday Returns (March 18, 2021). Available at SSRN: https://papers.ssrn.com/sol3/papers.cfm?abstract_id=3705017
- Brain Market Sentiment (BMS). Available at: https://braincompany.co/bms.html
Are you looking for more strategies to read about? Sign up for our newsletter or visit our Blog or Screener.
Do you want to learn more about Quantpedia Premium service? Check how Quantpedia works, our mission and Premium pricing offer.
Do you want to learn more about Quantpedia Pro service? Check its description, watch videos, review reporting capabilities and visit our pricing offer.
Do you want algorithmic access to the full Quantpedia database via the API? Subscribe to Quantpedia Pro, ask for an API key, and explore the in/out-of-sample statistics, source academic papers, and code snippets — ideal for quantitative research, systematic trading workflows, and AI model training.
Are you looking for historical data or backtesting platforms? Check our list of Algo Trading Discounts.
Or follow us on:
Facebook Group, Facebook Page, Telegram, Twitter, Linkedin, Medium or Youtube
Share onLinkedInTwitterFacebookRefer to a friend


