An important paper about correlation structure of anomalies:
Authors: Geertsema, Lu
Title: The Correlation Structure of Anomaly Strategies
Link: https://papers.ssrn.com/sol3/papers.cfm?abstract_id=3002797
Abstract:
We investigate the correlation structure of anomaly strategy returns. From an initial 434 anomalies, we select 116 anomalies that are significant in the mean and not highly correlated with other anomalies. Cluster analysis reveals 24 clusters and 29 singleton anomalies that can be grouped into 3 essentially uncorrelated blocks. Correlations between anomaly strategies exhibit some stability over time at both a pairwise and aggregate level. The exception is a correlation spike in 2001, possibly related to the aftermath of the dot-com crisis. In volatile markets correlations increase in magnitude while maintaining their sign. Short and long legs of the same anomaly are highly correlated but becomes largely uncorrelated once we use market excess returns, suggesting that the long and short legs of anomalies follow different dynamics once market-wide influences are compensated for. Correlations based on the residuals of benchmark models are substantially lower, with mean absolute correlation declining by up to half. The existence of 116 anomaly strategies that are not highly correlated echoes other findings in the literature that the return generating process for realised returns appears to be of a high dimension.
Notable quotations from the academic research paper:
"Our paper investigates the correlation structure of 434 anomaly strategies. To our knowledge we are the first to examine the correlation structure of anomaly strategies in detail on this scale. The importance of anomalies may be self-evident to researchers in the field. But what do we gain by investigating the correlation structure of anomalies? We advance three arguments to motivate our work.
First, we argue that the importance of an anomaly should depend on both its magnitude and its uniqueness relative to other anomalies. The magnitude of anomalies is both well studied and well reported. On the other hand, little is known about the uniqueness of a given anomaly relative to the rest. Most anomaly research conduct the usual time-series alpha tests on anomaly portfolios and may, in addition, control for a handful of other anomalies. At one extreme, a new anomaly might be so highly correlated with another anomaly as to essentially constitute the same effect, thus at best contributing a more nuanced understanding or interpretation of the original anomaly. At the other extreme, a new anomaly might be completely orthogonal to all known anomalies. Such an anomaly is clearly more valuable in furthering our understanding of the cross-section of realised returns. The correlation between anomalies allows us to quantify which anomalies are unique, which are related and which are essentially the same, thus imposing a measure of order on the factor zoo.
Second, understanding the correlation structure between anomalies (and its dynamics over time) may aid in uncovering the underlying sources of macro-economic risk that drives the compensation for-risk component of anomaly excess returns. Groups of anomalies that are consistently correlated may point towards common underlying factors, thus aiding in the construction of better expected return benchmark models.
Third, correlation, in combination with asset variance, completely determines the covariance matrix of asset returns. The return covariance matrix has played a central role in virtually all portfolio management since Markowitz.
We find that some anomalies are highly correlated with other anomalies, to the extent that it is very likely that they reflect the same latent effect. Once we restrict ourselves to the 151 anomalies that are significant in the mean, 36% percent of anomalies have an absolute pairwise correlation above 0.8 with some other anomaly. Despite this, 116 anomaly strategies remain even when we consolidate highly correlated anomalies (those correlated at 0.8 or above). A principal component analysis conducted on the 116 anomalies confirms the high-dimensionality of the dataset. A total of 60 principal components are needed to explain 90% of the variation in the 116 anomalies. Many finance researchers have a prior that there should be only a small number of independent sources of priced risk – and certainly not 60. An interpretation that avoids this tension is that much of the outperformance of anomaly strategies may be a combination of a) mispricing and b) data-mining.
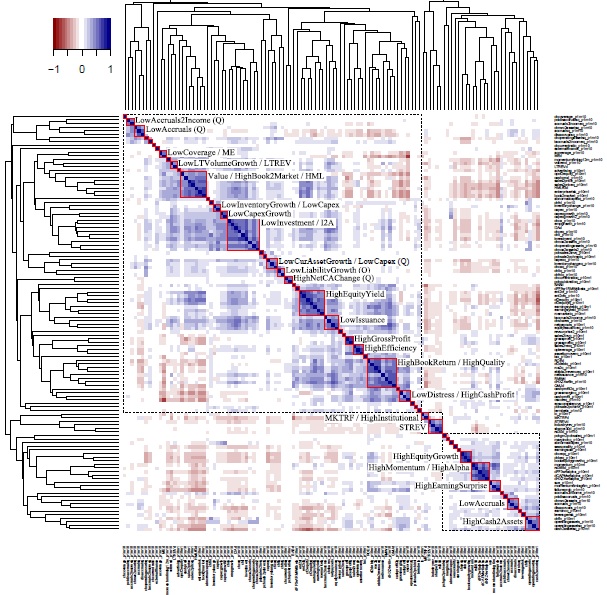
We find clusters of anomalies that exhibit high within-cluster correlation. Between-cluster correlation ranges more widely from positive to negative. Together the pattern is one of intricate correlation structures that appear qualitatively different from either white noise or a simple linear factor data generating process. The anomalies grouped within clusters make sense, in that their similarity is evident from the way in which they are constructed. This enables us to assign to these 24 clusters tentative labels. In addition to the 24 labelled clusters, we also identify 29 “singletons” – single anomalies that can be thought of as clusters containing a single anomaly. At a higher level, we identify three “blocks” of anomalies. The pairwise correlations between anomalies in the same block are almost always positive, while the correlations between anomalies in different blocks are often negative.
Once we eliminate highly correlated anomalies and anomalies that are not significant in the mean, the average correlation between two distinct anomalies is 0.05. This very low average correlation has been cited as a reason why there is no need to control a new anomaly against every single existing anomaly. We find that the mean (across anomalies) of the maximum correlation relative to other anomalies is 0.68, dropping to 0.56 if highly correlated anomalies are consolidated. This suggests that at least some of the new anomalies proposed in the literature may not be as unique as previously thought.
There is evidence that the correlation structure of anomalies are state-dependent. In particular, we find that volatile months (those in the top quartile measured by daily market volatility) produce correlations with substantially higher magnitude but with the same sign as quiet months (those in the bottom quartile). In other words, positive correlations become more positive and negative correlations become more negative in volatile markets. This stands in contrast to the received wisdom that asset correlations tend toward one in volatile markets.
"
Are you looking for more strategies to read about? Check http://quantpedia.com/Screener
Do you want to see performance of trading systems we described? Check http://quantpedia.com/Chart/Performance
Do you want to know more about us? Check http://quantpedia.com/Home/About
Share onLinkedInTwitterFacebookRefer to a friend


