Short-Term Correlated Stress Reversal Trading
Short-term reversal strategies in U.S. large-cap equity indexes, such as the S&P 500, are well-documented and widely followed. These reversals often occur in response to brief periods of market stress, where sharp declines are followed by quick recoveries (as we have experienced in the last few weeks). Traditional approaches typically identify such stress periods using only the price action of the equity index itself. In this research, however, we explore a broader perspective—one that leverages the behavior of other asset classes, including gold, oil, and intermediate-term U.S. Treasuries. We demonstrate that using signals from these correlated assets to detect stress events can enhance the timing and robustness of reversal trades in equities. Furthermore, we show that combining signals across multiple markets leads to a more effective and diversified reversal strategy.
Introduction
This study proposes a novel approach to analyzing the behavior of major asset classes during correlated stress events, with implications for portfolio management and risk mitigation strategies. Our research focuses on stress events that simultaneously impact multiple asset classes, specifically instances where equities and commodities experience concurrent declines while fixed-income securities perform well.
Market stress events are often characterized by sharp, synchronized movements across multiple asset classes. When equities, commodities (such as oil or gold), and other risky assets decline in tandem, it can signal a broader flight to safety, typically accompanied by a rally in safer assets like U.S. Treasuries (e.g., IEF). These co-movements may indicate a temporary liquidity shock or a surge in risk aversion rather than a shift in fundamental value. By identifying days when multiple risky assets fall simultaneously—or when a risky asset declines while Treasuries rally—the strategy aims to capture these short-term dislocations. Such signals are more robust indicators of a market overreaction or panic selling than a decline in equities alone.
The rationale is that isolated declines in SPY or other single assets may result from asset-specific news or technical factors. However, concurrent declines across asset classes—especially when paired with a rally in government bonds—suggest systemic stress or correlated de-risking across portfolios. This type of multi-asset confirmation increases the likelihood that markets have overshot in the short term, creating a more favorable entry point for mean-reversion strategies. In essence, this approach uses cross-asset consensus to filter for higher-conviction opportunities to act as a liquidity provider during temporary dislocations.
Methodology
Data
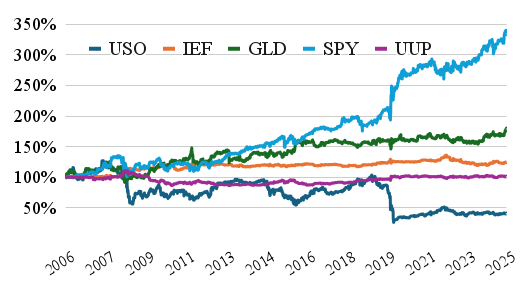
We examine the five primary asset classes and use the following ETFs as proxies:
- Commodities (represented by oil ETF USO)
- Fixed income securities (bonds, ETF IEF)
- Precious metals (gold ETF GLD)
- Equities (stock index ETF SPY)
- Currencies (bullish US Dollar ETF UUP)
Our data sample starts in 2004 for SPY, IEF, and GLD, 2006 for USO and UUP, and ends in 2025. For all of the ETF historical data, we used data from EODHD.com – the sponsor of our blog. EODHD offers seamless access to +30 years of historical prices and fundamental data for stocks, ETFs, forex, and cryptocurrencies across 60+ exchanges, available via API or no-code add-ons for Excel and Google Sheets. As a special offer, our blog readers can enjoy an exclusive 30% discount on premium EODHD plans.
Methods
We employ a dynamic threshold model to identify stress events, defining them as simultaneous one day declines in two risk-on asset classes (SPY-equities, USO-oil, GLD-gold) or one day decline in one risk-on asset and appreciation in the risk-off asset (IEF-fixed income) beyond a specified parametric threshold. The model is implemented for each dedicated pair of asset classes.
- Gold and Equities (2x risky assets)
- Oil and Equities (2x risky assets)
- Oil and Gold (2x risky assets)
- US Treasuries and Gold (1x risk-off and 1x risk on asset)
- US Treasuries and Equities (1x risk-off and 1x risk on asset)
- US Treasuries and Oil (1x risk-off and 1x risk on asset)
The stress threshold is parameterized, allowing for a flexible definition of stress events. For instance, a 1% threshold would identify days when both risky assets in a pair decline by more than -1% (or one risky asset decline more than -1% and risk-off asset appreciation by more than +1%). For each combination, the optimal iteration threshold is reported. 0% optimal threshold means that both risky assets representing specific asset classes closed negatively on that day (or one risky asset declined and, at the same time, a risk-off asset closed positively).
Results
Simple Trading Strategy and Performance Evaluation
Upon identification of a stress event, we implement a one-day trading strategy, initiating positions at the close of the stress day and liquidating at the close of the subsequent trading day. The analysis considers five potential investment, one at a time for each of the possible occurrences:
- Long oil
- Long US treasuries
- Long gold
- Long equities
- Long USD
Performance is evaluated using equity curves for each position type, accompanied by comprehensive performance and risk metrics to be reported in subsequent sections.
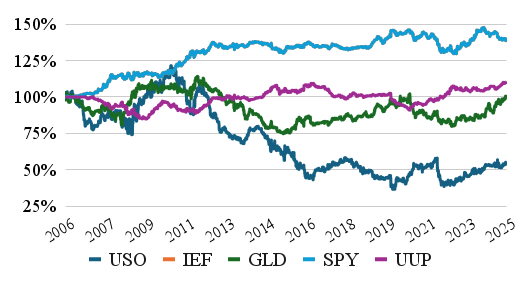
1. Next day reaction in ETFs after Gold and Equities decline together (2x risky asset – GLD & SPY decline; 0% threshold)

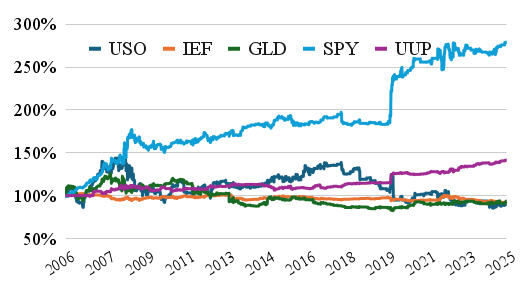
2. Next day reaction in ETFs after Oil and Equities decline together (2x risky asset – USO & SPY decline; 0% threshold)
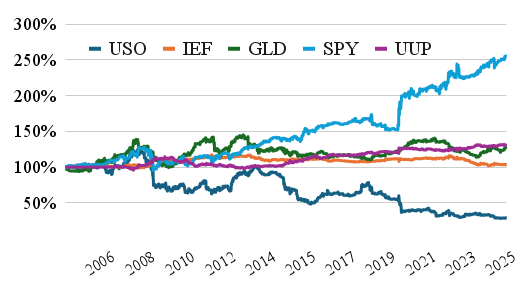
3. Next day reaction in ETFs after Oil and Gold decline together (2x risky asset – USO & GLD decline; -0.5% threshold)
4. Next day reaction in ETFs after US Treasuries increase and Gold declines (1x risk off asset – IEF & 1x risky asset GLD; 0.0% threshold)
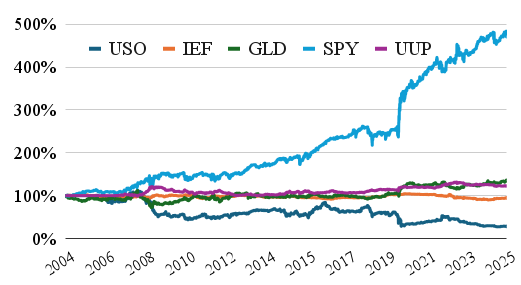
5. Next day reaction in ETFs after US Treasuries increase and Equities decline (1x risk off asset – IEF & 1x risky asset SPY; 0.0% threshold)
6. Next day reaction in ETFs after US Treasuries increase and Oil declines (1x risk off asset – IEF & 1x risky asset USO; 0.0% threshold)
Concentrated Assets Performance for Each Combination
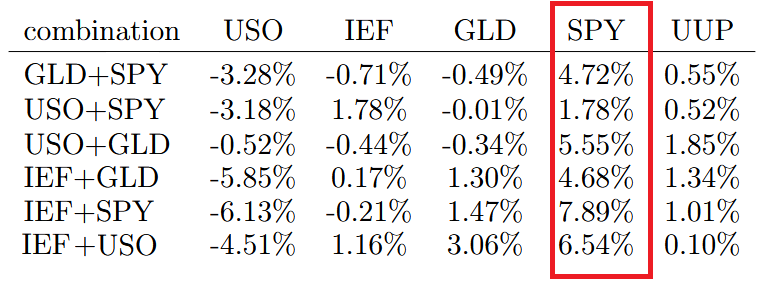
We can see that equity markets represented by major S&P 500 index are performing best after short-term stress, which makes them an ideal asset on which to base correlated reversal strategies.
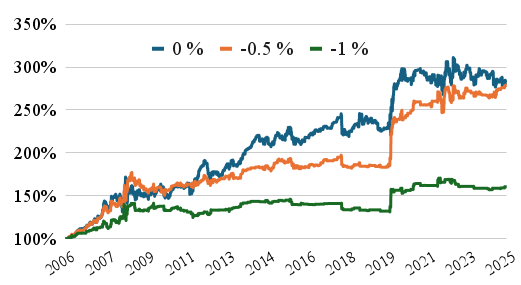
Threshold variations
In the previous part, we mentioned that several different levels of threshold can be used to signal correlated stress reversal. Here, we will pick one signal pair (USO+GLD combination), change the threshold parameter, and show how the SPY ETF performs if we hold it one day after the stress event. Other pairs have approximately similar patterns – the optimal threshold is between 0% and -0.5% move for the risky asset (or between 0% and +0.5% move for the risk-off asset – IEF).

1 Calmar Ratio
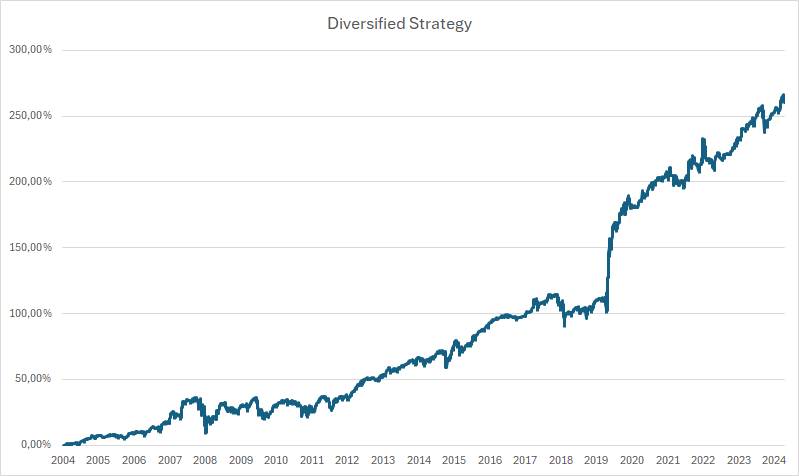
Trading Strategy with Diversified Signals
As the best asset to buy for the reversal strategy is the SPY ETF, and we have multiple prediction signals, we can diversify among them and build a composite strategy. As an example, we can pick the following three predictors:
- one day increase in IEF and simultaneous one day decrease in GLD
- one day increase in IEF and simultaneous one day decrease in USO
- one day increase in IEF and simultaneous one day decrease in SPY
Let’s one more time review the cumulative return equity curves of this three distinct investment strategies:


Subsequently, we conclude the analysis by presenting a final portfolio strategy, computing the equally weighted average returns from these three strategies, and providing an associated performance table for this aggregated strategy.

This study provides valuable insights into the behavior of major asset classes during periods of correlated stress events, where simultaneous declines occur across equities, and commodities, and flight to safety exists in fixed income. Employing a parameterized threshold model, we could flexibly identify stress events and analyze subsequent asset class reactions, revealing nuanced, regime-dependent cross-asset dynamics. Our findings highlight that U.S. equities tend to perform best in the short term following these stress episodes, suggesting their potential role as a tactical asset in portfolio rebalancing strategies.
Furthermore, the study’s consequent trading strategies, which combine multiple asset pairs and optimize stress thresholds, demonstrated enhanced risk-adjusted returns. The composite portfolio approach, aggregating strategies across gold, fixed income, oil, and equities, underscores the benefits of diversification and tactical asset allocation during market stress. These results align with broader literature emphasizing the advantage of providing liquidity and buying short-term stress in volatile environments.
Author: Cyril Dujava, Quant Analyst, Quantpedia
Are you looking for more strategies to read about? Sign up for our newsletter or visit our Blog or Screener.
Do you want to learn more about Quantpedia Premium service? Check how Quantpedia works, our mission and Premium pricing offer.
Do you want to learn more about Quantpedia Pro service? Check its description, watch videos, review reporting capabilities and visit our pricing offer.
Do you want algorithmic access to the full Quantpedia database via the API? Subscribe to Quantpedia Pro, ask for an API key, and explore the in/out-of-sample statistics, source academic papers, and code snippets — ideal for quantitative research, systematic trading workflows, and AI model training.
Are you looking for historical data or backtesting platforms? Check our list of Algo Trading Discounts.
Or follow us on:
Facebook Group, Facebook Page, Telegram, Twitter, Linkedin, Medium or Youtube
Share onLinkedInTwitterFacebookRefer to a friend


