Case Study: Quantpedia’s Composite Seasonal / Calendar Strategy
Introduction to Seasonal / Calendar Strategies
Despite the fact that the economic theory states that financial markets are efficient and investors are rational, a large amount of research is about anomalies, where the result is different from the theoretical expectation. At Quantpedia, we deal with anomalies in the financial markets and we have identified more than 500 attractive trading systems together with hundreds of related academic papers.
This article should be a case study of some strategies that are listed in our Screener, with an aim to present a possible usage of strategies in our database. Moreover, we have extended the backtesting period and we show that the strategies are still working and have not diminished. This blog also should serve as a case study on how to use the Quantpedia’s database itself; therefore the choice of strategies was not obviously random and strategies were filtered by given criteria, however, every strategy is listed in the “free“ section, and therefore no subscription is needed.
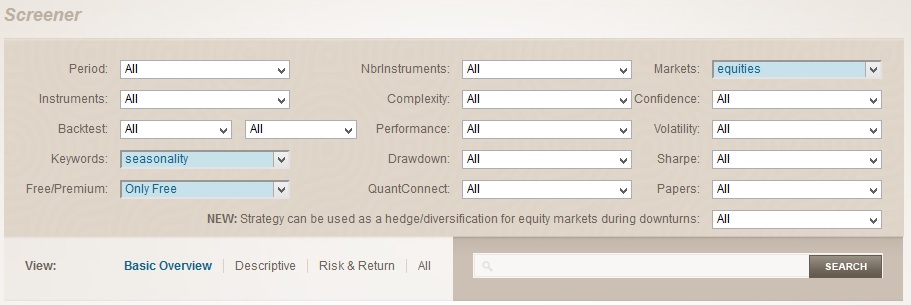
Since our strategies are connected with the equities, the first filter in our screener is “Markets“, where we have picked equities. Secondly, various characteristics of strategies could be simply found by searching with keywords, in this case, we would choose the “seasonality“. Lastly, we would pick “Only Free“ from the Free/Premium filter.
Although the term anomalies in the financial markets might sound too complicated, we have picked simple, yet working seasonal anomalies. Each strategy works well alone and at first, we examine them one by one, but we also show that those strategies could and probably should be considered as building blocks of one bigger strategy. Therefore, this blog is divided into two parts: where the first part is about the examination of the seasonal strategies found by the filtration – Turn of the Month in Equity Indexes, Federal Open Market Committee Meeting Effect in Stocks, Option-Expiration Week Effect and The Payday Effect. As the names are suggesting, the anomalies are seasonal. Another possibility is that we could consider them as calendar anomalies, therefore the analysis could be done simply and in our opinion, the strategies are an ideal way how to dig into the world of anomalies in the financial markets.
As we have previously mentioned, the second part is about the composite strategy made of building blocks. This approach might be simple, but it is also efficient and working. Although some complicated mathematical models may sound fancier, combining simple strategies can lead to extraordinary results, and our goal is to prove that if strategies picked by us are combined, they are working just in that way. Additionally, for each strategy or the composite one, the investor only needs to invest into S&P500 index, which can be easily made by the ETFs (for example SPY). Last but not least, our aim is to present the strategies from the practitioner’s point of a view. For the readers interested in the more theoretical depths we would advise to read the original papers connected with the particular strategies.
Turn of the Month
The turn of the month is a well-known effect on stock indexes, with a simple idea that equity prices usually increase during the last four days and the first three days of each month. Such a pattern was identified by various distinct researches for various time periods both in the Dow Jones Industrial Average and also in the S&P500 index. Apart from the expanded backtesting period and proving that such simple strategy with an easy execution still works in the present, we think that this strategy can be even more simplified by buying the SPY ETF on close at the end of the month, and selling it on close of the first day in the following month.
Despite the simplicity of this anomaly, it is a puzzle for the academic world. The Turn of the Month strategy is a big challenge for the academic world that tries to explain the potential reasons for the functionality. The reason for the functionality is not a risk-based, since higher risk does not appear to explain the turn-of-the-month effect. However, according to the other branch of the literature, the effect may be simply explained by the regularity in payment dates in the United States, because investors receive a preponderance of compensation from employment, dividends and interest at month-ends. Consequently, as investors seek to invest these funds, equity prices are pushed up.
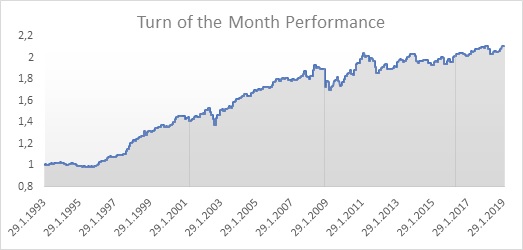
As the graph of the strategy for the years 1993-2019 shows, the Turn of the Month is profitable and this pattern is still alive even in the present. One dollar invested in 1993 would be more than doubled to 2,11 dollars in the year 2019, with a yearly performance of 3,01%. Such strategy has a maximal drawdown of 11,97%, which results in the return to drawdown ratio of 0,25.
Federal Open Market Committee Meeting Effect in Stocks
According to the past research, the S&P 500 index average daily returns are outstanding during Federal Open Market Committee (FOMC) meetings since 1980 (or the year since FED started to be less secretive and more open about its future plans and actions) – they are more than 5 times greater than returns during other average days on market. Since dates of FED meetings are publicly known and available, such effect could be easily utilized in the seasonal strategy that would long the S&P 500 index during these FED meetings. As we have previously mentioned, the simple execution of this strategy could be made by buying SPY ETF on a close day before the meeting and selling it on close after the meeting.
A simple explanation could be connected with the one market wisdom that says: „Don’t fight the FED“. Since the FED’s main aims are to address banking panics, maintain the stability of the financial system, contain systemic risk in financial markets and strengthen economic growth, it is highly unlikely that FOMC meetings conclusions would be highly negative for stocks. Moreover, in reality, the actions of FED are the opposite and in average those actions are positive for the stocks, which is the main cause for a positive drift.
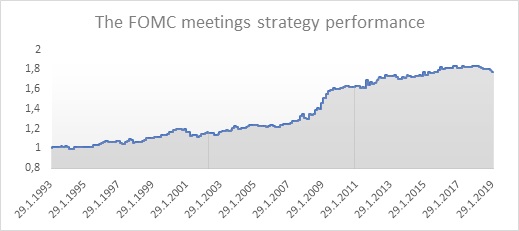
The graph shows that also this anomaly is alive and working in the present. A dollar invested in 1993 would have resulted in the 1,77 dollars in 2019, with a yearly performance of 2,30%. Although the performance might not seem to be impressive, it is important to bear in mind that the strategy is invested only a few days during the year and the strategy is able to perform in this way with a relatively small maximal drawdown of 7,17%, what results in the return to drawdown ratio of 0,32.
Option-Expiration Week Effect
As the name Option-Expiration week effect suggests, this effect is another calendar anomaly. This one is connected with the Option-expiration week – a week before options expiration (Friday before each 3rd Saturday in each month). The research suggests that stocks with large market capitalization, that have actively traded options, tend to have substantially higher average weekly returns during these weeks. This leads to a construction of a simple market timing strategy, where an investor buys the SPY ETF on close each Friday before 2nd Saturday in each month and sells it on close again in the next week’s Thursday.
According to the research, intra-month weekly patterns in call-related activity contribute to patterns in weekly average equity returns and this should be the main driver of the performance. Simplified, hedge rebalancing of option market makers trading the largest stocks that have the most actively traded options, should be the main reason for the abnormal returns of these largest stocks. Additionally, during option-expiration weeks, a sizable reduction occurs in option open interest, because the near-term options approach expiration and after that, they simply expire. This reduction in call open interest should be associated with a reduction in the net long call position of market makers, which implies a decrease in the short-stock positions being held by market makers to delta hedge their long call holdings.
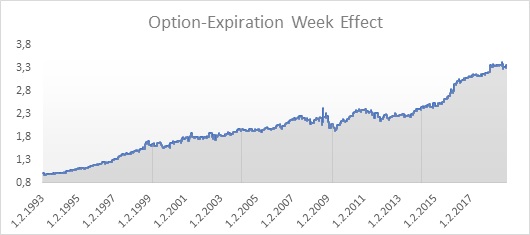
Out of our seasonal strategies, the Option-Expiration Week Effect has the highest performance, the dollar invested in 1993 would result into 3,36 dollars in the year 2019. Therefore, the strategy has an annual performance of 4,93%. The maximal drawdown of the strategy is 20,39%, which results in a return to drawdown ratio of 0,24. Unfortunately, the high performance is connected also with a greater risk represented by the maximal drawdown, but this could and we would show later that should be enhanced.
The Payday Effect
The Payday effect is similar to the Turn-of-the Month (ToM) anomaly. For the ToM, the research has linked the abnormal return with pay-days. After pay-days, investors seek to invest these funds which causes pushed up equity prices. However, many companies pay their employees twice a month, on the 15th day and at the end of the month, therefore it is natural that on the condition that the pay-day effect holds true for the turn-of-the-month days, there should be a recognizable pattern in the middle of the month as well. Research confirms the aforementioned hypothesis and abnormal returns truly exist in the middle of the month. Therefore, the simply strategy that utilizes this effect consists of buying the SPY ETF on close on the 15th day each month and selling it on close next day.
The reason for the functionality is probably deeply connected with paychecks. Many companies pay their employees twice a month, on the 15th day and at the end of the month, therefore building on that the pay-day effect holds true for the turn-of-the-month days, there should be a clear pattern in the middle of the month as well as at the end of the month. If employees get paid, many of them either automatically invest a portion of their paycheck in the market through retirement contributions or are encouraged to do so by having a surplus of funds with the new paycheck. This causes a temporarily pushed prices of stocks up, moreover it is rational to utilize that temporary situation by investing into S&P500, since these stocks should move up at most. Last but not least, according to the research, the 16th of the month is the 3rd best day in the month overall, therefore it makes a great addition to our pool of strategies and different calendar days.
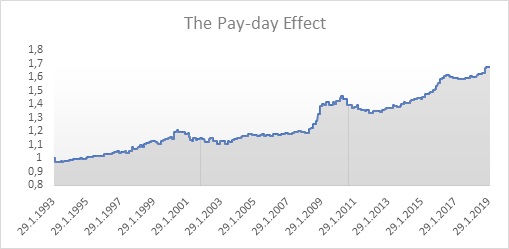
Consistent with the research that has been made, the Pay-day Effect strategy is obviously profitable and this still holds true even in the present. The dollar invested in 1993 would result in approximately 1,68 dollars in 2019. The strategy has an annual performance of 2,08% and is able to perform in this way with a maximal drawdown of 8,62%. This results in return to drawdown ratio of 0,24.
Composite strategy
As we have previously mentioned, we would like to form one bigger strategy out of these smaller ones that represent building blocks. Although there are many options how to form such strategy, a simple approach of investing the whole portfolio into SPY during “anomaly“ days sounds simple, but it is also logical. If some days are overlaying, we do not leverage our portfolio. Considering our composite strategy, one would probably think also about the risk of the strategy and not only the returns. Most of the strategies do not have drastically high maximal drawdowns, however, there is an option how to lower this maximal drawdown. The solution of this task is to add the trend factor into strategy, where the one of the simplest way how to do it is to trade only if the price of SPY is higher than it’s 200 day average. Such addition would reduce the maximal drawdown from 24,02% to 10,14% with only a small reduction in the profits.
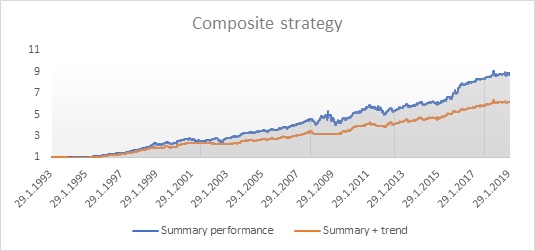
Clearly, the composite strategy without the trend having an annual performance of 9,06% is the most profitable one. But one question arises, is it worth it? What about the ratio of return to risk? The strategy with the added trend has an annual performance of 7,47%, but with the reduced maximal drawdown, the return to drawdown ratio is 0,74. The return to drawdown ratio of the simple summary strategy without the trend is only 0,38. Therefore, as a final strategy, we would propose the strategy with the added trend factor.
Authors:
Radovan Vojtko, CEO, Quantpedia.com
Matus Padysak, Analyst, Quantpedia.com
Share onLinkedInTwitterFacebookRefer to a friend


