100 Years of Historical Market Cycles
Which assets perform best when rates are rising, and inflation is high? And what happens if rates are still rising but inflation is already falling? And what’s the impact of the business cycle? These are the questions that everyone is currently trying to answer. Today, we will start a longer series of articles with the goal of giving an exact quantitative answer to all questions related to cycles in inflation, interest rates, and economic growth. This series of articles can also serve as an introduction to the methodology that we will use in the upcoming Quantpedia Pro report.
Growth, Rates and Inflation
At Quantpedia, we’ve firstly gathered 100 years of historical daily data on stocks, bonds, commodities, inflation and rates. This is the key starting point of our analysis. We explained our data methodology in our articles about creating a 100-years of daily bond data or about 100-year long history of daily commodity data.
Once the data was ready we then identified and analyzed the following market states:
- Bull and Bear markets – based on stock market performance
- Rising and Falling interest rates – based on short rates and short-term yields
- High and Low inflation – simply based on inflation
We identified the periods of bear vs. bull market, high vs. low inflation, and falling vs. growing interest rates over last 100 years with hindsight (more on hindsight in the paragraph below). This gives us 8 combinations of different market states. In this first article, we analyze the performance of bonds, stocks, and commodities during these periods and their combinations.
Market Cycles – In Sample Analysis
When analyzing market cycles, one may use countless different methodologies. In this article we opted for an in-sample analysis. I.e., by means of hindsight, we back-identify different market cycles. We then analyze how typical assets like stocks, bonds or commodities performed during these market cycles. To give you a few examples, what we will show you below includes for example:
- Rising rates and High inflation: how markets behaved exactly during the period when rates rose and inflation was high
- Bear market and Low inflation: how markets behaved exactly over the period of falling stock prices and low inflation
- Bull market and Falling rates: how markets behaved when stocks rose and rates fell
One may ask – but how can an in-sample analysis be helpful if we don’t have any hindsight ability in reality? That’s true, we don’t. But we may have a specific view on the market. And we may be right. Let’s say, for example, that I’m convinced that we are still in a market cycle of a bear market with rising rates. That’s my view. Now, how do I know which assets perform best in this phase of a market cycle? Well, this is exactly what we will show you.
In the later articles will deal with the out-of-sample analysis.
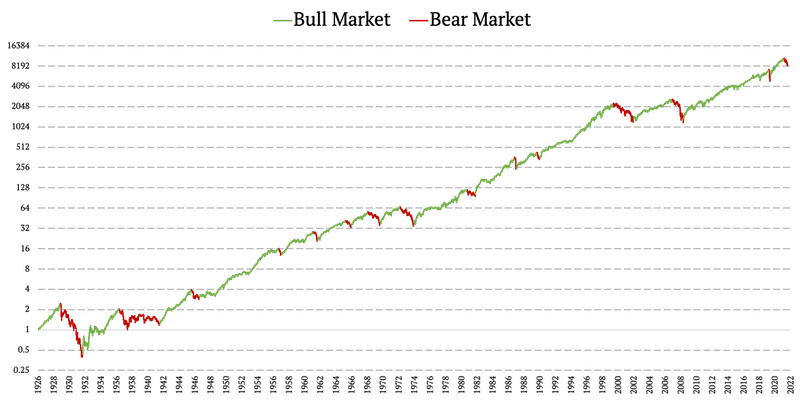
Bull vs. Bear Market
Identifying these two market phases was not as simple as it might look at a first glance. Data-wise, we combined Fama & French market factor (1926 – 1993) from Fama & French data library and SPY (SPDR S&P 500 ETF Trust) ETF’s daily returns (1993 – 2022) to obtain daily market data over the period 1926-2022. We then softly applied the following rules with the benefit of hindsight:
- Bear market: at least a 20% decline from the price high (drawdown); we measure a bear market from high until bottom
- Bull market: the period beginning at the bottom (after the bear market) and ending at the high (right before the next bear market)
The following chart shows periods of bull and bear market as identified by applying these rules:
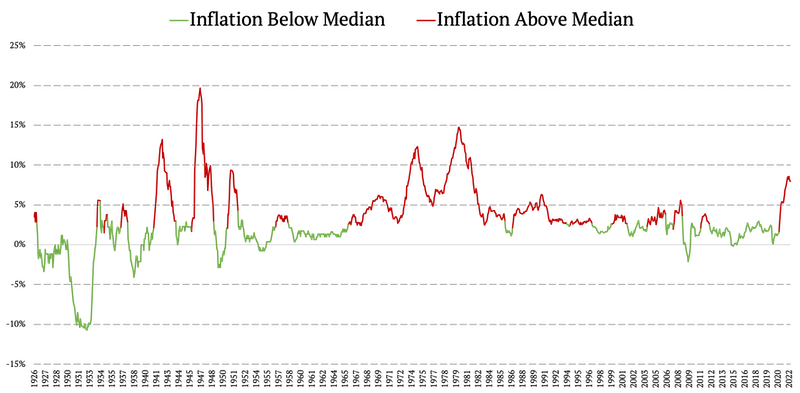
High vs. Low Inflation
Secondly, we analyzed Consumer Price Index (CPI) to identify periods of high and low inflation. In this case, we calculated the median CPI value over the period 1926-2022 (with hindsight) and marked the periods during which the CPI was higher than the median as periods with high inflation. On the other hand, the periods during which the CPI was below the median were marked as low inflation periods.
Here’s how 100 years of high and low inflation look like:
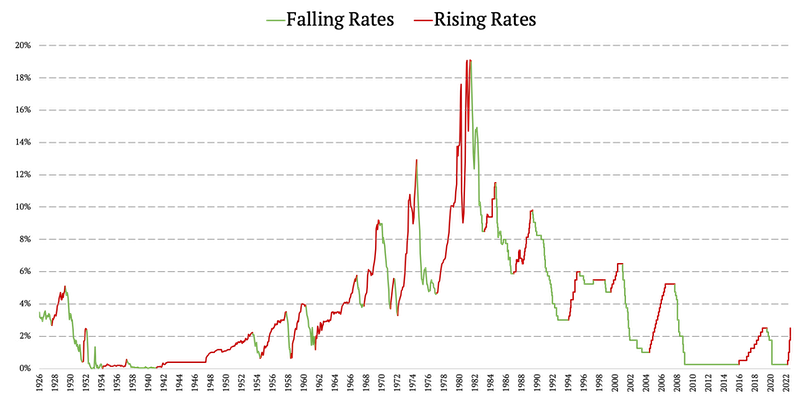
Falling vs. Rising Rates
Lastly, we examined the development and market states of short-term interest rates. We combined multiple data sources to obtain 100-year history of short rates:
1927-1934: https://fred.stlouisfed.org/series/M1329AUSM193NNBR
1934-1950: https://fraser.stlouisfed.org/title/banking-monetary-statistics-1941-1970-41 (page 693: 3-month bills, market yield)
And https://fraser.stlouisfed.org/title/banking-monetary-statistics-1914-1941-38/part-i-6408 (page 460: 3rd table dealers)
1950-1954: https://fred.stlouisfed.org/series/INTGSTUSM193N
1954-1982: https://fred.stlouisfed.org/series/FEDFUNDS
1982-2008: https://fred.stlouisfed.org/series/DFEDTAR
2008-2022: https://fred.stlouisfed.org/series/DFEDTARU
To identify the rising/ falling rates state, we applied the following soft rules with hindsight:
- Rising rates: begin immediately after the FED raises rates for the first time or (before the FED was setting rates) when there’s at least a 0.5% rise in short rates; this period has to last at least 3 months
- Falling rates: begin immediately after the FED lowers rates for the first time or (before the FED was setting rates) when there’s at least a 0.5% decline in short rates; this period has to last at least 3 months
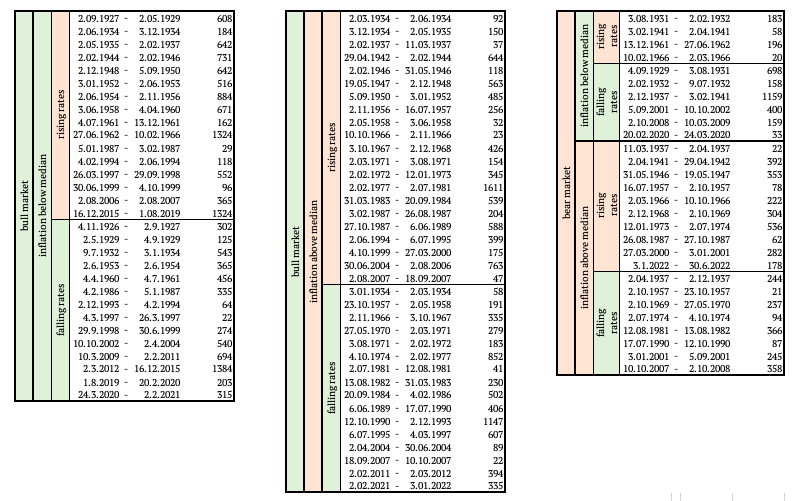
Lastly, we present a summary table, that shows the periods of combinations between bear vs. bull market, high vs. low inflation, and falling vs. growing interest rates – as identified by our rules stated above:
Asset Performance in Various market Cycles
In the sections above, we have identified 6 different market states (growth, rates and inflation) over the last 100 years, giving us 8 different combinations of these states. Now that we have the list of these market cycles, we can start analyzing the performance of various assets over these market states and their combinations.
In today’s article we will focus on traditional assets only – stocks, bonds and commodities. By stocks we mean S&P 500 index, by bonds 10-year US Treasury (constant maturity) and by Commodities a Commodity ETF/Index. In the upcoming articles we will take a look also at many other assets and, more importantly, even at the out-of-sample market states analysis.
Double Combinations
After defining the bull/bear market, low/high inflation, and growing/falling rates, we firstly examined the performance of bonds, stocks, and commodities during mutual combinations of just 2 of these states. The following figure shows the performance of bonds based on bull/bear market and high/low inflation market cycles:
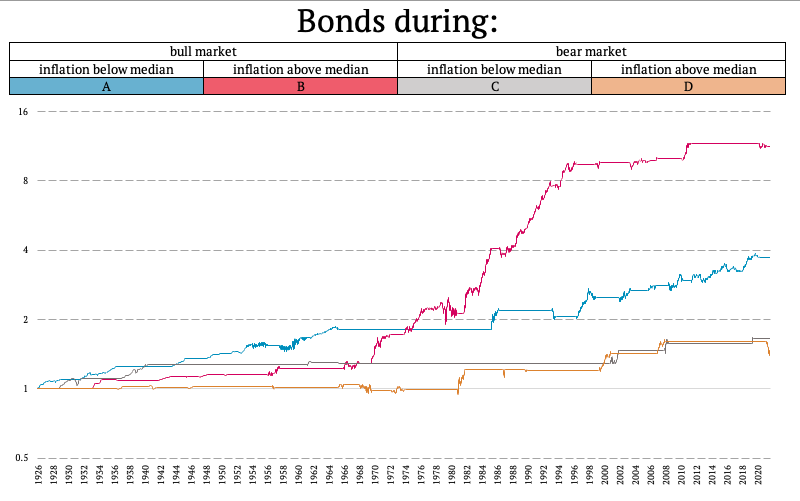
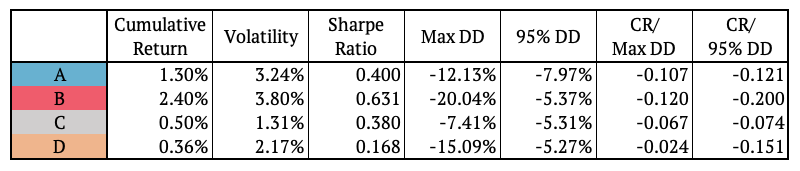
At a first glance it seems that bonds have earned most of their return during the period of high inflation, which may be counterintuitive. But let us remember how we define a period of high inflation – this is an inflation above median (i.e. not only “extreme” inflation). So, yes, the high carry of 1970s and 1980s and the following decline in interest rates actually really caused bonds to earn a substantial part of their 100-year return over the period of 1970-1995.
It may also seem that bonds don’t perform well during equity bear markets. However, if you look at the chart more in detail, bonds generally performed well over bear markets. These periods were just too short to be seen clearly in a 100-year long chart.
The following figure shows the performance of equities over periods of rising/falling rates and high/low inflation market cycles:
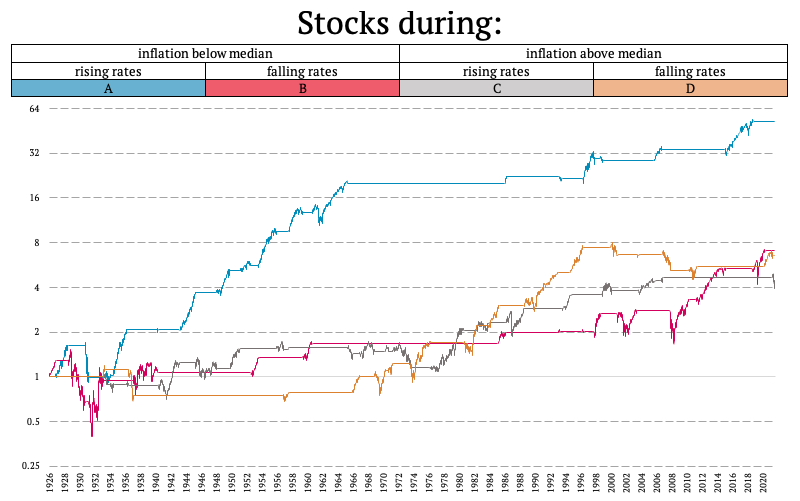
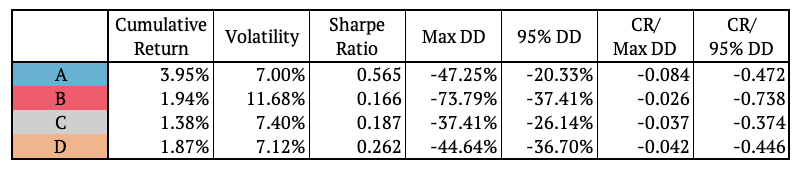
Once again, it may be counterintuitive that equities earned most of their return over the last century during periods of rising rates. And, yes, they actually did. The reason is the spectacular bull run during 1945-1965 during which rates were, generally, rising most of the time.
One may also be curious about why the heaviest equity drawdowns occurred during periods of declining interest rates? Isn’t that supposed to be the opposite? Here, please remember how we define periods of declining rates – such a period starts with a first rate cut. So, yes, the FED usually already anticipates a bear market (or problems in economy) and performs the first rate cut before the biggest drawdowns happen. It then takes some time for markets to digest all these cuts (and FED to perform even more cuts) and only after that markets start rising again. So, yes, the biggest drawdowns in history actually happened when rates were already in decline.
Lastly, we analyzed commodities during bull/bear markets and rising/falling rates.
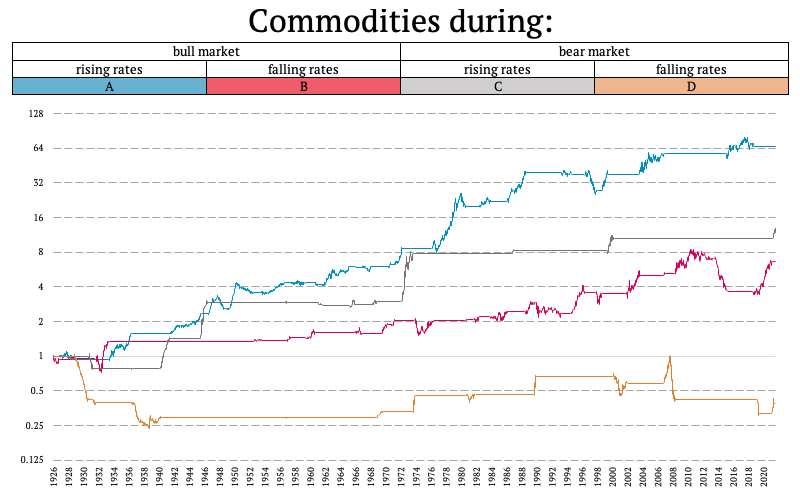
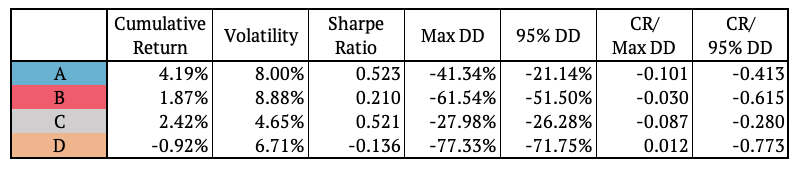
With commodities, the results are much more straightforward. Best periods for commodities include those when rates are already rising and investors are still bullish. Overall return during this market state is high for commodities generally not because this is supposed to be the best period for commodities, but mostly because this is good enough period for commodities and it happened pretty often in the past.
Secondly, notice also the pretty infrequent, yet big, returns of commodities realized over periods of rising rates and equity bear markets. On the other hand, the biggest commodity drawdowns have occurred when rates were falling. And probably the least favorite period to hold commodities is during bear markets when rates are already in decline (someone may recognize this as a “bust” phase after the final “boom” of the cycle).
Triple Combinations
In addition to the double combinations, we also examined the performance of bonds and commodities during the 8 different combinations of the bull/bear market, low/high inflation, and growing/falling rates. The following figure shows the performance of bonds.
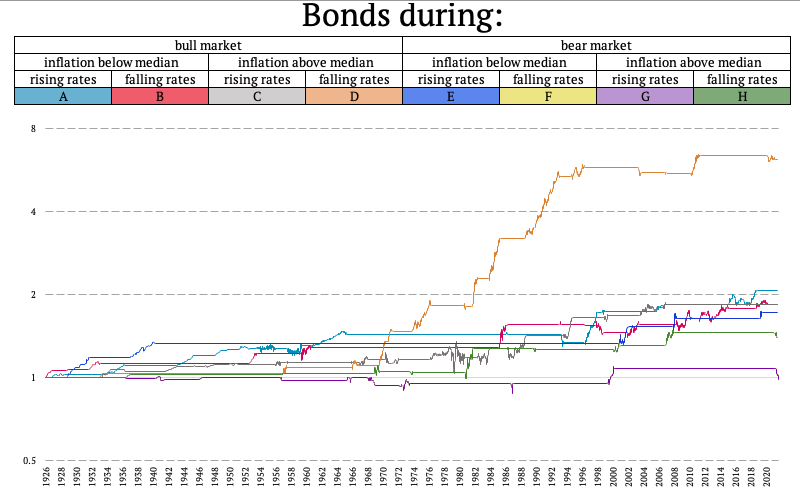
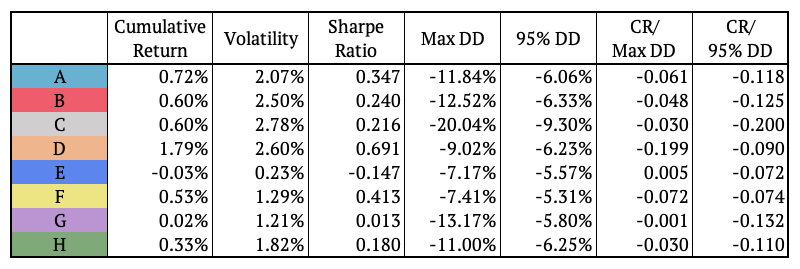
Additionally, we examined commodities during the same 8 combinations of bull/bear market, low/high inflation, and growing/falling rates.
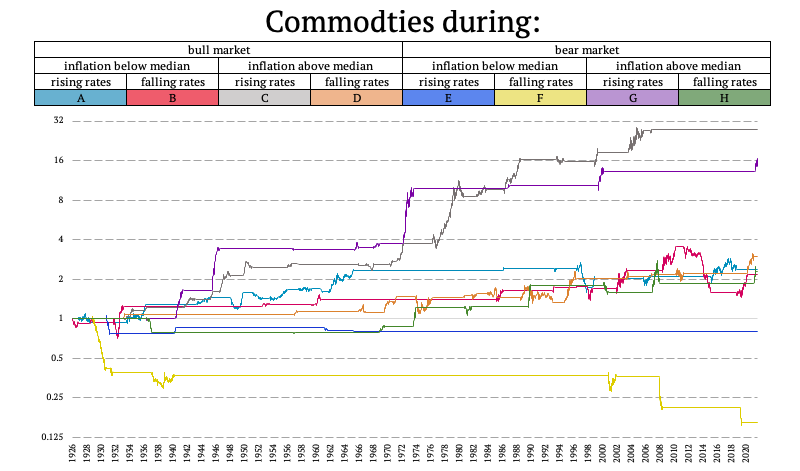
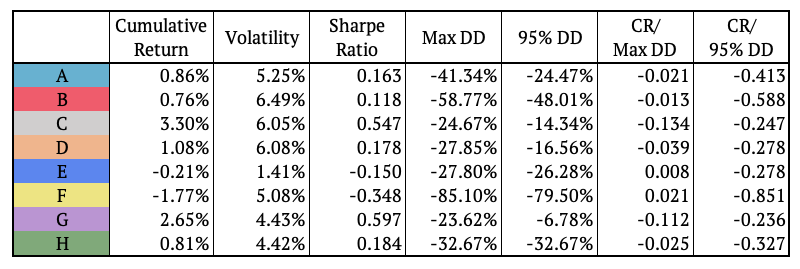
The figure shows that the commodities performed best during equity bull markets when the inflation was above its median, and the rates were rising. Additionally, the second-best performance of commodities is realized during bear markets, high inflation periods, and periods of rising rates. On the other hand, the performance was negative during bear markets when the inflation was below median and the bad performance only intensified when rates were falling.
What’s next?
In this article we back-identified periods of stock bull and bear market, rising and falling short rates and high and low inflation, all with the benefit of hindsight. We created a list of all these periods over the last 100 years, i.e. over the period 1926-2022. Armed with 100 years of daily data, we were then set for multiple interesting analyses to be performed over these market states.
This in-sample analysis is very helpful for examining how different assets perform in various market states. We are able to precisely quantify return and risk of numerous assets in each of the identified market cycle. If someone has a view on the current market cycle they can then easily analyze what were the best and worst performing assets during this market cycle in modern history.
In our upcoming articles, we will firstly look at the performance of different assets during these market states, not only stocks, bonds and commodities – for example a balanced portfolio or a trend-following strategy.
Secondly, how may one be able to tell what market cycle are we currently in? Can we analyze performance of assets in different market states without any hindsight, simply in real time? Yes, we can, and we will present our results in a few weeks. Stay tuned!
Author:
Daniela Hanicova, Quant Analyst, Quantpedia
Are you looking for more strategies to read about? Sign up for our newsletter or visit our Blog or Screener.
Do you want to learn more about Quantpedia Premium service? Check how Quantpedia works, our mission and Premium pricing offer.
Do you want to learn more about Quantpedia Pro service? Check its description, watch videos, review reporting capabilities and visit our pricing offer.
Do you want algorithmic access to the full Quantpedia database via the API? Subscribe to Quantpedia Pro, ask for an API key, and explore the in/out-of-sample statistics, source academic papers, and code snippets — ideal for quantitative research, systematic trading workflows, and AI model training.
Are you looking for historical data or backtesting platforms? Check our list of Algo Trading Discounts.
Or follow us on:
Facebook Group, Facebook Page, Telegram, Twitter, Linkedin, Medium or Youtube
Share onLinkedInTwitterFacebookRefer to a friend


