Does the Image-Based Industry Classification Outperform?
For decades, investors and analysts have relied on traditional industry classifications like GICS, NAICS, or SIC to group companies into sectors and peer groups. However, these rigid categorizations often fail to capture the evolving nature of businesses, especially in an era of technological convergence and rapid industry shifts. Machine learning (ML) offers a more dynamic and data-driven alternative by analyzing company visuals—such as logos, product images, and branding elements—to identify similarities that go beyond predefined classifications. A recent study applies this approach to construct new industry groupings and tests them in industry momentum and reversal strategies. The results show that ML-generated groups lead to superior performance, once again highlighting the potential of image-based classification in financial analysis.
With a massive increase in computation power and, at the same time, a decrease in the costs and availability of GPUs (and TPUs) from a monetary standpoint, wide adoption of machine learning and other artificial intelligence in quantitative finance has become possible. Authors of the paper employ machine vision and unsupervised clustering to determine the relationship between businesses based on their customer-facing product offerings. Presented is an industry categorization that finds peers in a manner analogous to the human brain by comparing picture similarities across companies.
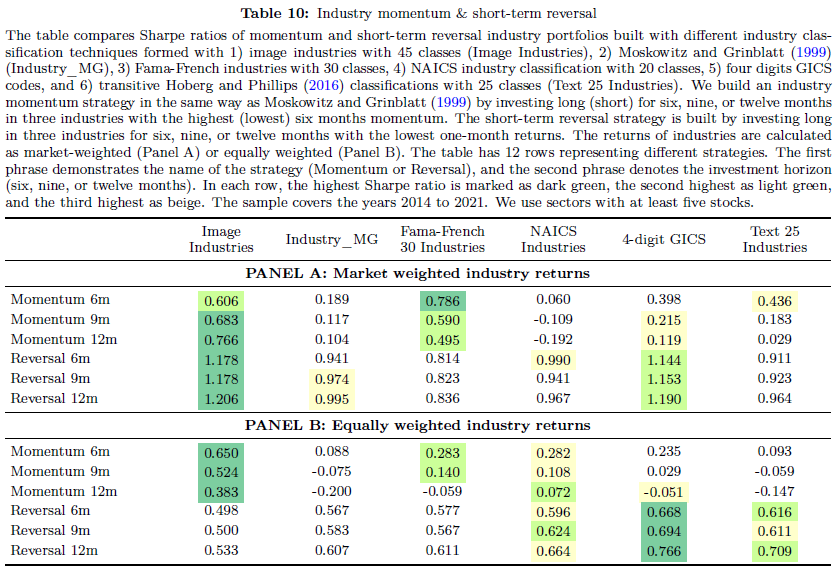
The sectors grouped with the image are valuable for trading strategies that capitalize on investor overreaction as this visual categorization is more effective than the official classification. While more complex to implement for retail traders and more of a curious spectacle, astute readers would find Table 10 intriguing, as it shows what the performance of some common strategies would look like.
The picture enables the construction of industry classifications with distinctive characteristics. It is dynamic, allowing for a rapid reassignment of enterprises across sectors in response to changes in their product offers. However, it also has certain drawbacks, as it does not adequately categorize items that are difficult to communicate visually, such as services, high-tech, finance, and multiproduct conglomerates. Still, the image-based industry momentum technique outperforms most competing industry categorization methods.
Authors: Tomasz Kaczmarek and Kuntara Pukthuanthong
Title: Just Look: Knowing Peers with Image Representation
Link: https://papers.ssrn.com/sol3/papers.cfm?abstract_id=4934624
Abstract:
What does an industry look like? We present a novel approach to assess firm similarity by analyzing four million visuals. Leveraging machine learning, we identify images representing companies’ operations, forming Image Firm Similarities (IFS). IFS mirrors investor-defined peer groups and performs competitively against SIC, GICS, NAICS, and text-based similarity, akin to the brain’s visual processing superiority. This outperformance appears in pair trading, diversification, and industry momentum strategies. The effectiveness of IFS is attributed to dynamic reclassification and high investor agreement within industries, leading to significant demand and supply effects on stock prices. IFS excels in industries with growth and intangibility.
As always, we present several impressive figures and tables:


Notable quotations from the academic research paper:
“Research shows that the human brain can process images in as little as 13 milliseconds, with 90% of information transmitted to the brain being visual. This results in images being processed 60,000 times faster than text, a phenomenon known as the picture superiority effect (Potter, Wyble, Hagmann, & McCourt, 2014).
Our visual processing capabilities are deeply rooted in our evolutionary history. The brain devotes a substantial amount of its energy to visual processing, and the occipital lobe occupies about 20% of its overall capacity.2 To put this in perspective, this is a more significant proportion than what is dedicated to other crucial functions like language processing or decision-making. This disproportionate allocation suggests that our brains are naturally optimized for visual information processing, highlighting the evolutionary importance of vision for human survival and interaction.
Our IFS methodology leverages cognitive processes by using various graphical elements to group visually similar objects and define firm similarities, constituting an intransitive approach to define companies’ peers. Furthermore, our similarity-based clustering algorithm categorizes firms into 45 and 73 transitive classes.3 The distinctions between the 45 and 73 classes lie in the granularity of detail they capture, with more classes providing finer distinctions among firms.4 This dual approach ensures comprehensive and adaptable classifications, accommodating the multifaceted nature of modern enterprises.
The effectiveness of IFS stems from its alignment with the natural tendency of the brain to group visually similar objects, supported by research highlighting the significant impact of visual communication on decision making (Branthwaite, 2002; Dewan, 2015; Shen, Horikawa, Majima, & Kamitani, 2019). This makes IFS particularly relevant in today’s image-centric digital landscape, offering investors a more intuitive and relatable framework for stock categorization, especially in financial markets influenced by short-term fluctuations.
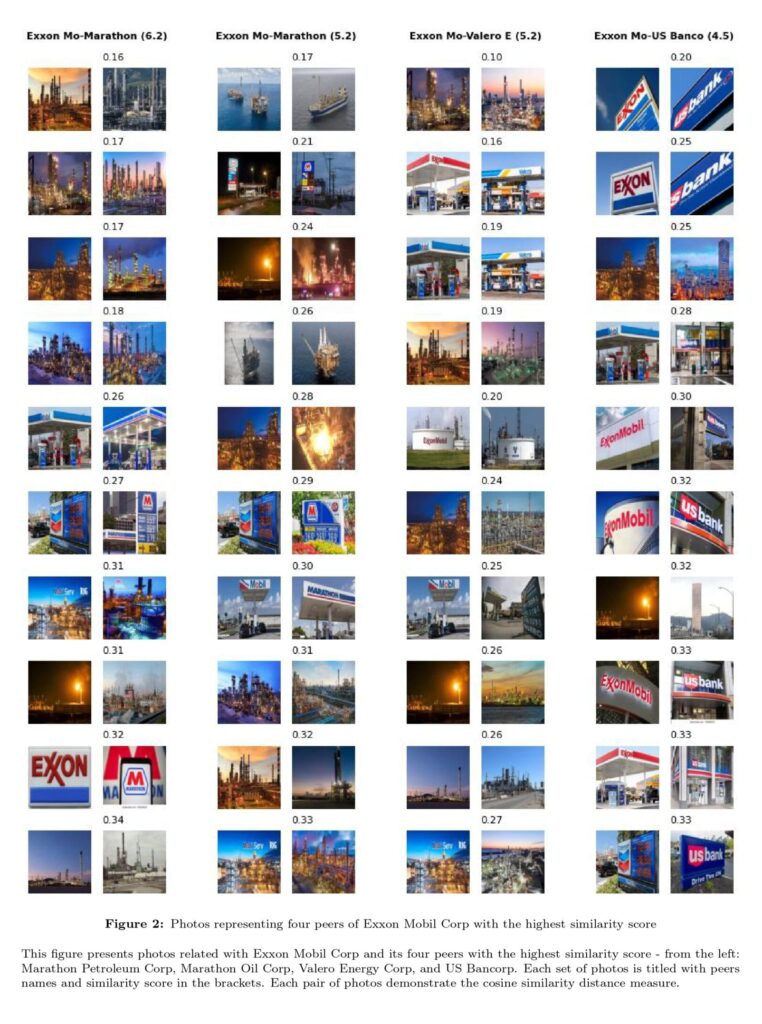
We introduce a novel algorithm for capturing entity similarities based on diverse image representations, particularly for companies depicted through varied visuals.7 Employing Deep Convolutional Neural Net- works (VGG19 model), transfer learning, and object recognition techniques, we analyze a large-scale image dataset to establish a statistically significant, visually based similarity measure. IFS utilizes various graphical representations, including product images, supply chain elements, raw materials, and other business-related visuals. This advanced technique is chosen due to the complex nature of our task, where companies are rep- resented by diverse visuals, often including elements not directly related to their core business. Traditional methods struggle with this complexity, but our approach mimics the human brain’s ability to process and categorize visual information rapidly and accurately.
Our pair trading strategy invests in companies with similar profiles defined through imagery, text (HP), and peer analysts (KR). It ranks firms according to their earnings per share and sales growth, longing high- growth firms, and shorting low-growth ones. Sharpe and Calmar ratios consistently indicate the highest performance of our image-based similarity metric.
More investor agreement within an industry leads to more significant influences of aggregated demand and supply on stock prices, making that industry categorization more advantageous for investment applications. We demonstrate that IFS provides the highest agreement within industries, explaining its benefits in pair trading, diversification, and momentum strategies.
Our Image Firm Similarities (IFS) technique and the Hoberg and Phillips (HP) approach offer both transitive and intransitive methodologies. Previous research compares the informativeness of different clas- sification systems. Kahle and Walkling (1996) examine SIC codes from the Center for Research in Security Prices (CRSP) and Compustat databases, while Fama and French (1997) create new industry classifications by grouping existing four-digit SIC codes. Krishnan and Press (2003) compare SIC codes to NAICS codes and Bhojraj et al. (2003) evaluate various classifications of the fixed industry. While these studies provide valuable insights into using existing static classifications, they do not explore fundamental improvements to the underlying methodology of industry categorization.
In summary, while IFS offers a powerful and intuitive approach to industry classification through visual data, other intransitive methods provide valuable complementary strengths. The choice between these approaches depends on the specific research or investment application, the nature of the industries studied, and the availability of different types of data. IFS excels in dynamic adaptability and rich data representation, making it particularly effective for capturing the dynamic nature of modern industries. However, other intransitive approaches offer higher granularity and broader applicability, making them suitable for a more comprehensive range of business and long-term analyses.
Figure 1 demonstrates that the comparison is grounded in the extraction of numerical representations from each image, a task accomplished through the application of the VGG19 model (Si- monyan & Zisserman, 2014). The VGG19, a convolutional neural network (CNN) model pre-trained on the ImageNet dataset, is renowned for its effectiveness in image recognition tasks. Its architecture, designed for deep image processing, consists of 19 layers, including 16 convolutional layers, three fully connected layers, five max-pooling layers, and a softmax output layer to classify images into 1000 categories.”
Are you looking for more strategies to read about? Sign up for our newsletter or visit our Blog or Screener.
Do you want to learn more about Quantpedia Premium service? Check how Quantpedia works, our mission and Premium pricing offer.
Do you want to learn more about Quantpedia Pro service? Check its description, watch videos, review reporting capabilities and visit our pricing offer.
Are you looking for historical data or backtesting platforms? Check our list of Algo Trading Discounts.
Would you like free access to our services? Then, open an account with Lightspeed and enjoy one year of Quantpedia Premium at no cost.
Or follow us on:
Facebook Group, Facebook Page, Twitter, Linkedin, Medium or Youtube
Share onLinkedInTwitterFacebookRefer to a friend


