Trump’s Executive Orders and Their Impact on Financial Markets
In recent months, financial markets have experienced heightened volatility as Donald Trump, in his second term as President of the United States, increasingly uses executive orders to steer economic policy. While he also made use of this presidential power during his first term (2017–2021), the volume and impact of executive actions have notably intensified. In this analysis, we explore how markets reacted to Trump’s executive orders in his first presidency compared to the current term, aiming to uncover patterns and draw meaningful conclusions from both periods.
The last few years have been full of unexpected events – COVID-19, Russia’s invasion of Ukraine, elevated inflation, etc. Unsurprisingly, the US stock market price action has been characterized by elevated volatility and increased uncertainty. This environment reflects a combination of macroeconomic pressures — slowing economic growth, persistent inflation, rising interest rates — as well as geopolitical tensions. The US Government tries to react to all of these challenges, and one favorite mechanism used mainly by US President Donald Trump is Executive Order.
Executive Orders are legally binding directives from the President to federal agencies and departments, and unlike legislation passed through Congress, Executive Orders can be enacted unilaterally by the President, allowing for fast and direct intervention in specific areas of the economy or regulation. As a result, they often signal the immediate policy priorities of the current administration and can have direct implications for financial markets — particularly in sectors sensitive to regulation or government spending.
For the purposes of this study, data on Executive Orders represents an attractive proxy for measuring policy intervention over time. The main advantage of this data is its accessibility, transparency, and the ability to quantify political activity in a consistent manner. In this analysis, we use Executive Order data as a simple, observable indicator of government policy intensity and explore its relationship with market behavior and volatility.
Methodology
To examine whether the US stock market reacts to the signing of a new Executive Order, we analyzed the daily behavior of a representative market ETF, specifically the SPDR S&P 500 ETF Trust (SPY). The list of Executive Orders is publicly available, for example, on Wikipedia. Since our aim is to study how newly signed Executive Orders may influence the market in the days following their announcement, it is necessary to focus on periods when a single president was in office for an extended time. The current president of the United States is Donald Trump, who previously served as president from 2017 to 2021 and was re-elected in 2024 (and starting his 2nd term in January 2025). We therefore began our analysis with his first presidency, and subsequently extended it to his current term, for which the most recent data is available.
For all of the ETF historical data, we used data from EODHD.com – the sponsor of our blog. EODHD offers seamless access to +30 years of historical prices and fundamental data for stocks, ETFs, forex, and cryptocurrencies across 60+ exchanges, available via API or no-code add-ons for Excel and Google Sheets. As a special offer, our blog readers can enjoy an exclusive 30% discount on premium EODHD plans.
The first presidency of Donald Trump 2017-2021
During the first presidency, Donlad Trump served in office from January, 2017 to January 2021. Let’s now take a look at the Executive Orders signed during this period.
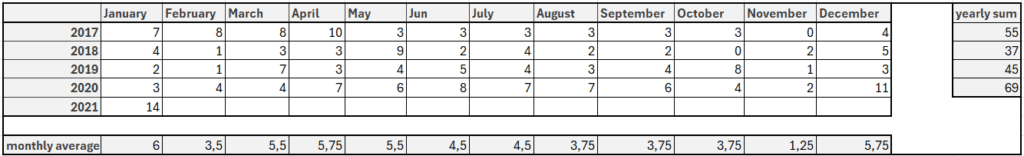
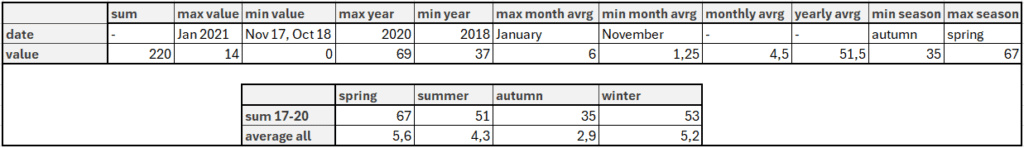
As we can see, it’s very difficult to predict when and how many Executive Orders will be signed. It’s natural that the number of orders tends to be higher during the first and at the last year of a president’s term. Moreover, in 2020 and 2021, the Covid-19 pandemic was a global issue and the government had to respond with additional measures. However, we see some clear patterns.
Firstly, in his 1st term, Trump issued, on average, just 4.5 Executive orders in a month, with a maximum of 14 in the last month of his presidency. It’s important to remember this statistic when analyzing his 2nd presidency.
During this period the stock market (SPY) performed as follows.
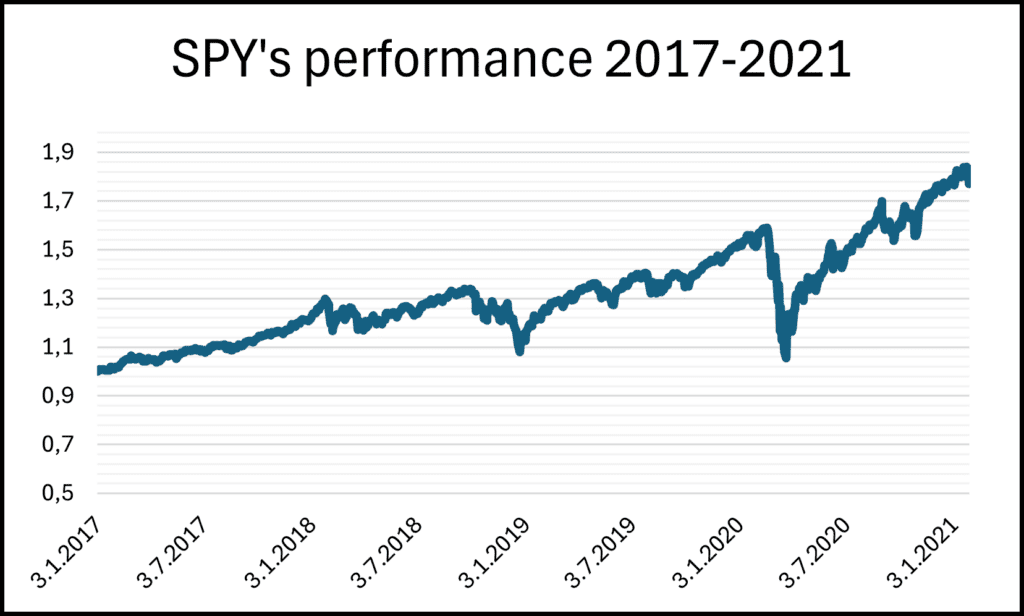
Although SPY has a tendency to grow, a significant drawdown in the first half of 2020 is visible at the first glance. This decline can be attributed to the market’s reaction to the pandemic during this period. However, 2020 was also marked by an unprecedented monetary and fiscal response. The Federal Reserve reacted aggressively by cutting interest rates and launching large-scale asset purchases, while the government introduced massive fiscal stimulus programs. These measures stabilized the markets, supported economic activity, and ultimately helped equities to recover and finish the year in positive territory.
Regarding the Executive Orders, SPY didn’t remain unaffected. Similar to the turn-of-the-month effect, we focused on average SPY returns around the days when Executive Orders were signed. Specifically, we analyzed SPY returns 1, 2, and 3 days before the Executive Order was signed, as well as 1, 2, and 3 days after. For comparison, we also calculated the average daily return of SPY over the entire sample period.
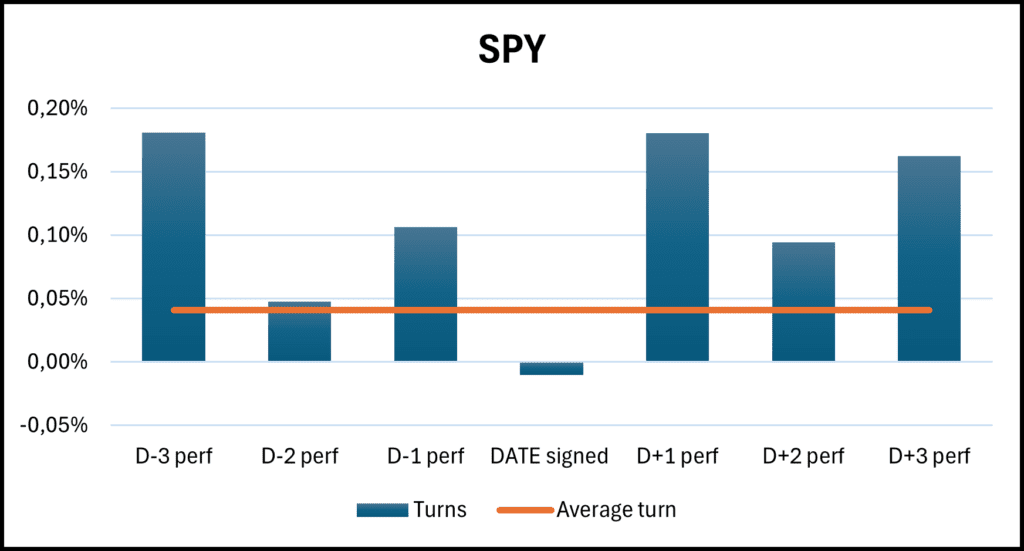
The only day from the turn analysis that indicates a declining tendency is the day when the Executive Order was signed. It is also the only day when the average return was lower than the overall average daily return of SPY. In contrast, the other days tend to outperform the average. However, we will focus primarily on the days following the signing of the Executive Order. Since the exact day of signing is essentially a random event from the market’s perspective, returns before the signing cannot be considered a reliable indicator. Therefore, we focused only on the days after.
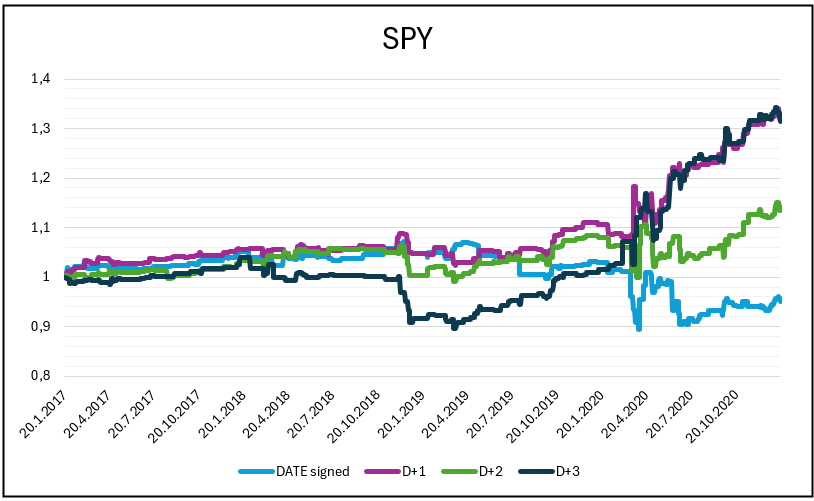
From 2017 to the end of 2019, there was no significant difference between the days D0 to D+3. However, since 2020 we can observe a strong outperformance of the day following the Executive Order compared to the day of signing itself. To better illustrate this pattern, we will focus only on the days when Executive Orders were signed and the days immediately after.
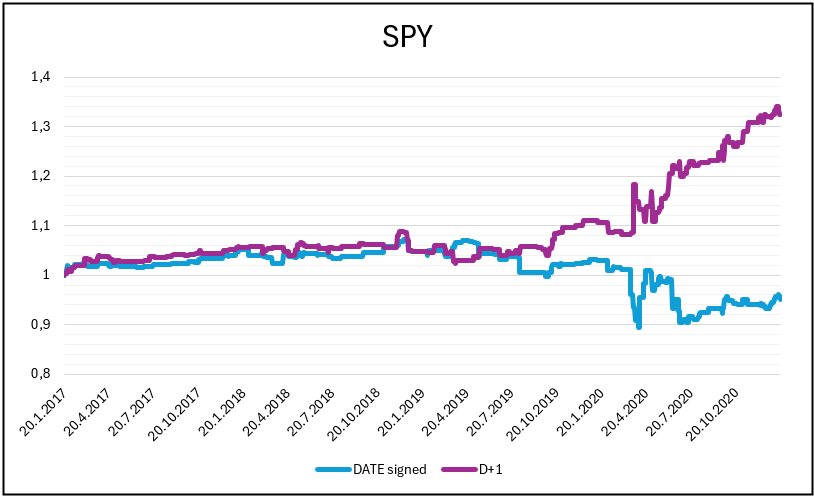
When looking at the performances before 2020, the difference between the day of signing and the following day is minimal. This suggests that markets did not immediately react to the Executive Orders themselves. The most visible reaction can be observed in the post-Covid period. This is mainly driven by the fact that Executive Orders, together with actions taken by the Federal Reserve, aimed to stabilize the economy and support financial markets — which became a key element of economic policy at that time. The situation influenced not only the US stocks, but also other market fields.
To extend our analysis beyond the US market, we also examined the performance of EEM ETF (representing emerging markets) and FEZ ETF (representing the Eurozone) on the day of signing and the following day.
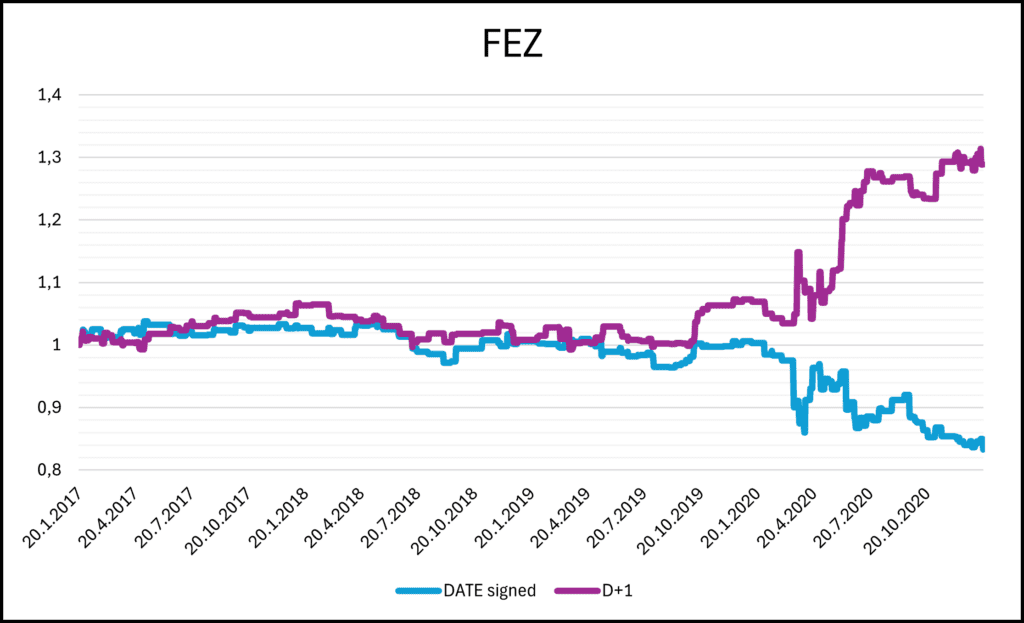
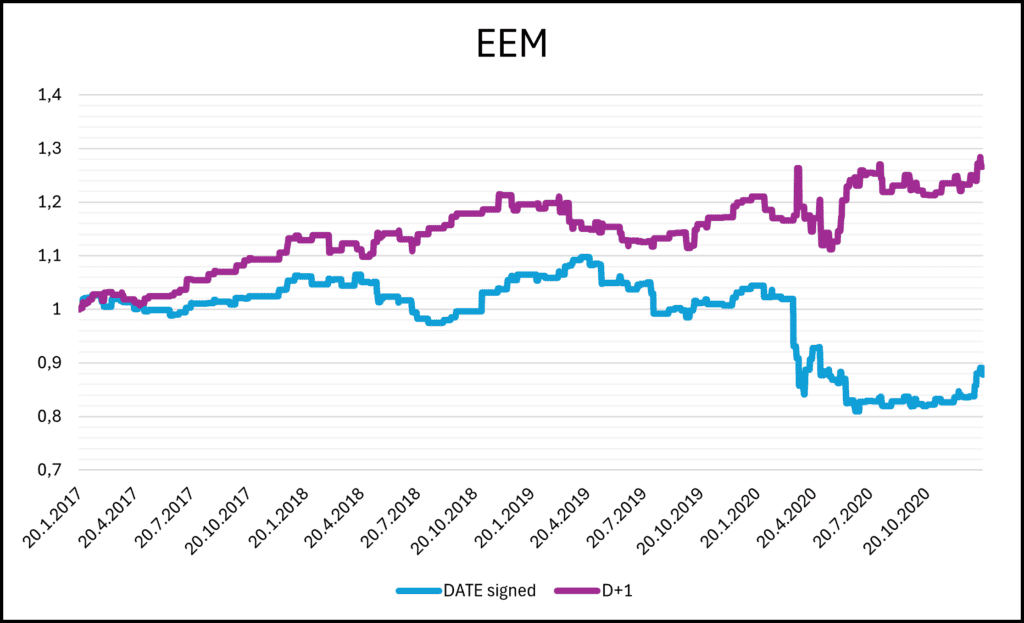
Interestingly, EEM and FEZ ETFs reacted positively after Executive Orders were signed — despite the fact that Donald Trump’s policy was primarily focused on supporting the US economy and was often perceived as less favorable towards other regions. This suggests that the stabilizing efforts of Executive Orders were not limited to domestic markets, but also provided a positive signal for global investors.
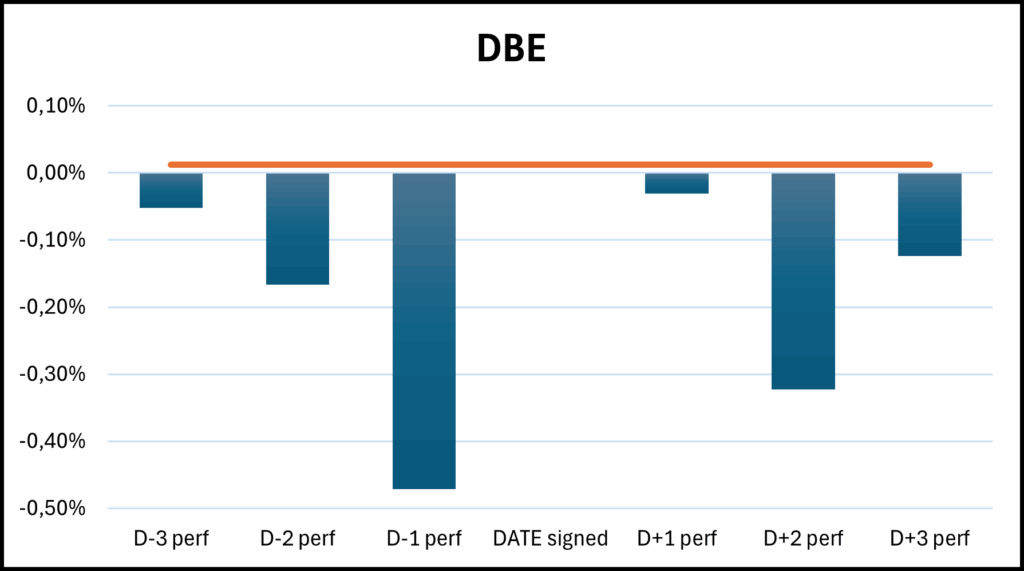
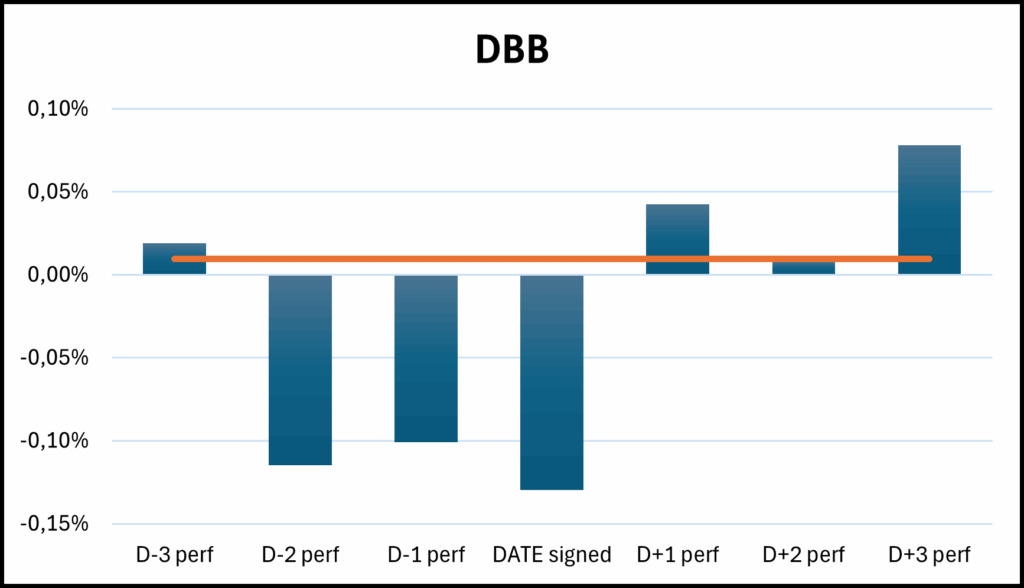
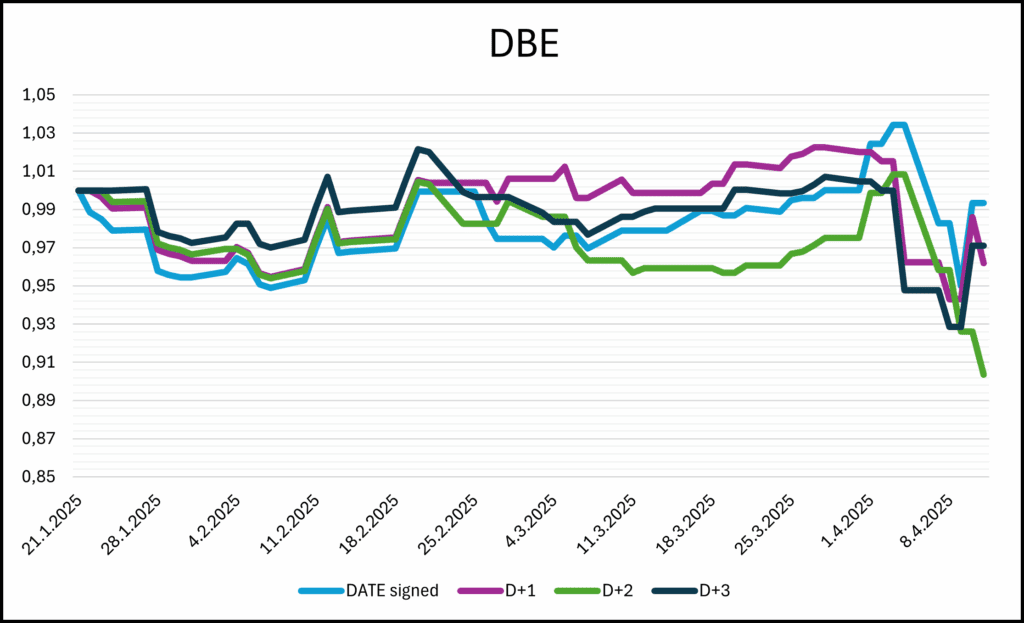
And what about commodities? To explore this, we take a closer look at the Base Metals Fund (DBB) and the Energy Fund (DBE).
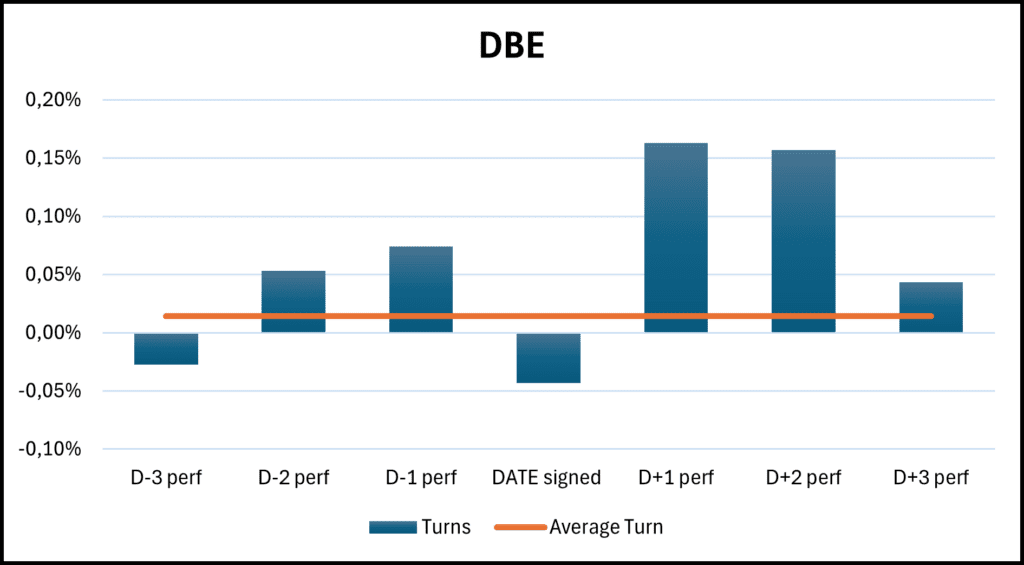
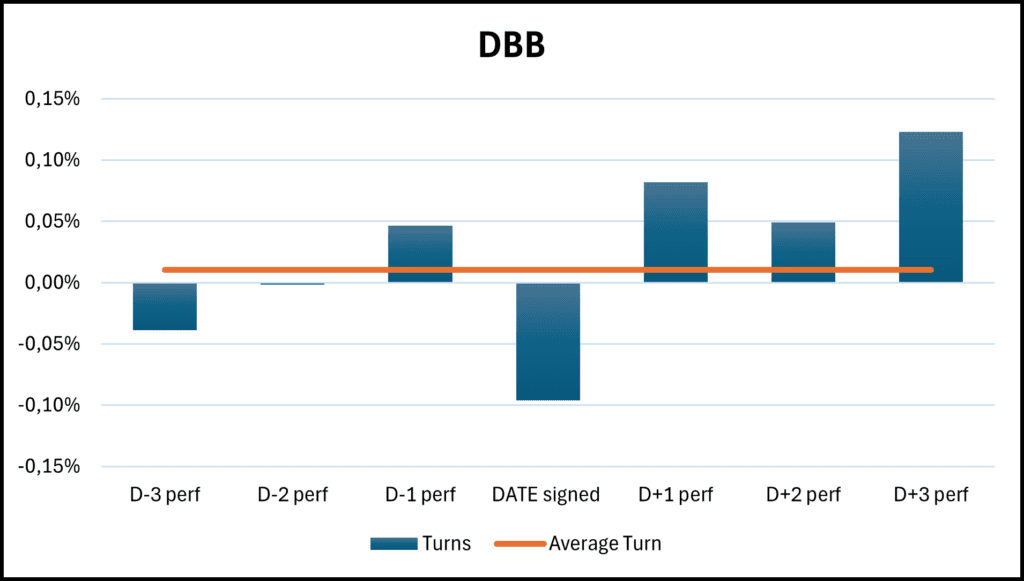
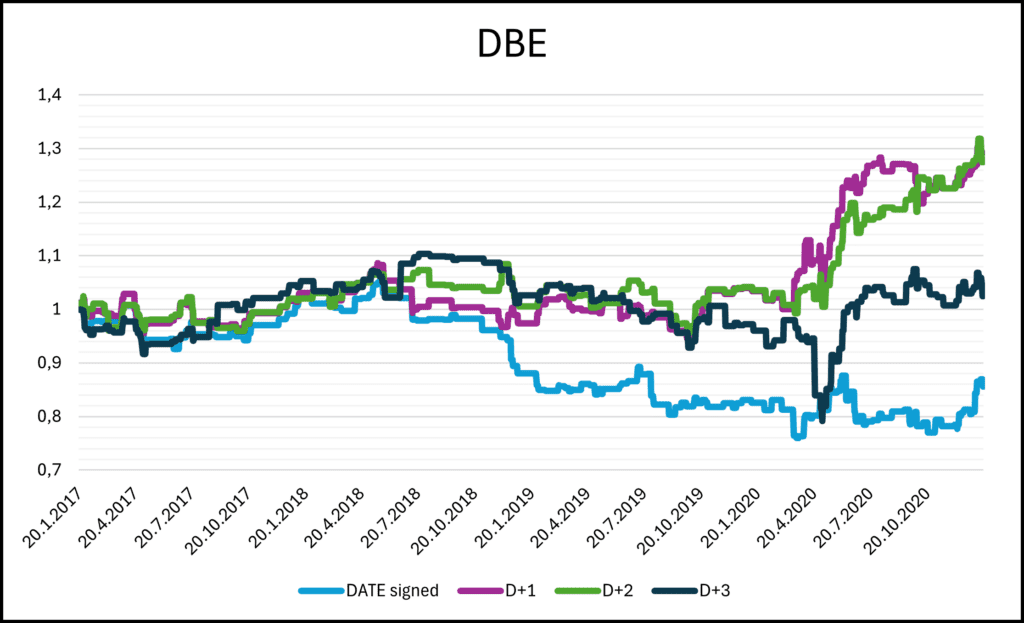
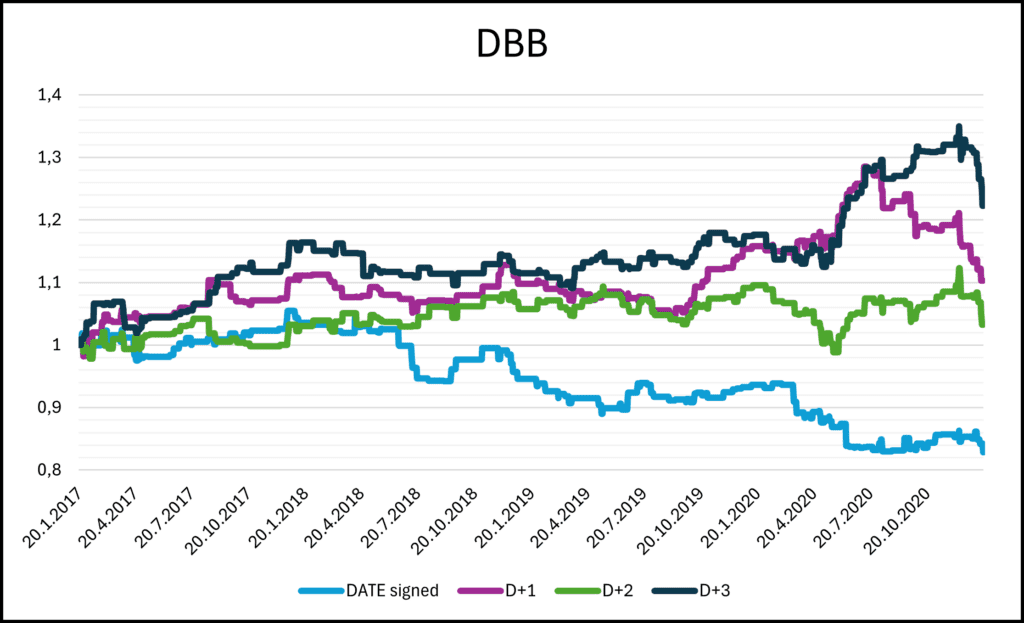
From both Figure 7 and Figure 8 we can clearly see strong support for base metals and energy sectors, which is not particularly surprising given the nature of the Executive Orders and the economic environment at that time. Additionally, Donald Trump is known for his support of anti-ESG politics and support of drilling and mining industries. What is somewhat surprising, however, is the fact that the very day the Executive Order was signed tends to show negative performance. Nevertheless, in the days following the signing, these sectors reacted strongly and positively, suggesting that while the initial market reaction might be cautious or uncertain, investors quickly reassessed the situation and price in the supportive impact of the newly announced policies. No significant trends were found in other commodity sectors (like DBA ETF for agriculture or DBP ETF for precious metals).
The second presidency of Donald Trump – first months of 2025
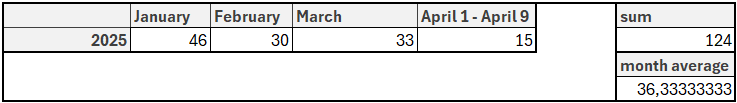
The second presidency of Donald Trump is markedly different from the first. In just the first four months, more Executive Orders have been signed than during the entire first two years of his initial term. The monthly average is now nine times higher.
But that’s not the only concern. On April 2, 2025, Trump signed an Executive Order titled “Regulating Imports with a Reciprocal Tariff to Rectify Trade Practices that Contribute to Large and Persistent Annual United States Goods Trade Deficits,” which is a true game-changer for global markets. Observations and patterns from the 2017–2021 period are no longer applicable.
A key concern for investors is that reciprocal tariffs significantly increase uncertainty in global trade. They can trigger trade wars, raise costs for companies dependent on imports, and disrupt global supply chains. This puts pressure on corporate profits, fuels market volatility, and negatively impacts sectors such as manufacturing, retail, and technology—all of which heavily rely on international trade. The effects are already visible in asset performance.
Nevertheless, we were interested in applying the same analysis as we did during the first term. To begin with, we take a closer look at SPY’s performance in the days leading up to, on, and following the day the Executive Order was signed.
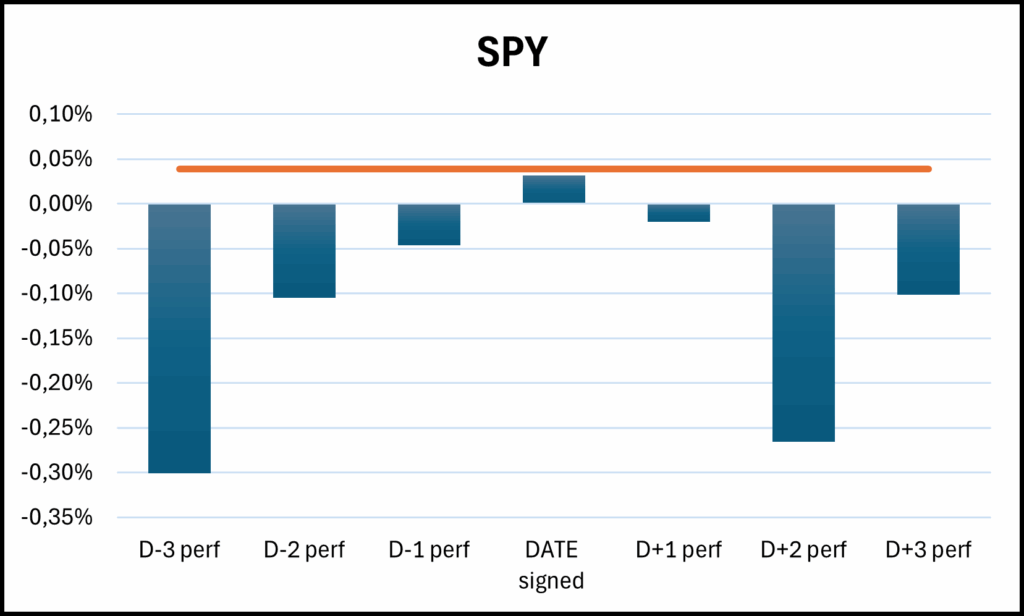
At first glance, there is a clearly visible negative reaction to the signing of the Executive Order—unlike during Trump’s first term. This suggests that the stock market is now reacting in a completely opposite way compared to the first presidency. Whereas similar announcements were previously met with optimism or indifference, they now trigger heightened concern and selling pressure.
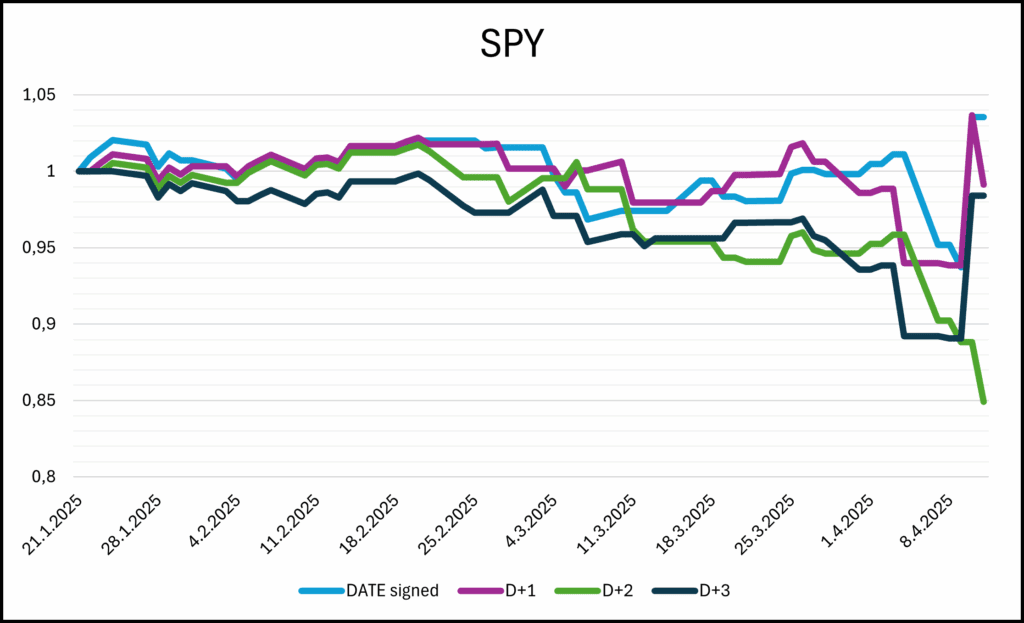
Focusing on the equity curves, we observe a downward trends across all days, with the decline becoming more pronounced starting in early April. This timing strongly suggests that the drop may be directly linked to the Executive Order on tariffs.
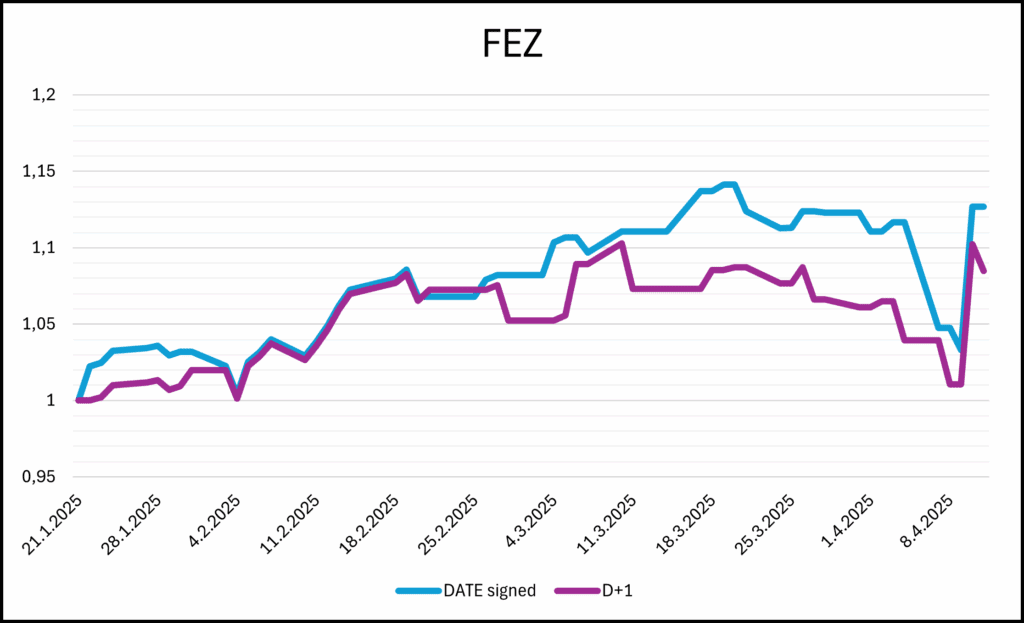
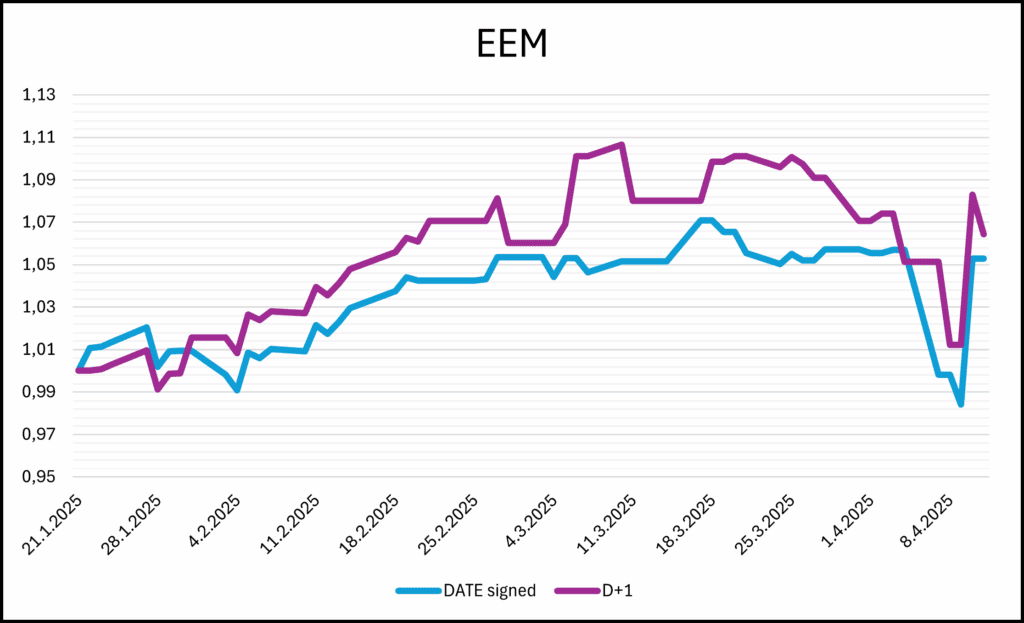
It appears that the Eurozone and Emerging markets have not been as significantly impacted as SPY. While it’s difficult to draw direct comparisons to the first term due to the shorter time frame we are analyzing, we cannot conclude that their reaction is not negative, unlike SPY’s. This is somewhat surprising, as it stands in stark contrast to the verbal direction of Trump’s policy – the America First.
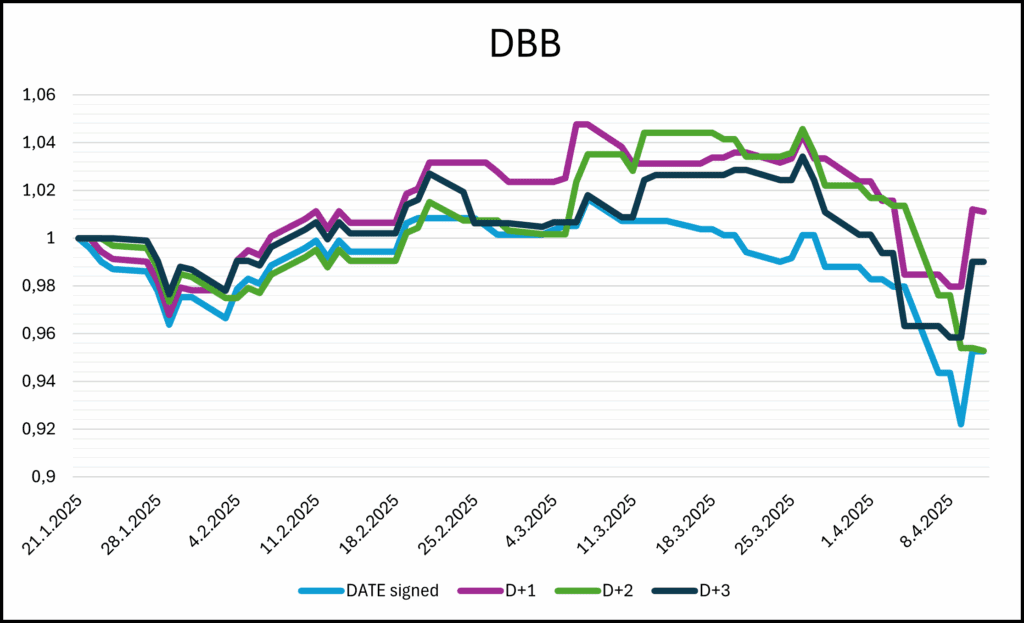
Commodities show a similar reaction to the stock market, with average returns on specific days being negative and therefore lower than the daily average.
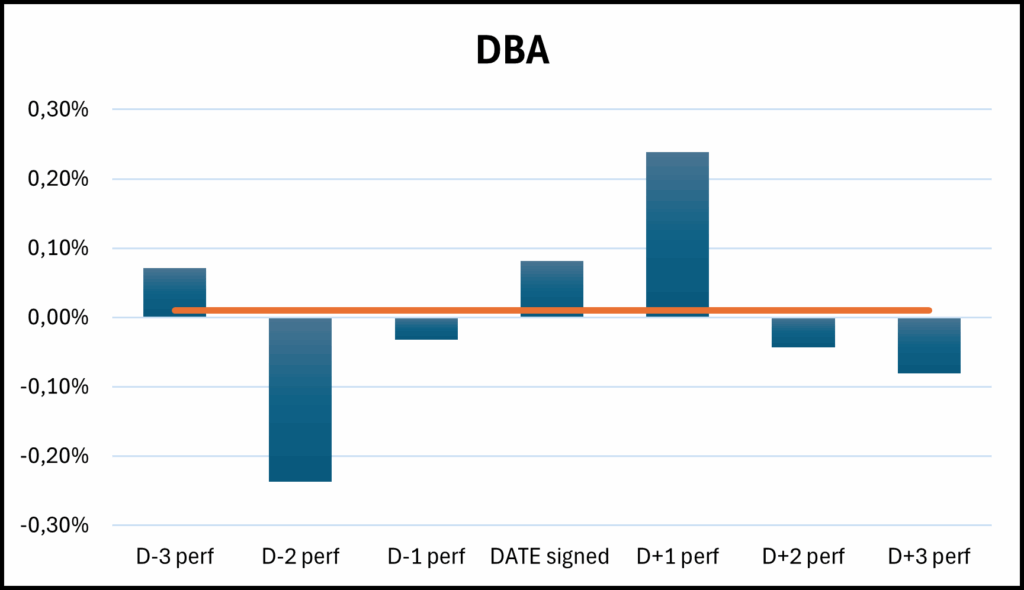
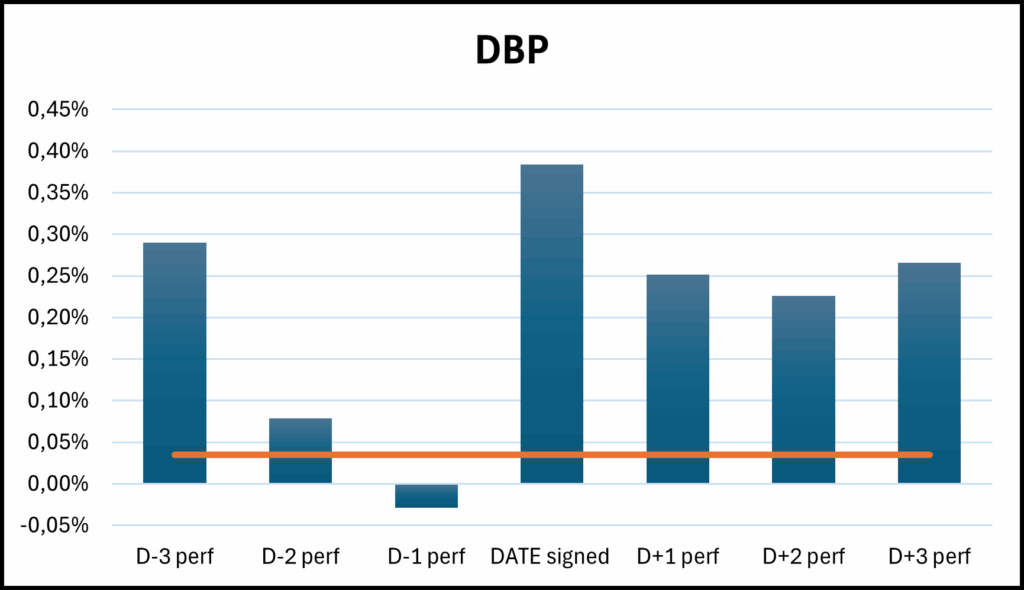
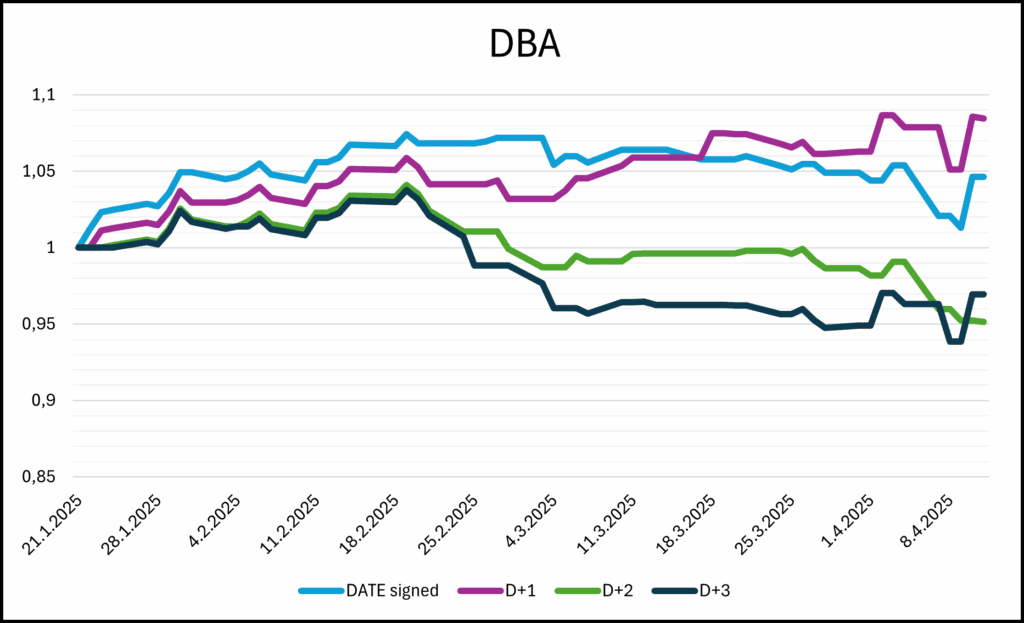
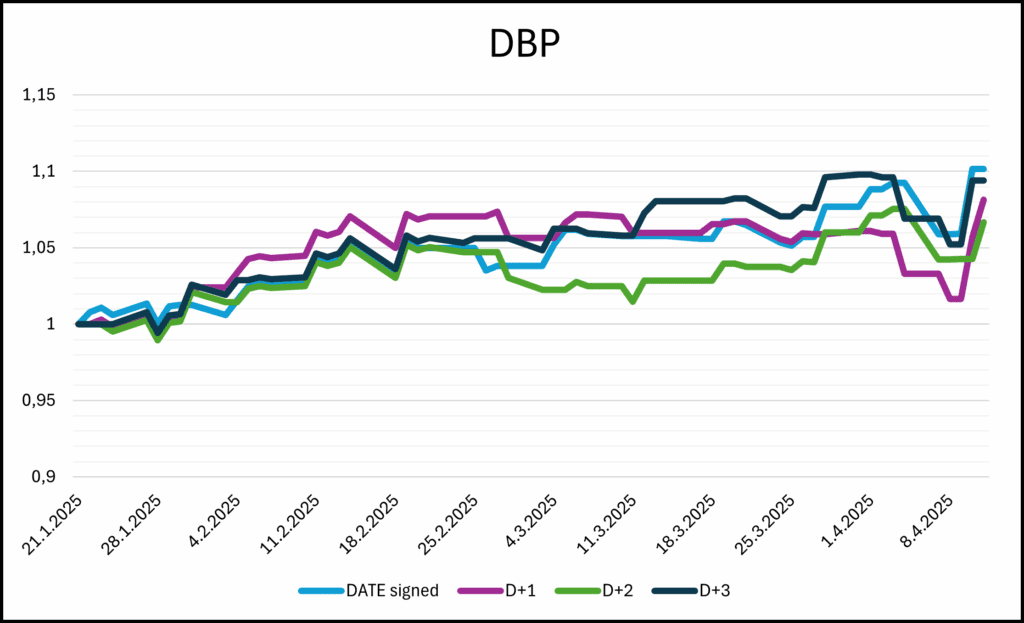
This time, we also focused on other commodity sectors, specifically the Agriculture Fund (DBA) and the Precious Metals Fund (DBP). As observed, the average return on the day of signing is positive for both, outperforming the daily average. With a leader in gold, the precious metals ETF reacts very strongly to Trump’s new executive order as it is one of the few corners of the market in which traders can hide when volatility strikes.
Conclusion
Unfortunately, as we’ve seen, it’s quite difficult to draw direct parallels between Donald Trump’s first term and the current situation. One key reason is the notably more aggressive pace of executive orders this time around—especially the one targeting foreign tariffs. Although that particular order has been temporarily paused, there are still questions about how the whole situation around tariffs will develop. We’ll be closely monitoring how this develops and will continue to update our research as new policies and signals emerge.
Author: Sona Beluska, Junior Quant Analyst, Quantpedia
Are you looking for more strategies to read about? Sign up for our newsletter or visit our Blog or Screener.
Do you want to learn more about Quantpedia Premium service? Check how Quantpedia works, our mission and Premium pricing offer.
Do you want to learn more about Quantpedia Pro service? Check its description, watch videos, review reporting capabilities and visit our pricing offer.
Are you looking for historical data or backtesting platforms? Check our list of Algo Trading Discounts.
Would you like free access to our services? Then, open an account with Lightspeed and enjoy one year of Quantpedia Premium at no cost.
Or follow us on:
Facebook Group, Facebook Page, Twitter, Linkedin, Medium or Youtube
Share onLinkedInTwitterFacebookRefer to a friend


