A New Look on Shiller’s CAPE Ratio
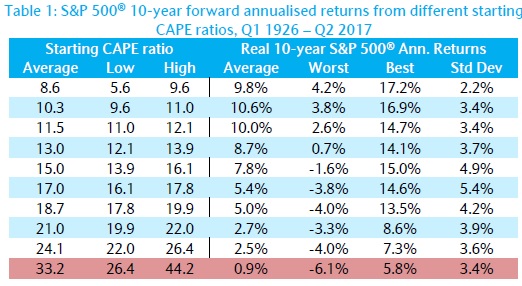
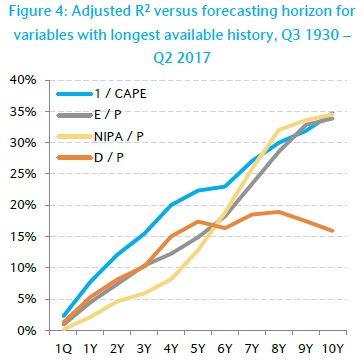
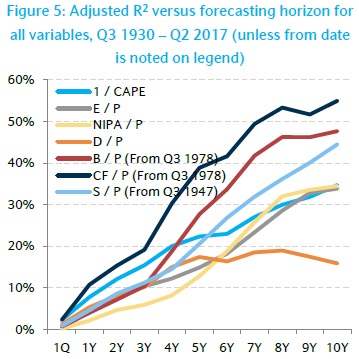
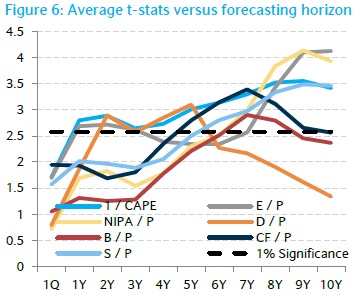
Robert Shiller and Farouk Jivraj discuss a validity of methodology for Campbell &Shiller’s CAPE ratio calculation, share their opinion on future returns of US equities and give few novel ideas for CAPE’s usage for asset allocation and country and sector picking: Authors: Jivraj, Shiller Title: The Many Colours of CAPE Link: https://papers.ssrn.com/sol3/papers.cfm?abstract_id=3258404 Abstract: Campbell & Shiller’s [1988] Cyclically-Adjusted Price to Earnings ratio (CAPE) has both its advocates and critics. Currently, the debate is on the validity of the high CAPE ratio for US stock markets in forecasting lower future returns, with CAPE currently at 31.21. We investigate the efficacy and validity of CAPE from several different perspectives. First, we run multiple-horizon predictability regressions for CAPE versus its peers and find that CAPE consistently displays economic and statistical significance far better than any of its peers. Second, we explore alternative constructions of CAPE based on other proxies for earnings motivated by the work of findings by Siegel [2016] using NIPA profits. We find that original CAPE is still best when comprehensively and fairly reviewing the other proxies, even for NIPA profits. Third, we assess how to practically use CAPE in both an asset allocation and relative valuation setting. We demonstrate a novel use of CAPE for asset allocation programmes as well as discuss relative valuation exercises for country, sector and single stock rotation. Notable quotations from the academic research paper: “Campbell & Shiller’s Cyclically-Adjusted Price to Earnings ratio (CAPE), is a well known to characterize the strong relationship between an inflation adjusted earnings-to-price ratio and subsequent longterm returns. As a result, it has now become an often cited measure of equity market valuation. With such a status, the current value of CAPE, 31.12 (as in 10/2017), is causing concern amongst investors and spurring debate among academics – it is currently in 96th percentile compared to its own history since 1881. Thus, the question of whether the US stock market is overpriced, is being hotly contested and CAPE is at the centre of this debate.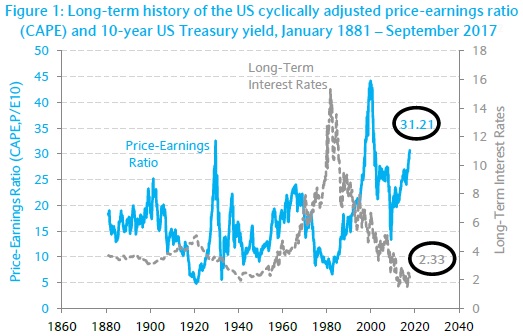 Table 2 shows, that historically, at such a starting level, by deciles, we’re in the worst possible bucket where on average subsequent annualised real returns over next ten years were a mere 0.9%, with the best case being a not bad 5.8% but the worst case being a very bad -6.1%
| What about Data? Look at Quantpedia’s Algo Trading Promo Codes. |
 ”
”
Are you looking for more strategies to read about? Sign up for our newsletter or visit our Blog or Screener.
Do you want to learn more about Quantpedia Premium service? Check how Quantpedia works, our mission and Premium pricing offer.
Do you want to learn more about Quantpedia Pro service? Check its description, watch videos, review reporting capabilities and visit our pricing offer.
Are you looking for historical data or backtesting platforms? Check our list of Algo Trading Discounts.
Would you like free access to our services? Then, open an account with Lightspeed and enjoy one year of Quantpedia Premium at no cost.
Or follow us on:
Facebook Group, Facebook Page, Twitter, Linkedin, Medium or Youtube
Share onLinkedInTwitterFacebookRefer to a friend


SUBSCRIBE TO NEWSLETTER AND GET:
- bi-weekly research insights -
- tips on new trading strategies -
- notifications about offers & promos -

Subscribe