A Primer on Grid Trading Strategy
Grid trading is an automated currency trading strategy where an investor creates a so-called “price grid”. The basic idea of the strategy is to repeatedly buy at the pre-specified price and then wait for the price to rise above that level and then sell the position (and vice versa with shorting and covering). We will explore the basics and show favorable and unfavorable scenarios in the first article about this trading style. Later articles will dig deeper and investigate how Grid trading is related to other systematic trading strategies.
How Does Grid Trading Work?
In a grid trading, a trader first sets his starting reference price. Multiple buy orders at once are then placed below this reference price at various (usually even) levels set by the grid. Sell orders are then paired with each buy order and are set above the prices in buy orders. The same can be (and usually is) done with the short side, creating a grid of short and cover orders.
An investor needs to set several parameters to automate the system. These parameters include the highest price, the lowest price, grids themselves, position sizing and stoplosses.
The highest price and the lowest price of the grid are usually set based on the recent historical price range, i.e. between the market’s recent highest and lowest prices in a set period. The parameters are thus based heavily on the past volatility of the currency pair.
Next, the grid tells us how many pending orders are placed within the set price range. When setting the grid, we have to take into account the transaction fees. The grid should not be too dense; otherwise, the profit may not be high enough to cover the transaction fees. Lastly, the position size is the money amount or account fraction a trader uses to perform grid trading.
Favorable scenario
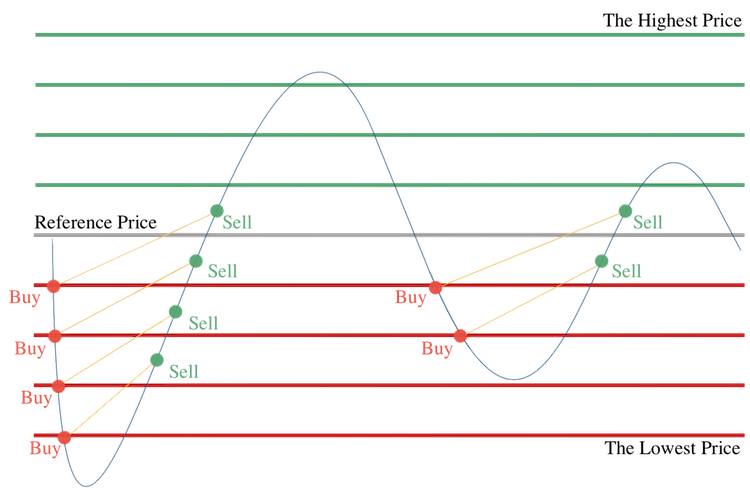
The following picture shows a favorable scenario of a grid trading strategy. We start at the grey line, which represents our starting price. We place the first buy order when the traded currency reaches the first red line (grid). Because the price of the currency pair decreases, we place the second, third and fourth buy order as we reach the second, third and fourth red line (grid). Because we passed our pre-set lowest price, we do not place any more buy orders, even though the trading currency decreases further. As the currency increases, we start to place sell orders. We place a sell order when the price increases to one and a half grid length from the price where we placed the buy order.
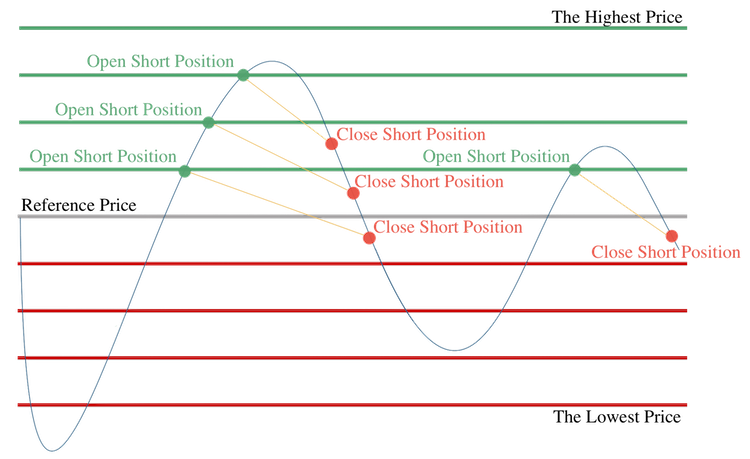
Additionally, we can do inverse actions as the value of the traded currency increases and reaches the green lines. For example, we can open a short position each time we pass a green line and close it when the currency decreases to one and a half grid length from the price where we opened the short position, as illustrated in the following picture.
As you can see, this type of strategy relies on the assumption that the prices will oscillate during the day. Thus, if the price only went down (/up), we would not be able to close the position in profit and would eventually lose (unlimited amount of) money.
Additional parameters
To prevent unlimited losses as mentioned above, more parameters (/settings) can be added to the model. One of the most typical ones is the “Stop Loss Price”. This price has to be lower than the lowest price. If the trading currency price falls to the Stop Loss Price, the system will trigger a stop-loss operation which sells all open buy positions in an account. This operation prevents higher losses caused by falling prices of traded currencies.
Another popular option includes setting also the trigger price. A switch, which allows trading to be turned on only when the market price of the trading currency reaches the trigger price.
Moreover, there are two grid types: arithmetic and geometric. When applying the arithmetic grid, each grid generates the same profit, for example, $10. Therefore, this grid type is more suitable for smaller price ranges. On the other hand, the geometric grid, which is more suitable for larger price ranges, generates the same rate of return (for example, 1.0%) for each grid.
When it works, and when it… doesn’t
Grid trading is a textbook example of a martingale forex trading strategy. This means, that the strategy increases risk and leverage with increasing losses (unless a stop-loss has been hit). It’s similar in nature to the well-known example of the roulette betting strategy – always bet on one color and if you lose, double up your bet until you win again (or until you get broke).
Modern position sizing and money management techniques usually work exactly in an opposite way – i.e. decrease the risk after losses and increase the risk after profits. That being said, this doesn’t mean grid trading is bad or unprofitable. It’s just risky in a different way.
The environments in which grid trading strategies literally thrive are price ranges, oscillations and sideways markets. Grid trading is an ideal strategy for such periods. On the other hand, the grid trading strategy easily becomes unprofitable if the markets trend persistently. In other words, if the price moves only in one direction and doesn’t mean revert.
Grid trading performance reporting
Let’s say we have an intraday currency grid trading strategy, which resets the grid (and closes all trades) every day. There are two ways to report the results of this strategy. You can either report the actual value of the portfolio every minute – Mark To Market reporting (MTM). Or you can report the portfolio value only when a trade is closed.
The “closed trades reporting” can create an illusion of a very profitable strategy until the end of the day when all positions are closed. This is caused by the way grid trading strategies work. The only trades that are closed during the day are the winning ones. However, we can expect big jumps when all the trades (including the losing ones) are closed at the end of the day.
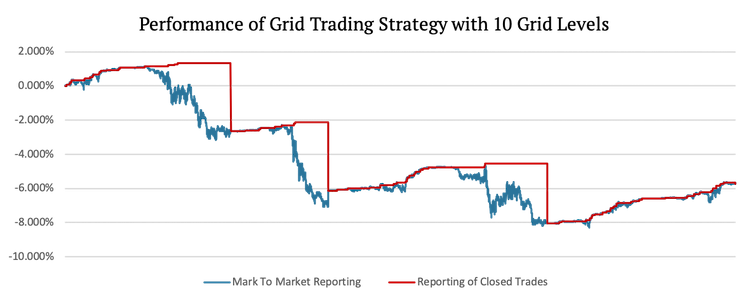
The following chart shows both of the abovementioned methods of reporting. As we can see the first way of reporting (blue line) shows the value of the portfolio each minute, while the second type (red line) has big sudden jumps at the end of the days.
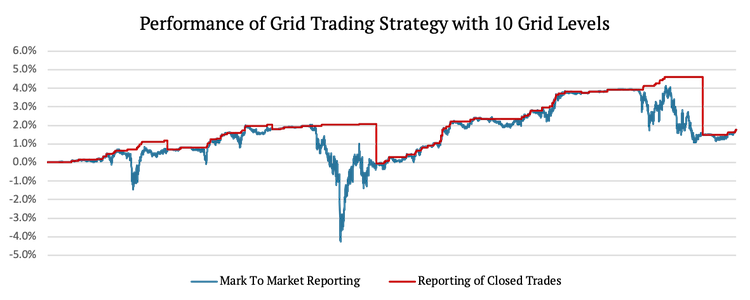
Which equity curve would you prefer? Well, the red one hurts you less often right?
Grid Trading Strategy Analysis
We analyzed a simple grid trading strategy on EUR/USD using one-minute data. The starting point of our data set is 21.1.2021 23:00, and the ending point is 2.2.2021 7:40, which leaves us with 10926 data points (seven trading days).
At the end of each day, we close all opened positions to “start fresh” the next day. A reference price is set at the beginning of each day as the first opening price of the new day. The grid is then created according to this price based on the volatility from the previous day. The volatility, in our example, hovered around 0.4%.
For the first example, we decided to use ten grid levels for the long side and ten grid levels for the short side. The distance between the reference price and the first grid lines, as well as the distance between individual gridlines, is calculated as 10% of the volatility from the previous day.
Each time we hit a grid line below (/above) the reference price, we open a long (/short) position. The position is then closed when the price of the traded currency increases (/decreases) to one and a half grid length from the price where we opened the long (/short) position.
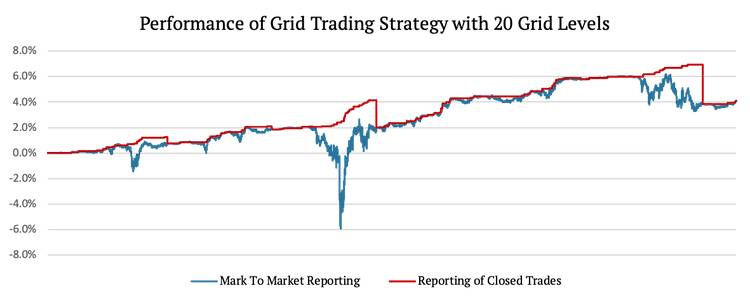
The second example shows a similar strategy, with a single difference. This time we are using 20 grid levels. This means that the distance between individual gridlines is calculated as 5% of yesterday’s volatility. We expect this strategy to perform similarly, but we also expect the difference between the MTM reporting and Closed-Trades reporting to be much more significant. The difference between the two ways of reporting is caused by the fact that 20 grid levels allow for more smaller gains. However, each time we open a new trade, all the already opened trades are losing. So, if the curve does not flip by the end of the day, the loss is that much greater.
The last example we present is of the same grid trading strategy as was shown in the first example. However, this time we analyze a time period where the price did not oscillate as much during the day and thus, the strategy is not profitable. The time period in this example is 7 days later, i.e. from 2.2.2021 8:55 till 11.2.2021 20:25 which leaves us with 10926 data points (once again 7 trading days).
As you can see, there are several losing days in a row. This is caused by the fact that price was not oscillating during the day. Instead, it trended in one direction. Even if the price rises during one day and falls during the next, we still lose money when applying this strategy – if the price trended during the day. To have a profitable grid trading strategy, which is reset at the end of each day, we need the price to oscillate within the day.
Author:
Daniela Hanicova, Quant Analyst, Quantpedia
Are you looking for more strategies to read about? Sign up for our newsletter or visit our Blog or Screener.
Do you want to learn more about Quantpedia Premium service? Check how Quantpedia works, our mission and Premium pricing offer.
Do you want to learn more about Quantpedia Pro service? Check its description, watch videos, review reporting capabilities and visit our pricing offer.
Do you want algorithmic access to the full Quantpedia database via the API? Subscribe to Quantpedia Pro, ask for an API key, and explore the in/out-of-sample statistics, source academic papers, and code snippets — ideal for quantitative research, systematic trading workflows, and AI model training.
Are you looking for historical data or backtesting platforms? Check our list of Algo Trading Discounts.
Or follow us on:
Facebook Group, Facebook Page, Twitter, Linkedin, Medium or Youtube
Share onLinkedInTwitterFacebookRefer to a friend


