Are Cryptocurrencies Exposed to Traditional Factor Risks?
Cryptocurrencies are attracting much attention, even becoming a priority for many high-net-worth investors. The introduction of the new spot Bitcoin ETFs simplifies access to this asset class, and as cryptos are included in more and more portfolios, industry practitioners look for models that can help assess how big a portion of clients’ portfolios allocate to this new asset class. Factor risk models are an industry standard for understanding other main asset classes, and authors of today’s presented research (Akbari, Ekponon, and Guo, revised 2024) provide useful insights into which factor risks can explain the variation in cryptos returns.
Using time series and cross-sectional techniques within an efficient grouping framework, authors examine how key factors (drawn from major asset classes) might drive cryptocurrency prices. They show that cryptocurrencies are exposed to fluctuations in other major asset classes, plus they uncover intense exposure of the crypto market to traditional asset class pricing factors (value, size, etc.), particularly from the stock market.
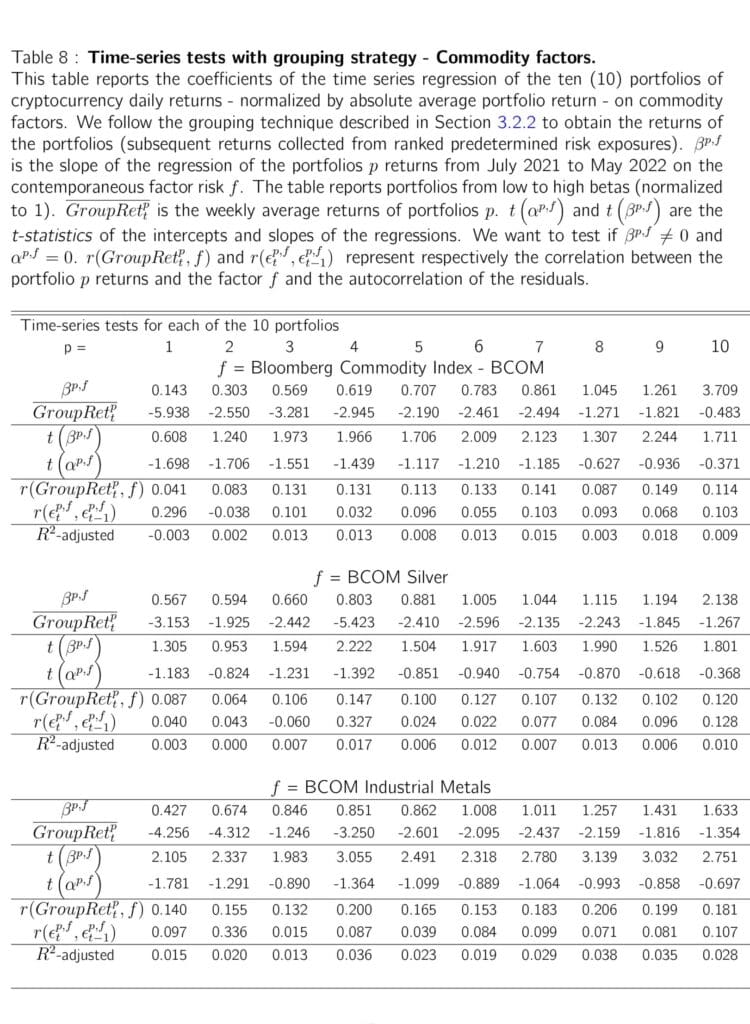
We can definitely shred the idea that crypto stands on its own, acting independently and in isolation from other financial world vehicles. The crypto market is positively correlated with the stock market, negatively correlated with the currency market, and positively correlated with commodity factors. Study shows that cryptocurrencies with high stock market exposure have higher returns in the time series and cross-section.
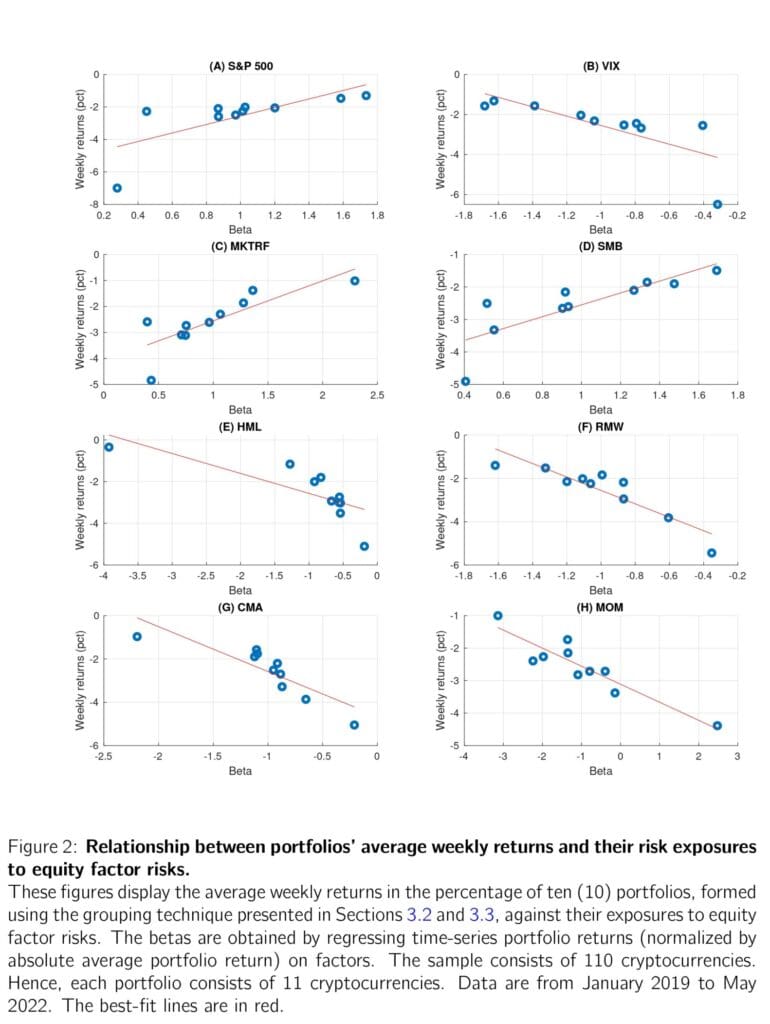
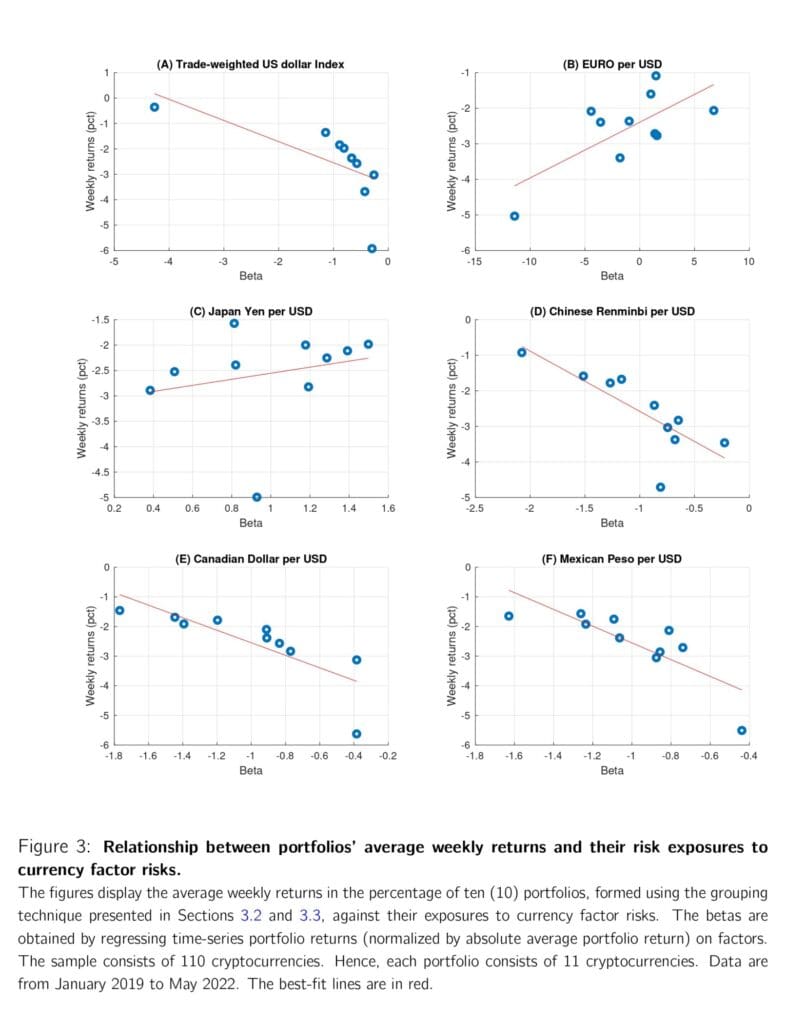
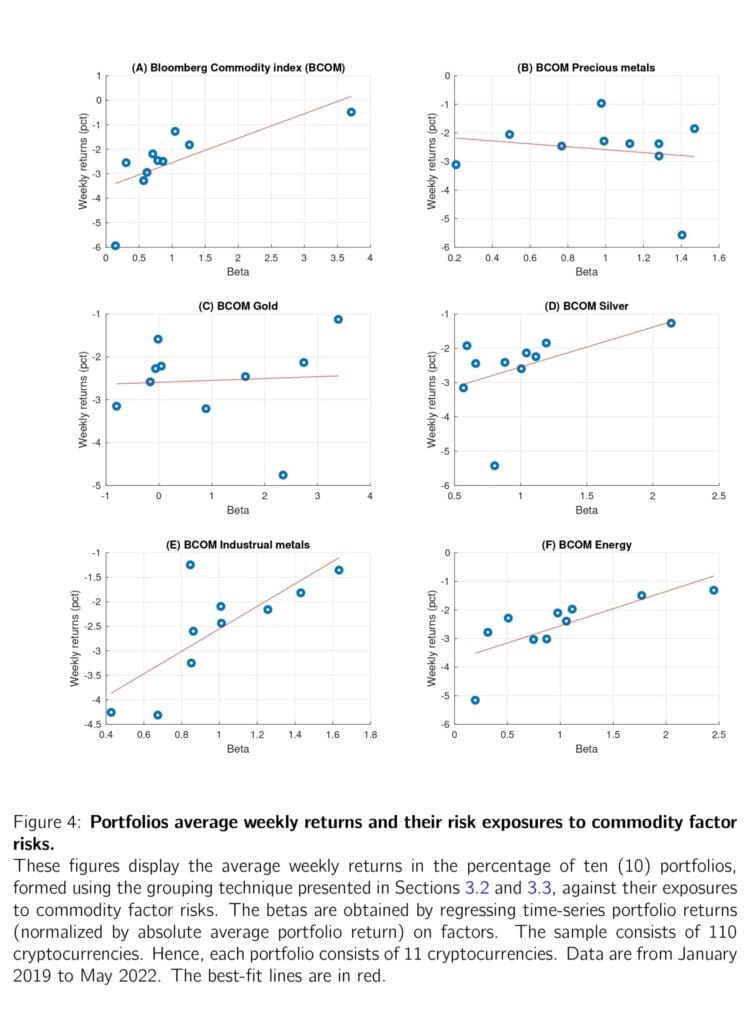
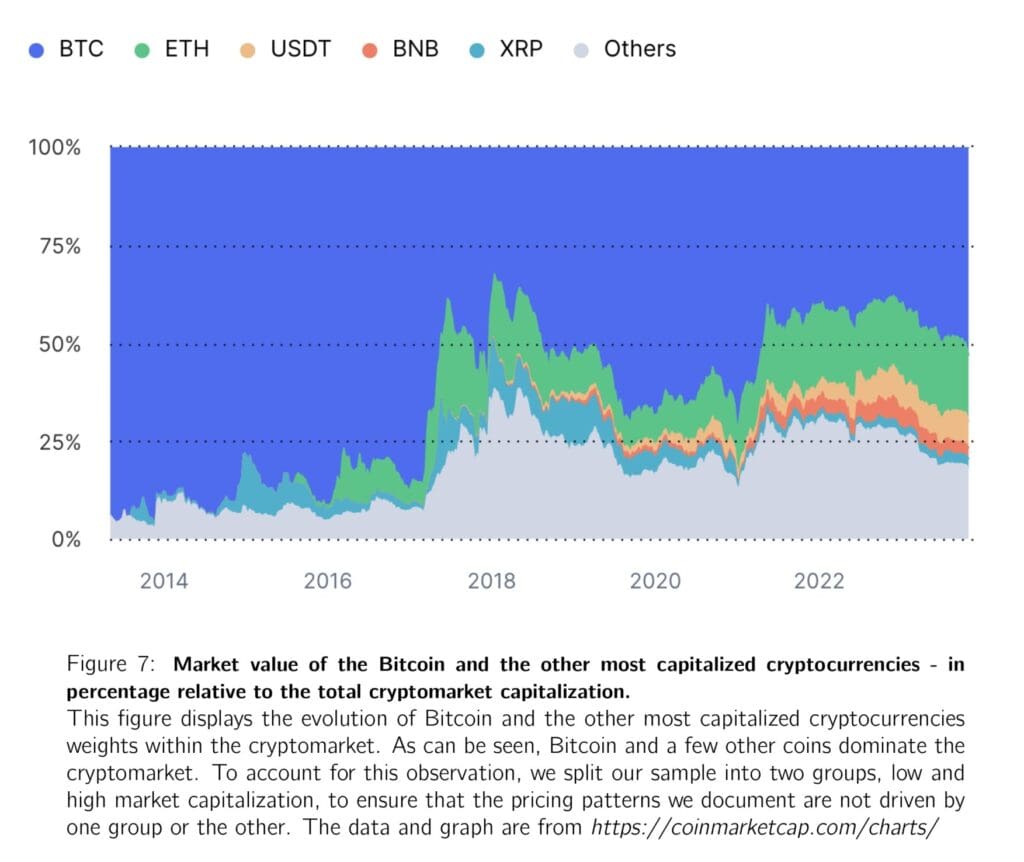
As shown in Figures 2, 3, and 4, for most (risk) factors, γf0 differs from zero. This is confirmed by their robust t-statistics metrics. They all reveal the existence of a risk-return relationship in the cross-sections. Figure 7 shows the overall evolution of weights of Bitcoin, Ethereum, and the other altcoins within the crypto market. Overall, these findings provide the evidence that well-known factor risks can explain crypto market returns and that a strong link exists between the crypto market and traditional asset classes.
Authors: Guilda Akbari, Adelphe Ekponon, and Zihan Guo
Title: Are Cryptocurrencies Exposed to Factor Risk?
Link: https://papers.ssrn.com/sol3/papers.cfm?abstract_id=4595563
Abstract:
We show that cryptocurrency price fluctuations are subject to existing asset pricing factors, contrary to what is documented in the literature. Using data from the 110 cryptocurrencies with the largest market capitalization as of June 2021, we examine the pricing ability of 20 factors belonging to three asset classes, i.e., equities, currencies, and commodities. Our pricing exercise runs from July 2021 to May 2022, with data from January 2019 to June 2021 used to obtain initial estimates of factor loadings. We base our tests on the grouping strategies proposed by Black, Jensen, and Scholes (1972}, which have been shown to significantly reduce the bias in factor loading estimates. We find that cryptocurrency returns are highly significantly related to the stock market, negatively correlated with currency factors, and positively related to commodity factors. These results provide evidence of a strong link between the cryptocurrency market and traditional asset classes.
And as always, we present several interesting figures and tables:
Notable quotations from the academic research paper:
“Bitcoin, the first cryptocurrency, was launched in the aftermath of the 2009 credit crunch. Bitcoin and altcoins (terminology used to refer to all other cryptocurrencies) are generally considered to be digital currencies that are built on distributed ledger technologies such as blockchain and are therefore not regulated by a central authority. At its inception, bitcoin was intended to be an alternative to fiat currencies. However, the high returns in this market may have attracted traditional investors as well, as cryptocurrencies offer new investment and diversification opportunities. After bitcoin, the number of active cryptocurrencies worldwide reached 10,000 in early 2022, with a total market capitalization of about $2 trillion, according to CoinMarketCap.com.1 Whether cryptocurrencies are perceived as currencies by authorities and regulators, treated as securities by investors, or used as utility tokens, it is unclear how this new market will interact with current major asset classes. Nonetheless, interest in cryptocur- rencies has grown steadily over time, not only among business users, but also among individual consumers and authorities in many countries around the world. Governments have established regulatory sandboxes to educate consumers or created high-level government task forces to study the technology and regulatory implications.
Our analysis starts with the standard cross-sectional asset pricing technique (preliminary analysis). We obtain the average factor exposures of each of the 110 cryptocurrencies, selected based on their market capitalization in July 2021, by using the time series regressions from September 2014 to June 2021.2 For each factor, we then regress the average cryptocurrency returns over the next six months, from July 2021 to December 2021, on the average factor exposures. All data have a daily frequency.
Our results indicate that market-wide equity factors, such as the Fama-French market MKT or the S&P500 index and the VIX, are consistently priced in the three methods examined (preliminary analysis, time series, and cross-sectional tests). These results highlight a strong link between the cryptocurrency and the stock markets. We also find that cryptocurrency returns have a negative relationship with the foreign exchange market and a positive relationship with the commodity market over time. These results suggest that it is particularly risky to invest in individual cryptocurrencies.
We find that high exposure is associated with higher returns on average in the cross-section, consistent with asset pricing theory. Thus, our results provide evidence that the risks in the cryptocurrency market can be mitigated by investing in the cross-section. In particular, cryptocurrencies with greater time-series exposure to the stock market are likely to experience higher returns. Currency factors (expressed in foreign currency units per US dollar) are negatively correlated with the cryptomarket. Therefore, cryptocurrencies that perform well when the US dollar depreciates have higher returns. The relationship is strong with the trade-weighted US dollar index, the Canadian dollar, the Chinese renminbi, and the Mexican peso. Finally, our estimates suggest that higher exposure to the Bloomberg Commodity Index (BCOM) and its energy, industrial metals and silver sub-indices are more likely to have higher cross-sectional returns.
Our asset pricing approach is tested in an economy where several other asset classes already exist, each with at least one pricing factor. The asset classes considered are stocks, currencies, and commodities. We assume that investors have different incentives to trade cryptoassets. Some may have some of their assets invested in the stock market or hedge some of their assets by buying precious metals, while others may hold cash or be inclined to transact in cryptocurrencies. Investors have at least two incentives to understand how traditional market factors interact with the crypto market. First, understanding individual cryptocurrency returns is still puzzling, and second, this new market has high returns but also a higher level of risk. Because estimation errors can undermine the validity of our results, we use the grouping technique described in section 3.
Our results provide novel insights into the factors that price cryptocurrencies and are the first to document a strong link between the cryptocurrency market and traditional asset classes, particularly the stock market. We start with single-factor models to examine the pricing ability of some prominent factors, both in time series and cross-section. We form groups as described in Black, Jensen and Scholes (1972).”
Are you looking for more strategies to read about? Sign up for our newsletter or visit our Blog or Screener.
Do you want to learn more about Quantpedia Premium service? Check how Quantpedia works, our mission and Premium pricing offer.
Do you want to learn more about Quantpedia Pro service? Check its description, watch videos, review reporting capabilities and visit our pricing offer.
Do you want algorithmic access to the full Quantpedia database via the API? Subscribe to Quantpedia Pro, ask for an API key, and explore the in/out-of-sample statistics, source academic papers, and code snippets — ideal for quantitative research, systematic trading workflows, and AI model training.
Are you looking for historical data or backtesting platforms? Check our list of Algo Trading Discounts.
Or follow us on:
Facebook Group, Facebook Page, Telegram, Twitter, Linkedin, Medium or Youtube
Share onLinkedInTwitterFacebookRefer to a friend


