Best Performing Value Strategies – Part 1
Value strategies attempting at determining a fair value of an asset are one of the first-ever employed strategies in the markets. We all know about Benjamin Graham and Warren Buffet that are one of the best known examples of Value pioneers. Since then, however, Value strategies have evolved enormously.
Value strategies have become a cornerstone of almost every factor portfolio, due to their favorable correlation to other factors and sound logic. Value has also spread out of the equity space to all other asset classes, and many apply it today, for example, also to Cryptocurrencies. That being said, definitions of Value vary considerably among different asset classes and even among the same asset class such as equities.
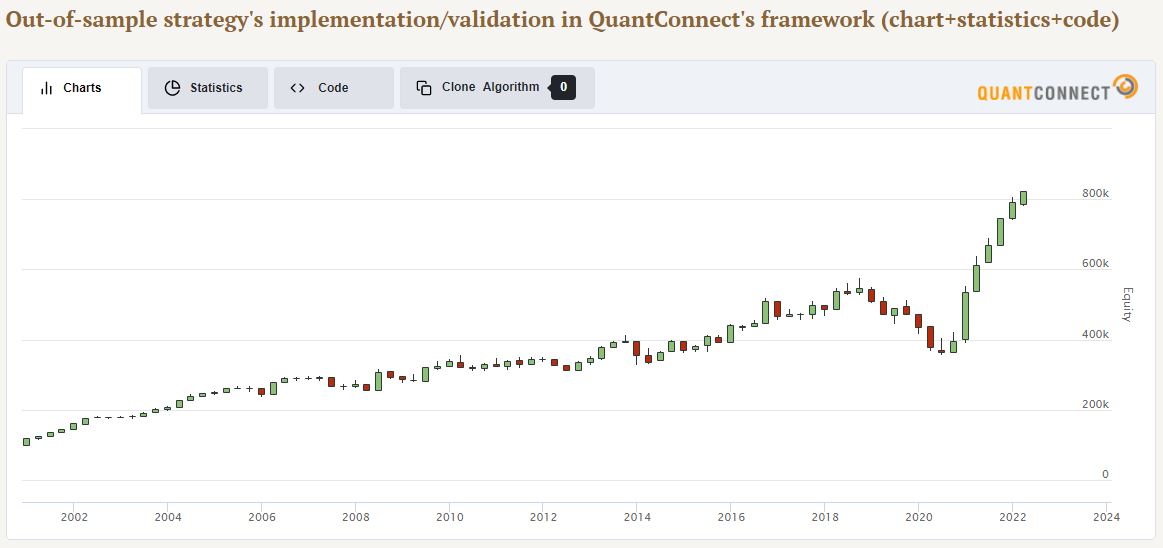
Example of a very well performing US Equity Value strategy in recent years
Equity Value strategies have suffered hardly during years 2018, 2019 and also 2020. Due to the poor performance of Value during this period, many investors have abandoned the strategy, often expressing view that “Value strategy is not working anymore”. Nevertheless, equity Value strategies have managed a strong comeback recently, turning attention of investors and traders back to them. In our blog today, we will take a close look at many different equity Value strategies, their performance and how they behave.
How to Compare Performance of Different Value strategies

Quantpedia Strategy Screener
Quantpedia’s database of quantitative trading strategies currently contains 59 different Value strategies – 8 free and 51 premium. For the purpose of our today’s analysis we narrowed our focus to Equity Value only. To make it even simpler, we will focus only on US Equity Value strategies.
As depicted in the picture above, we can easily filter for all US Equity Value strategies with a QuantConnect code, that are regularly updated on Quantpedia. We arrive at the final number of 16 US Equity Value strategies. Now that we narrowed down our strategy universe, how can we compare the performance of different Value strategies?
We can easily visualize various performance and risk metrics in the matter of seconds and compare them to each other thanks to Quantpedia Pro summary tables, see below. We’ve decided to sort the strategies based on their 3 year performance and we will later take a closer look at the best performing ones.
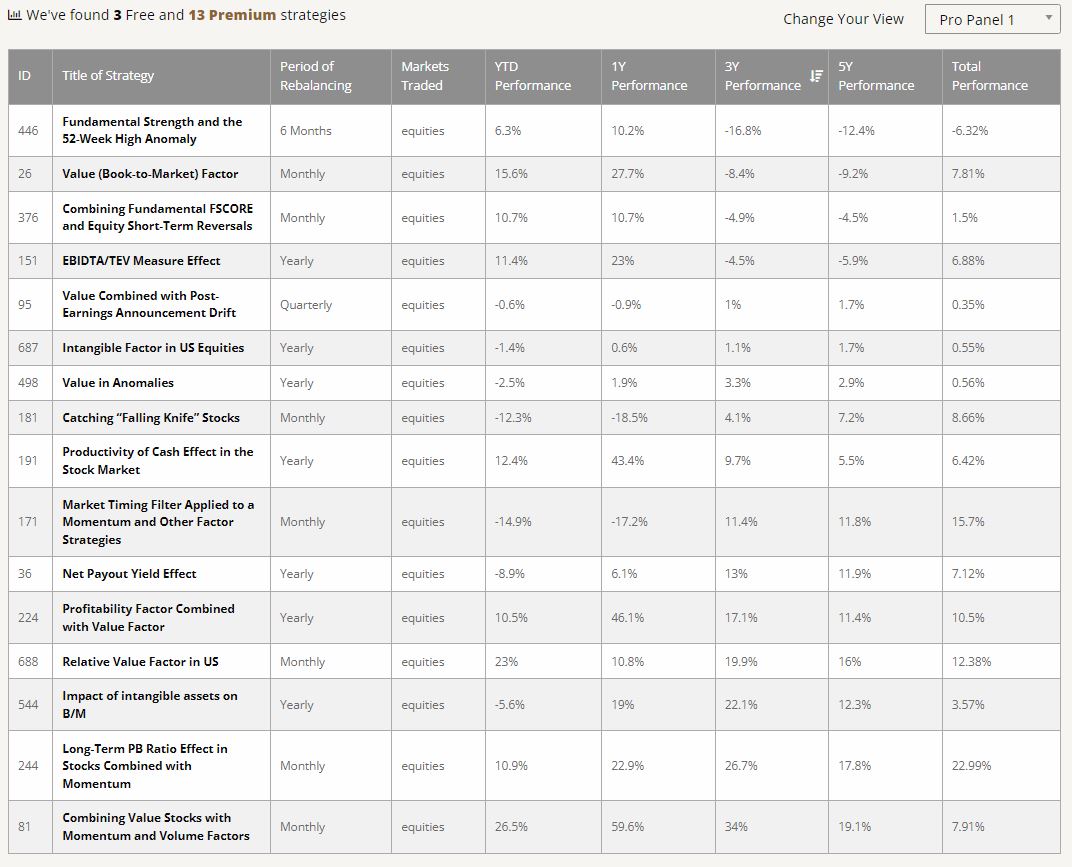
Performance of different Value Strategies summarized
Return and Risk of Value Strategies
The same comparison can be simply performed also for various risk metrics and return-to-risk ratios in another Panel of Quantpedia Pro Screener. We may observe that the US Equity Value strategies differ strongly in terms of all – their performance, risk, return-to-risk ratios as well as many other characteristics available in Quantpedia Pro reports.

Quantpedia Pro Panel 2
Are Value Strategies Correlated to US equities?
A natural question that arises when analyzing performance of the strategies is – How correlated are the US Equity Value strategies to US Equities? Given the good performance of strategies in recent years, and also being cautious with US Equities going forward, one may become suspicious whether the Value strategies aren’t tied to market itself too much.
Luckily, we may quickly answer this question when we examine another built-in feature of the Quantpedia Pro Screener – correlation to US Equities. As we can see from the picture below, correlation of US Equity Value strategies to the US Equities themselves is mostly negative and on average hovers around 0. There are some exceptions, where the correlation to US Equities is notable, for example for the strategy Net Payout Yield Effect. That being said, this is more of an exception, rather than the rule. Moreover, it may be desirable, to have at least same strategies correlated to equities as well.
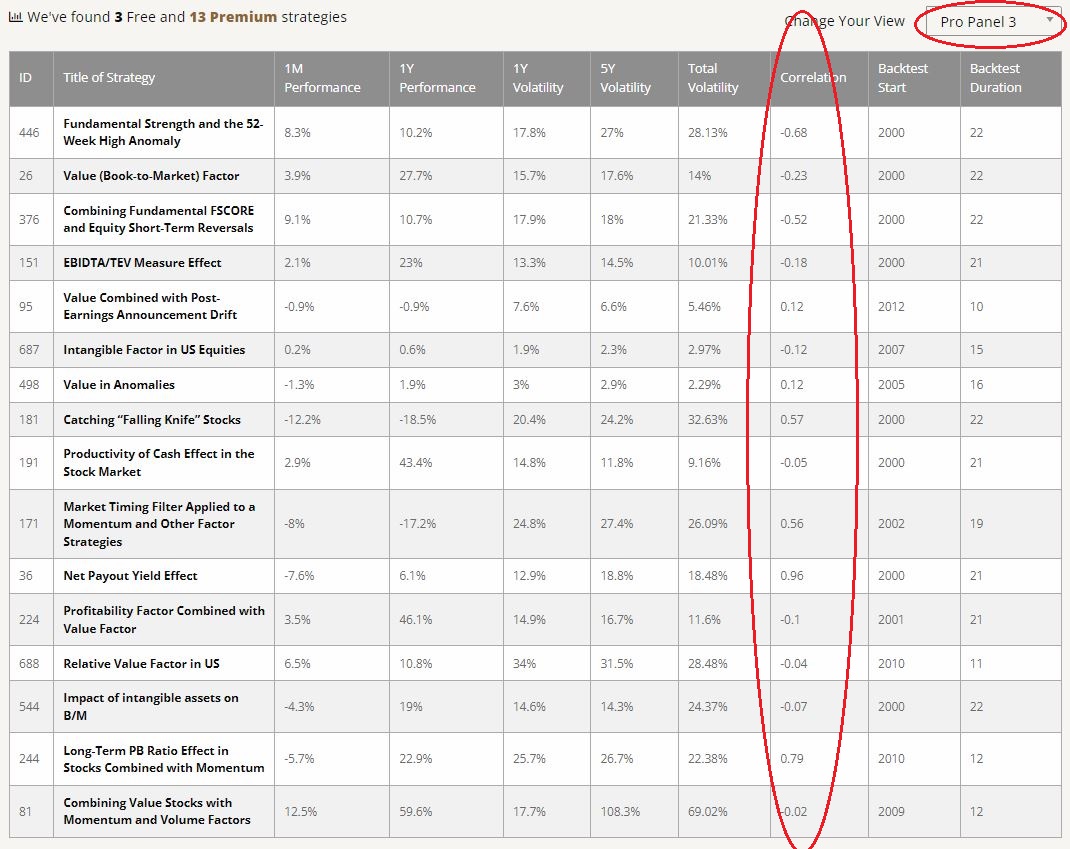
Quantpedia Pro Panel 3
How Similar Are Different Value Strategies?
Another important question one may soon ask would be – how similar are these US Equity Value strategies? Aren’t they just copies of each other with little differences? The simply answer would be – no, they are actually pretty different.
We’ve already seen from the simple risk and return analysis above that the performance metrics of our US Equity Value strategies vary widely. This was a first indication pointing toward different behavior of these single strategies. To confirm this view, we may easily analyze also the correlation structure among all of our value strategies. Quantpedia Pro Correlation report will generate such an analysis immediately:
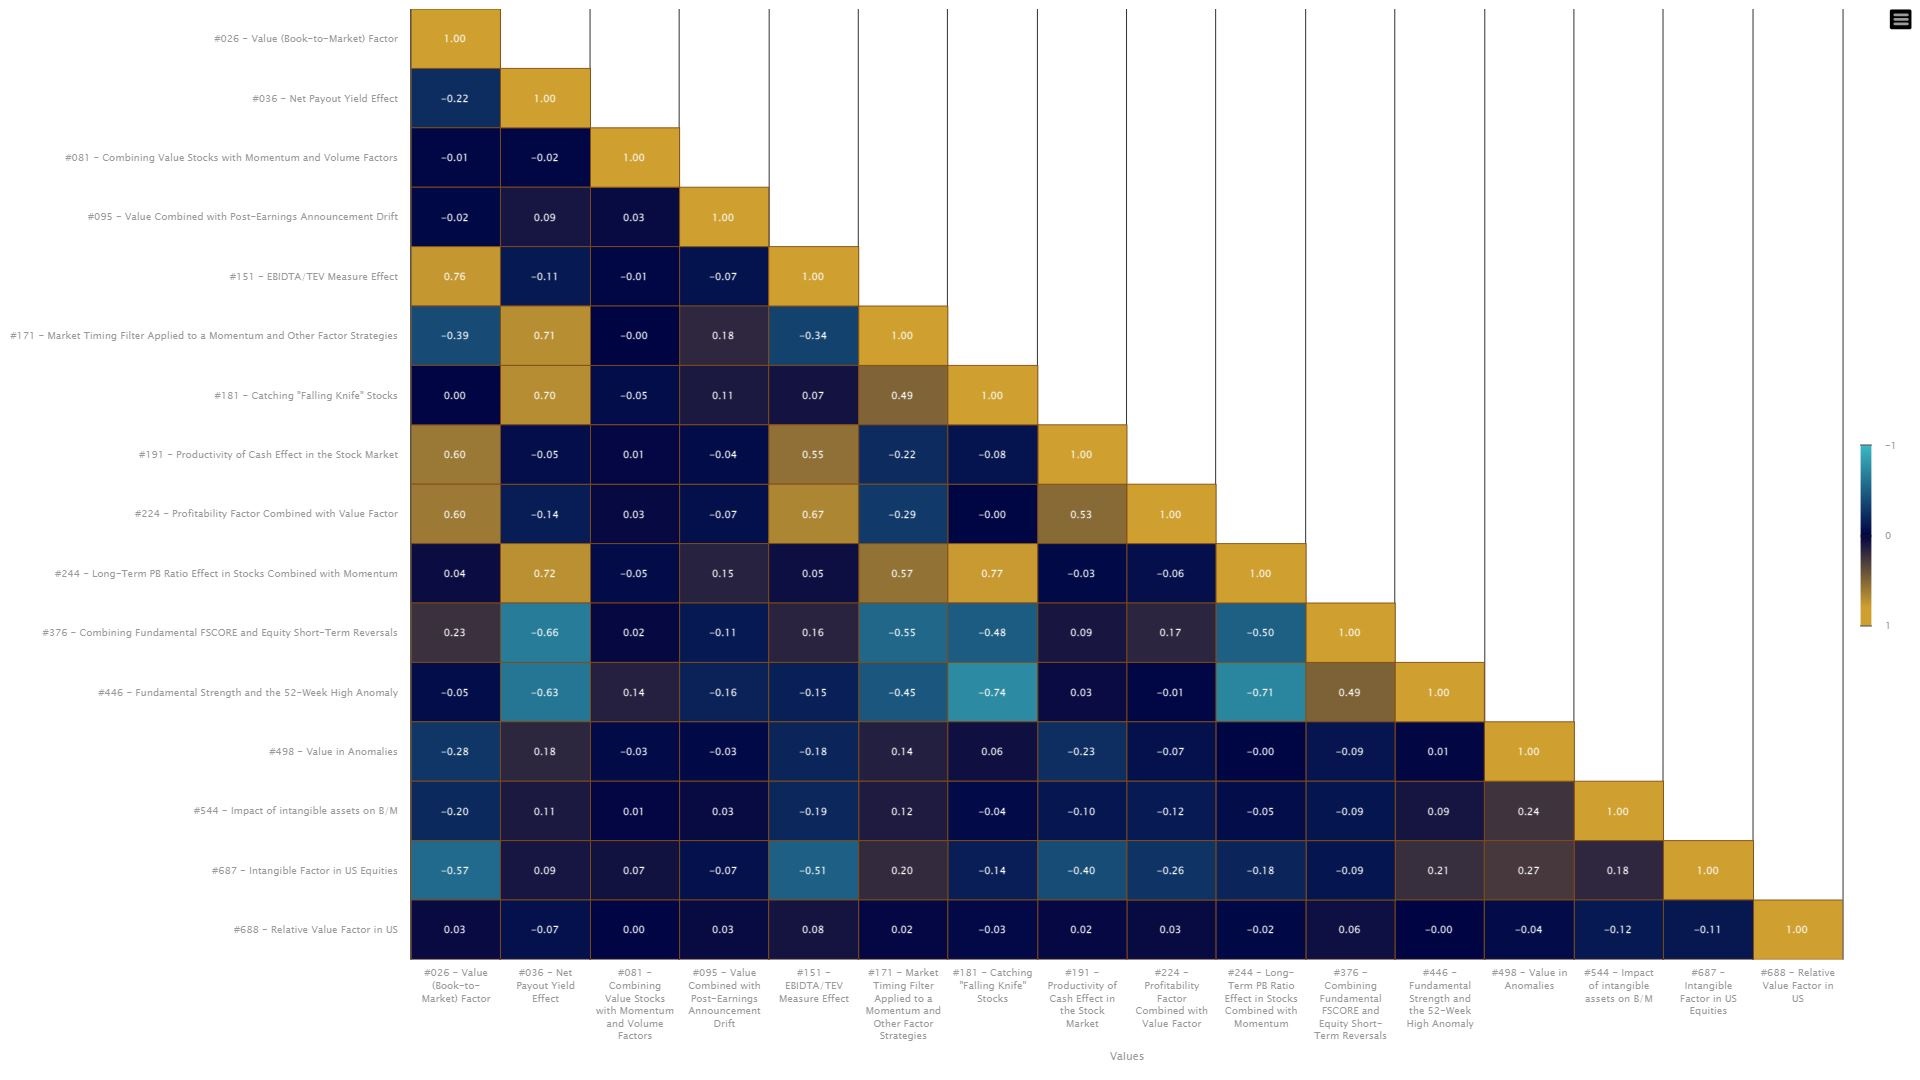
Correlation among numerous Value strategies
The correlation analysis only confirmed our assumptions based on performance and risk metrics – US Equity Value strategies in Quantpedia’s database differ a lot, with pairwise correlations mostly hovering around 0.
Top Performing Value Strategies
Now that we’ve presented a quick overview of all US Equity Value strategies in Quantpedia’s database, we will now turn our focus to the actual top performing value strategies. We’ve picked 10 strategies out of 16 mentioned above, sorted them based on their 3 year performance and will shortly described every single of them starting from the number 10 below.
#10 Value (Book-to-Market) Factor
Value (Book-to-Market) Factor
YTD performance: +15.6%
3-year performance: -8.4% p.a.
5-year Sharpe ratio: -0.52
# Instruments: 1000+ NYSE, AMEX and NASDAQ stocks
Frequency: Monthly
Max Drawdown: -63.7%
Strategy idea: long high book-to-price stocks, short the opposite
This is probably the most traditional value strategy. Book-to-market represents a Value benchmark and is a good indicator for the development of the entire universe of Value strategies. We can observe, that after a few years of a lackluster performance, the strategy calls for a comeback with attractive year-to-date performance, beating all passive equity markets.
The presented Value factor also corresponds to the definition of Value (or High-Minus-Low) by Fama & French. To represent “value” investing, HML portfolio goes long high book-to-price stocks and shorts low book-to-price stocks. The portfolio is equal-weighted and rebalanced monthly.
#9 EBITDA/TEV Measure Effect
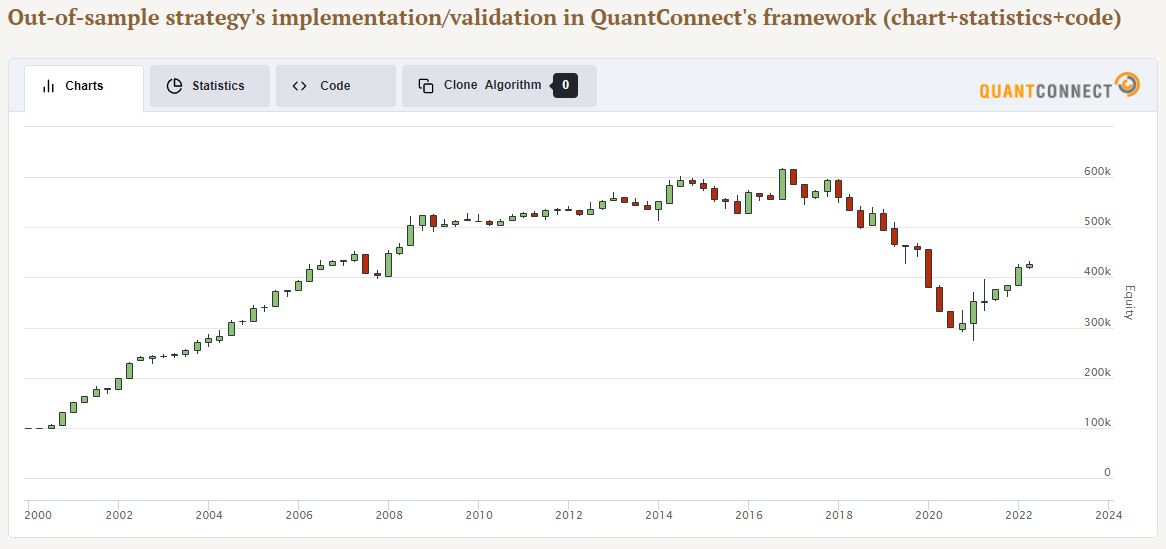
EBITDA/TEV Measure Effect strategy
YTD performance: +11.4%
3-year performance: -4.5% p.a.
5-year Sharpe ratio: -0.41
# Instruments: 1000+ NYSE, AMEX and NASDAQ stocks
Frequency: Yearly
Max Drawdown: -55.9%
Strategy idea: long cheap stocks as measured by EBITDA/TEV, short the opposite
Many extensions of the classical value strategy based on the (definitely not perfect) book-to-market ratio have popped up in last decades. One of them, rather than using book value and simple market capitalization, uses the measure of earnings, EBITDA, together with the more advanced proxy for a market capitalization – total enterprise value.
The Value strategy we named “EBITDA/TEV Measure Effect” sorts the US stock universe based exactly on this measure. Although the results are definitely somewhat correlated to the traditional Book-to-Market Value strategy, there are prolonged periods where the strategies behave differently enough.
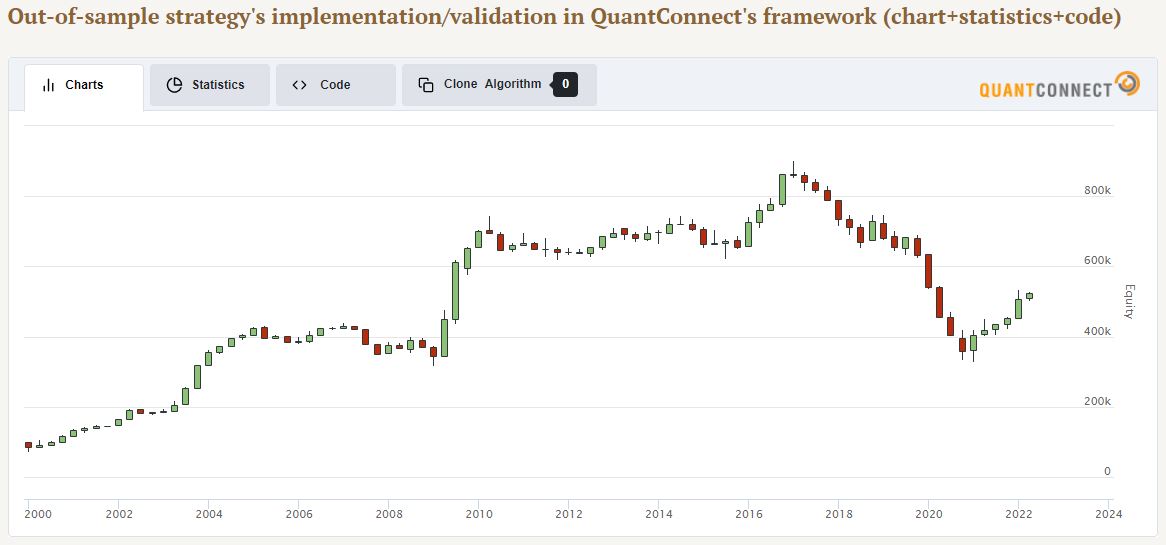
#8 Intangible Factor in US Equities

Intangible Factor in US Equities strategy
YTD performance: -1.4%
3-year performance: +1.1% p.a.
5-year Sharpe ratio: 0.74
# Instruments: Russell 3000 stocks with exclusions
Frequency: Yearly
Max Drawdown: -14.5%
Strategy idea: buy high intangibles stocks, short the opposite
The global economy has undergone a rapid transition from a traditional economy dominated by physical assets and production processes to a knowledge economy fueled by advancements in technology. Consequently, intangible assets started to play a vital role in the growth of companies. That being said, more and more quantitative trading strategies have started to use intangibles as their primary or complementary Value signal.
Quantpedia’s Intangible Factor in US Equities strategy is based exactly on intangibles as its primary factor. The strategy goes long the stocks with high intangibles and short the stocks with low intangibles. The methodology to calculate actual intangible assets is, however, quite complex and is described in details in Quantpedia’s strategy database.
We can observe, that this type of Value strategy performed well also in problematic years of 2018, 2019 and 2020 and achieved positive performance over that period. Performance in 2022 is only around zero, but long term return-to-risk ratios of the Intangibles Strategy are still very favorable. With Maximum Drawdown of only -15% and low volatility, intangible assets make for an attractive equity long-short strategy.
Conclusion
In the first part of today’s article we’ve showed how may Quantpedia’s Screener and Quantpedia Pro Toolbox help you quickly select the broad universe of US Equity Value trading strategies and then further analyze them.
We may observe that the top-performing US Equity Value strategies are quite diverse and not completely related to each other. Some of them are performing really well already for a longer period, while others have started performing strongly only recently.
In the second part of today’s article, we looked at number #10 to number #8 best value strategies from Quantpedia’s database. We leave the Best 7 Value Trading Strategies for the next time. Stay tuned!
Share onLinkedInTwitterFacebookRefer to a friend


