Can We Profit from Disagreements Between Machine Learning and Trend-Following Models?
When using machine learning to forecast global equity returns, it’s tempting to focus on the raw prediction—whether some stock market is expected to go up or down. But our research shows that the real value lies elsewhere. What matters most isn’t the level or direction of the machine learning model’s forecast but how much it differs from a simple, price-based benchmark—such as a naive moving average signal. When that gap is wide, it often reveals hidden mispricings. In other words, it’s not about whether the ML model predicts positive or negative returns but whether its view disagrees sharply with what a basic trend-following model would suggest. Those moments of disagreement offer the most compelling opportunities for tactical country allocation.
Intro
In recent years, machine learning models have become increasing important tools for modeling complex systems across domains such as weather forecasting, economics, and finance. Originally established for precipitation nowcasting, RainNet is a deep learning model that captures spatial and temporal dependencies in weather data (Ayzel et al., 2020). In this study, we adapt a similar spatially structured machine learning approach to the prediction of international equity prices. Recognizing that financial markets are not isolated but are influenced by geographic proximity and economic size (Bae, 2016; Parsons et al., 2018), we propose that information from one country’s equity market can help improve the predictions of others. Moreover, research shows that investors often underreact to foreign market information, creating predictable patterns in equity returns (Nguyen, 2012). Our goal is to leverage the geographic distribution of countries, their economic weights, and the cross-country peer effects to generate short-term equity return forecasts. By combining pattern recognition capabilities that come with machine learning with economically motivated spatial structures, we aim to improve on traditional technical indicators, such as moving averages, and to create more actionable trading signals.
Setup
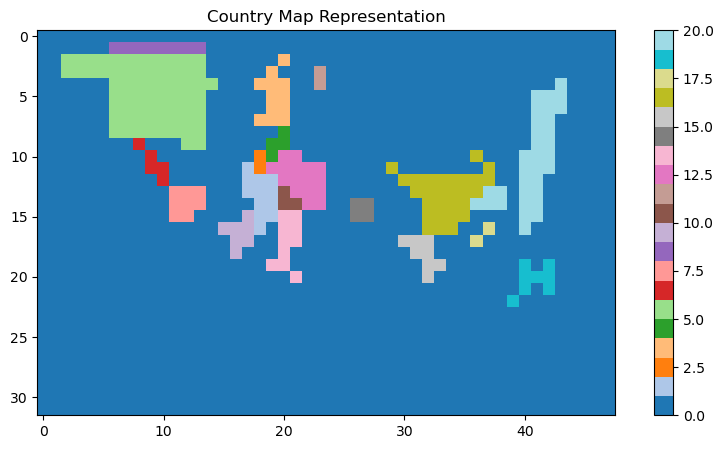
The core structure of the model closely followed that of RainNet. We used weekly equity price change data from 2008 to 2024 as the input. To adapt the data to a spatial format, we constructed a 32×48-pixel map of the world. Given that approximately 29% of the Earth’s surface is landmass, we allocated a corresponding proportion of the total pixels to represent land. Additionally, we selected the 20 largest economies as of 2008 (Table 1) and assigned each a number of pixels proportional to its share of global GDP, scaled by the total number of land pixels. Regions of the map that do not correspond to these economies were set to zero, creating a sparse but geographically meaningful input structure. This setup is illustrated in Figure 1, while Figure 2 illustrates an example of a datapoint. We used data from 2008 to 2021 as the training set, while the remaining period was reserved for testing. Furthermore, the model utilized a standard sliding window approach, using the preceding 50 weeks of input data to generate a single prediction for the following week. The model was trained to predict the weekly change in price for each country, minimizing the MSE between the predicted and actual weekly changes.

Data
Our dataset spans years 2008 to 2024 and we obtained the total return data for the following countries:

As a source of ETF total return data, we use EODHD.com – the sponsor of our blog. EODHD offers seamless access to +30 years of historical prices and fundamental data for stocks, ETFs, forex, and cryptocurrencies across 60+ exchanges, available via API or no-code add-ons for Excel and Google Sheets. As a special offer, our blog readers can enjoy an exclusive 30% discount on premium EODHD plans.
Hypothesis
Our hypothesis is that incorporating geographic relationships between countries can improve the prediction of equity price movements. Specifically, we hypothesize that countries that are geographically close tend to exhibit correlated equity performance due to similar macroeconomic conditions, regional and economic ties, and investor sentiment spillover. Moreover, we propose that the model’s spatial structure will be especially valuable when the collective performance of neighboring countries provides additional information beyond what is visible in the individual country’s price trend along.
Results
To evaluate the model’s performance at the country level, the predicted outputs first had to be mapped back to their corresponding countries. Since each country was represented by a set of pixels in the 32×48 map, we assigned each predicted pixel value to its respective country based on the original spatial mapping. For each country, we then calculated the average of all its associated pixel predictions to obtain a single predicted value per country per week. Figure 3 illustrates the predictions for SPY.

After further analysis, we observed that the model’s predictions were strongly correlated with the price to moving average ratio, as illustrated in Figure 4.

Therefore, we observe that the model’s predictions closely track the price to moving average ratio. However, returning to our original hypothesis, we expect the machine learning model to be better informed than the moving average alone, due to its ability to incorporate spatial relationships and capture the influence of neighboring countries’ performances. By leveraging this additional geographic context, the model’s predictions have the potential to be more accurate and provide deeper insights than traditional technical indicators.
Thus, the larger the difference between the model’s prediction and the price to moving average ratio, the greater the potential trading opportunity, assuming that the machine learning model provides higher quality information than the simple Price/MA indicator. This gave rise to several possible approaches for constructing the final trading strategy, each of which is compared against an equally weighted benchmark portfolio.
Long-Short Approach
In the first approach, we generate trading signals by comparing the model’s prediction to the price-to-moving-average (price/MA) ratio. If the prediction exceeds the price/MA ratio, we take a long position in the corresponding country; if it falls below, we take a short position. The size of each position is scaled by the absolute difference between the prediction and the price/MA ratio, so that larger discrepancies result in proportionally larger trades. We implement two subvariants of this strategy, selecting either the top 1 or top 2 country pairs with the most significant differences. The results can be seen in Figure 5, and the model summaries in Table 2.


The Top 1 Model significantly outperforms the benchmark across several key performance metrics. It achieves a CAR of 23.56%, more than double the benchmark’s 11.56%, along with a higher Sharpe ratio of 0.87. While it experiences a slightly larger maximum drawdown (-21.85% vs. -18.33%), its Calmar ratio of 1.08 still reflects a more favorable return-to-risk profile than the benchmark (0.63). However, the Top 2 Model, which includes additional countries, yields performance metrics that are notably closer to the benchmark. This suggests that as the model is diversified across more countries, its behavior increasingly resembles that of the benchmark, with diminishing relative performance. Therefore, in the next section, we tried different approach to better isolate the trading signal.
Rank Model Approach
In the second approach, we focus exclusively on long positions. Each week, the countries with the largest positive differences between the model’s prediction and the price to moving average ratio are identified. The countries are longed based on this signal. We consider three subvariants of this strategy – selecting the top 1, top 2, or top 3 countries with the highest positive differences each week. The results can be seen in Figure 6. The model summaries can be seen in Table 3.

From the above results, it is evident that the Rank Model significantly outperforms the benchmark across multiple performance metrics. In particular, the Top 1 model achieves a much higher CAR of 25.22% compared to 11.56% for the benchmark, while also delivering superior Sharpe and Calmar ratios. Similarly, the Top 2 and Top 3 models also outperform the benchmark in terms of absolute returns, although their relative advantage diminishes as more countries are included. This is because, by expanding the number of selected countries, the portfolio composition becomes increasingly similar to that of the benchmark.
Conclusion
In this study, we adapted a machine learning approach originally designed for precipitation nowcasting to predict international equity price movements. By incorporating geographic structure into the model’s design, we aimed to capture cross-country peer effects that traditional indicators might overlook. Our results demonstrate that the difference between the machine learning-based and naive predictors can be used to build strategies that outperform relevant benchmark portfolios. These findings suggest that geographically informed machine learning models offer a promising direction for enhancing equity forecasting and developing trading strategies. Our further work would explore dynamic GDP weighting and a wider timeframe.
Author: David Neven Seruga, Junior Quant Analyst, Quantpedia
References
Ayzel, Georgy, Scheffer, Tobias, and Heistermann, Maik, RainNet v1.0: a convolutional neural network for radar-based precipitation nowcasting (September 11, 2020). Available at: https://gmd.copernicus.org/articles/13/2631/2020/.
Parsons, Christopher A. and Sabbatucci, Riccardo and Titman, Sheridan, Geographic Lead-Lag Effects (September 11, 2018). Available at SSRN: https://ssrn.com/abstract=2780139 or http://dx.doi.org/10.2139/ssrn.2780139.
Bae, Joon Woo (2016). Available at:https://joonbaecom.files.wordpress.com/2016/12/joon_bae_paper1_jmp.pdf.
Are you looking for more strategies to read about? Sign up for our newsletter or visit our Blog or Screener.
Do you want to learn more about Quantpedia Premium service? Check how Quantpedia works, our mission and Premium pricing offer.
Do you want to learn more about Quantpedia Pro service? Check its description, watch videos, review reporting capabilities and visit our pricing offer.
Are you looking for historical data or backtesting platforms? Check our list of Algo Trading Discounts.
Would you like free access to our services? Then, open an account with Lightspeed and enjoy one year of Quantpedia Premium at no cost.
Or follow us on:
Facebook Group, Facebook Page, Twitter, Linkedin, Medium or Youtube
Share onLinkedInTwitterFacebookRefer to a friend


