Can We Use Active Share Measure as a Predictor?
Introduction
Active Share is a metric introduced to quantify the degree to which a portfolio differs from its benchmark index. It is expressed as a percentage, ranging from 0% (fully overlapping with the benchmark) to 100% (completely different). The concept gained popularity because it was believed that higher Active Share reflects truly active management, which could potentially lead to outperformance. If used correctly, Active Share could help the investors identify future winners, making it a potentially effective strategy.
However, according to the paper Active Share and the Predictability of the Performance of Separate Accounts by Martijn Cremers, higher Active Share doesn’t consistently correlate with better performance and shows limited ability to predict the future success of active funds. Based on these findings, the main objective of this study is to analyze this problem and explore whether the high Active Share funds are just equity factor (smart beta) funds in disguise. Our hypothesis is that, in many cases, the equity factors impact funds’ performance and not the individual portfolio managers’ idiosyncratic decisions.
Data
For this analysis, we utilized daily data from 22 Active Share funds, sourced from the ActiveShare.info website. One of the creators of this platform is Martijn Cremers, the author of the aforementioned study. A major added value of this website is its dual-level benchmark evaluation. It not only examines the primary benchmark designated by the portfolio manager of a given fund but also investigates the actual benchmark. It seeks to minimize Active Share by determining which benchmark better aligns with the fund’s true investment strategy than the one selected by the portfolio manager. It is common for portfolio managers to choose benchmarks such as the S&P 500, even though the fund’s name and strategy clearly indicate a completely different investment universe (e.g., small-cap, mid-cap, or value stocks). As a result, the fund should have a more appropriate benchmark accurately reflect its performance. This frequent mismatch is one of the reasons why Active Share, while a popular measure, often lacks significant explanatory power in practice.
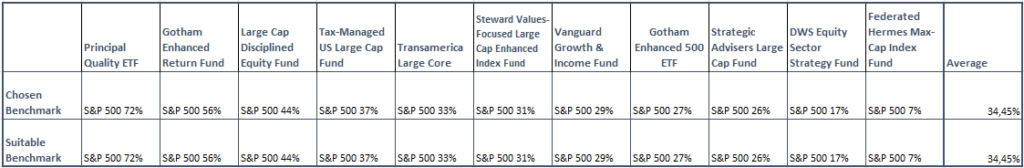
Our dataset of 22 Active Share funds, all of which used the S&P 500 chosen as their benchmark, was divided into 2 groups. The first group consist of 11 Active Share funds with high Active Share relative to the selected benchmark, though this benchmark was incorrectly chosen. In contrast, the second group comprises 11 Active Share funds with high Active Share relative to a correctly selected benchmark.

All available information on ActiveShare.info regarding the Active Share of given funds is as of December 31, 2021. Our analysis, however, is based on daily data from December 31, 2019, to December 31, 2023, sourced from Yahoo Finance. We consider this 4 year period sufficiently long for observation and don’t expect significant changes in the Active Share of the funds, as this measure usually remains stable over time. Nevertheless, a few funds didn’t exist for the entire period, so their observations began later than those of the others.
Main analysis
Firstly, for both groups of Active Share funds, we calculated the daily alpha relative to the benchmark chosen by the manager, in this case S&P 500, and compared it to the their average alpha.
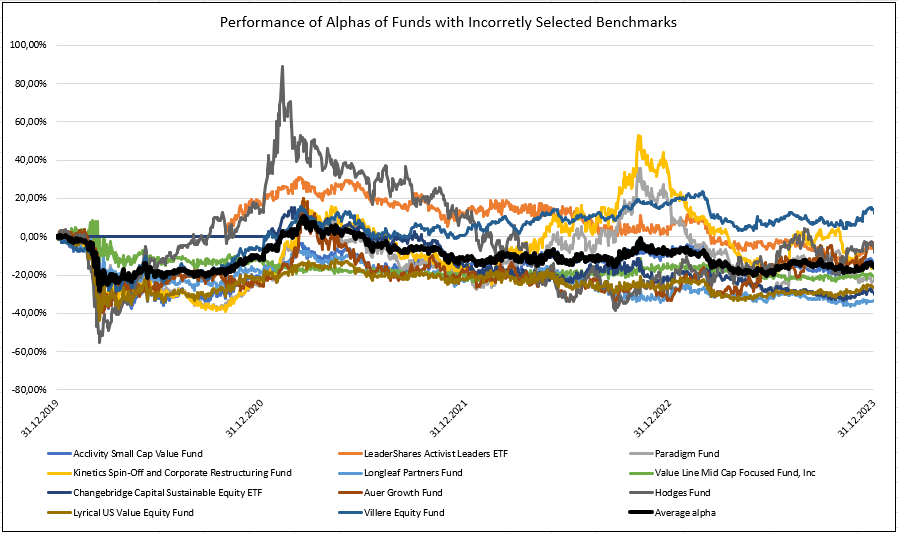
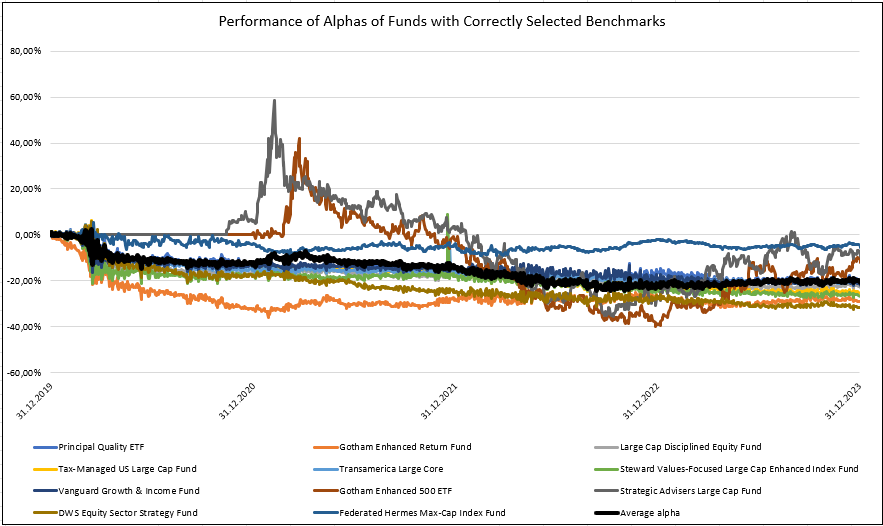
As we can see from both pictures, the average fund underperforms the benchmark (SPY ETF—SPDR S&P 500 ETF Trust and the index ETF we picked). This is not surprising and is adequate to the well-known fact that it’s hard to systematically harvest alpha in the mutual fund space in the large-cap US stocks investment universe.
Secondly, we calculated the daily adjusted prices of each fund, uploaded them into Quantpedia’s Portfolio Manager, and performed a factor analysis, as described in the article How to Replicate Any Portfolio. Afterwards, we conducted an Alpha Analysis, where each fund was decomposed into factors to determine which portion of its alpha is attributed to residual alpha – representing the unexplainable part of the fund, or the idiosyncratic risk of the manager, and which portion is attributable to synthetic alpha, the part of the alpha explainable by systematic factors. More details about Alpha Analysis procedure can be found in the article Quantpedia in November 2023.
Example
As an example of results achieved by performing these analyses on the examined Active Share funds, graphs related to the Longleaf Partners Fund are presented below. The Longleaf Partners Fund uses the S&P 500 as its benchmark for Active Share (99% Active Share), though this is an incorrect choice. Suitable benchmark for this fund is the S&P 500 Pure Growth (98% Active Share).
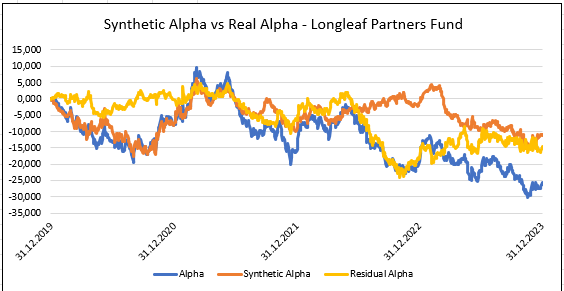
Picture 3 shows the decomposition of the fund’s Alpha into the part that can be explained by systematic factors – “Synthetic Alpha” and the part that stems from the individual idiosyncratic decisions of the fund manager – “Residual Alpha“. What is Picture 3 telling us? In this case, up until mid-2022, most of the returns of the fund could be explained by systematic factors (the blue line is very close to the orange one). After that, the manager started to take idiosyncratic bets that didn’t pay off (Residual Alpha, yellow line, plummeting together with fund Alpha against S&P 500, blue line). In 2023, fund underperformance continued together due to systematic factors to which the fund was exposed, and the fund ended up in the sample with a negative Alpha. Residual Alpha (idiosyncratic bets) and Synthetic Alpha (systematic bets) contributed approximately the same.

In the picture 4, we can review the Alpha decomposition in a better detail a and we see, that systematic factor, which underperformed the most were financials and the overall US equities market factor (towards which the fund was probably a little underweight). That systematic underperformance probably reflects the issue of the incorrectly chosen benchmark by the manager (benchmark other then S&P 500 should be picked by the manager).
However, this analysis was just an example of how alpha decomposition works on the individual level. We want to see what it looks like if we have more funds, and for that, we need to run alpha decomposition for all funds from our sample and average out the numbers.
Results
In this part of the study, we focused on analyzing the average synthetic alphas and average real alphas for both groups of funds.
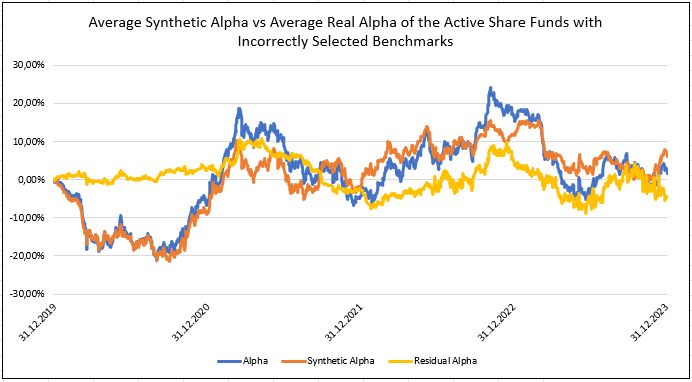
What’s the difference between Figures 5&6? Let’s look closer. Figure 5 depicts the average Alpha, Synthetic Alpha and Residual Alpha of funds that have a high Active Share measure, but they picked their benchmark incorrectly – another benchmark would be sufficient as their portfolio is not composed of S&P 500 stocks (or large-cap stocks) at all and, for example, are buying a lot of small/mid caps, or value stocks. Figure 5 shows that the summary alpha of those funds is approximately 0%, and most of the variation can be explained by systematic factors (the blue line, Alpha, is very close to the orange line, Synthetic Alpha). Idiosyncratic bets have a small impact on the funds’ performance. Funds may score high on the Active Share measure, but managers’ activity translates into systematic factor bets, and from the investors’ perspective, it can be easier and cheaper just to buy the ETF with the required factor exposure (small value, for example).
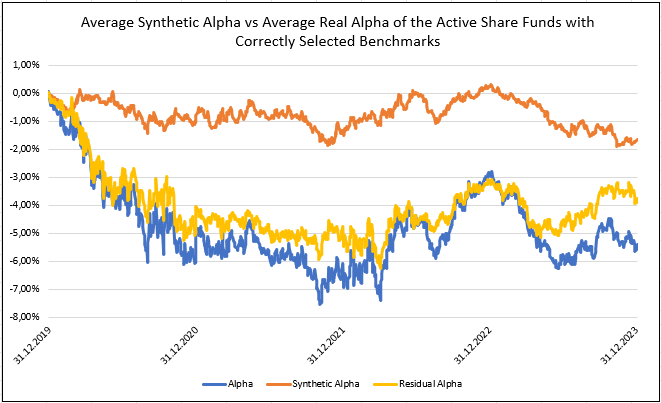
Figure 6 depicts the average Alpha, Synthetic Alpha, and Residual Alpha of funds that have the high Active Share measure, and they picked the correct benchmark – most of the funds’ bets are from the S&P 500 universe (or large-cap stocks in general). Managers of funds try to record overperformance against the benchmark by weighting stocks differently but using the same investment universe as the benchmark-like S&P 500 investment universe. We can see that this is a hard task to do, as, on average, the Alpha of these funds is negative. But on the positive side, their Synthetic Alpha is close to 0%, so as a group, they do not run any systematic factor bets (other than their exposure to large caps), and all of the Alpha can be explained by the idiosyncratic (individual) bets of managers, which selective pick their favorite stocks from the S&P 500 universe, overweight them and try to beat the benchmark. It’s a hard job to do, but at least here, the Active Share truly measures stock-picking activity.
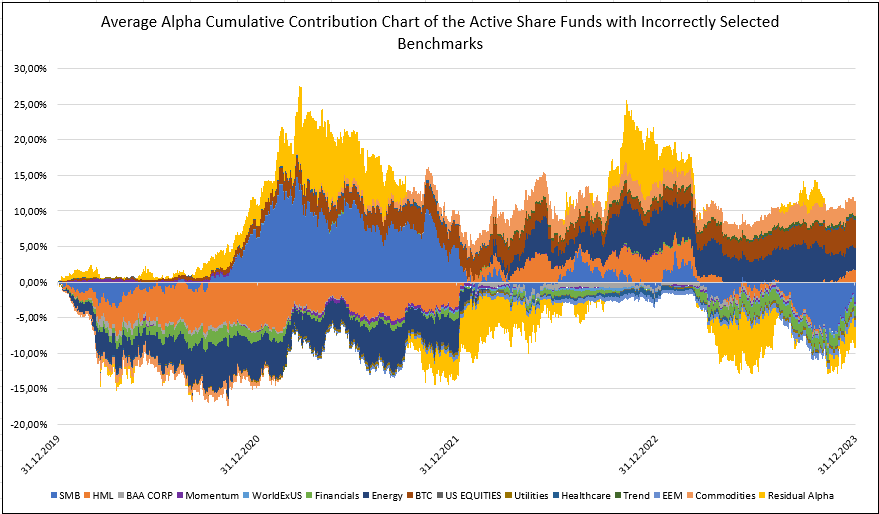
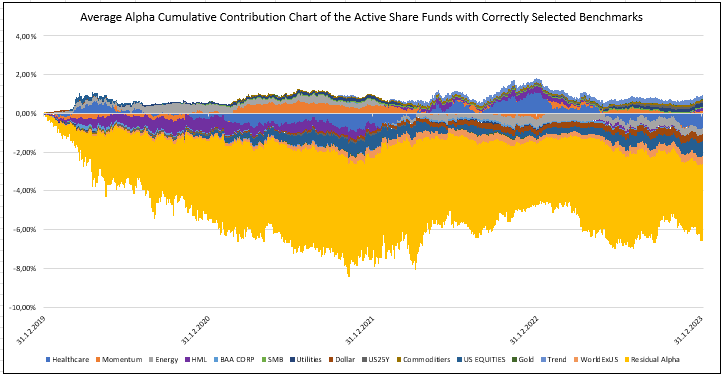
Once again, here are the Alpha decomposition charts, and we can see that the systematic factors (value/growth, small/big, momentum, and sector bets) have a profound impact on the first group of funds (Figure 7). On the other hand, in the second group (Figure 8), most of the alpha comes from stock picking (yellow area—residual alpha).
Conclusion
So, what’s our conclusion? The relationship between Active Share measure and alpha is more complex than it may seem at the first glance. Managers often choose benchmarks that are not entirely accurate, which leads to skewed information from Active Share. In this case, the managers over/underperformance is usually driven by systematic factors (large/small, value/growth, momentum, and/or sector factors) and not by individual stock-picking skill. Between managers, that pick accurate benchmarks for their funds, the alpha is driven by stock-picking skill but it also doesn’t mean that high active share should automatically translate into the fund’s outperformance. Therefore, in the best case, the insights gained from Active Share are highly distorted. To gain more meaningful insights into a manager’s performance and their relative over/underperformance compared to a benchmark, it is more effective to conduct a factor analysis of the alpha rather than relying solely on the simple measure of Active Share.
Author: Sona Beluska, Junior Quant Analyst, Quantpedia
Are you looking for more strategies to read about? Sign up for our newsletter or visit our Blog or Screener.
Do you want to learn more about Quantpedia Premium service? Check how Quantpedia works, our mission and Premium pricing offer.
Do you want to learn more about Quantpedia Pro service? Check its description, watch videos, review reporting capabilities and visit our pricing offer.
Are you looking for historical data or backtesting platforms? Check our list of Algo Trading Discounts.
Would you like free access to our services? Then, open an account with Lightspeed and enjoy one year of Quantpedia Premium at no cost.
Or follow us on:
Facebook Group, Facebook Page, Twitter, Linkedin, Medium or Youtube
Share onLinkedInTwitterFacebookRefer to a friend


