Estimating Rebalancing Premium in Cryptocurrencies
A long time ago, before elevators were a thing, a simple mechanism was used to get the miners in and out of the mines. This mechanism is called a “Man Engine” (or “Fahrkünst” in German language) and works on a simple principle of two reciprocating ladders and stationary platforms. The two ladders move up and down, so if a miner stands on one platform, he is not going anywhere.
However, if the miner jumps back and forth between the two ladders at the right time, he can easily get out of the mine.

(Source: Wikipedia – Man Engine)
There is an investment strategy, which works on a similar principle. Imagine having two assets that have zero return and high volatility. Similarly to the ladders, if we just buy one, we are not going to earn anything. However, if we buy both and rebalance them periodically, we can earn a so-called “rebalancing premium” or “diversification return”. In simple words rebalancing premium is the premium an investor gains from periodically rebalancing their portfolio.
Explaining The Anomaly
To explain how this anomaly could work in practice, imagine having a portfolio with two uncorrelated assets, one which is volatile but has high returns, and the second one which is not as risky but also has lower returns. If you decide to rebalance it periodically, you are essentially forced to buy the asset that has decreased in relative value and sell the asset which has appreciated in relative value, as measured by their weights in the portfolio.
If you set 50-50 weights at the beginning and let them drift without rebalancing, you will shortly have a pretty risky portfolio because the risky asset will take over. However, if you periodically rebalance to the 50-50 weights, you won’t have as much risk and will gain higher returns.
Another example we can demonstrate is a portfolio consisting of 30 assets, each with a mean daily return close to 0 and daily volatility of around 7.5%. We generated this data, and the following figure shows the cumulative returns of the individual assets.
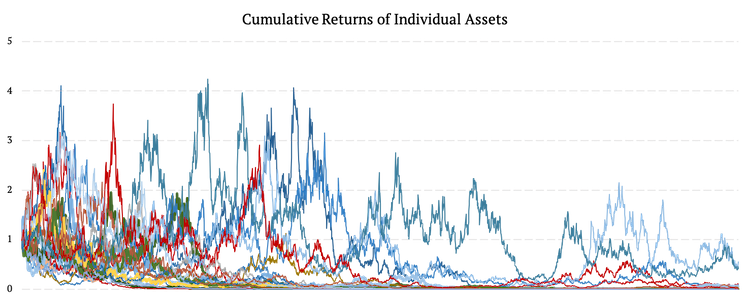
As we can see, neither of the assets consistently outperforms the other ones. And thus, this kind of data is a good candidate for rebalancing premium. In the next step, we compared how a buy-and-hold portfolio looks compared to a daily rebalanced portfolio. Additionally, we analyzed the annualized risk and return characteristics of such portfolios.
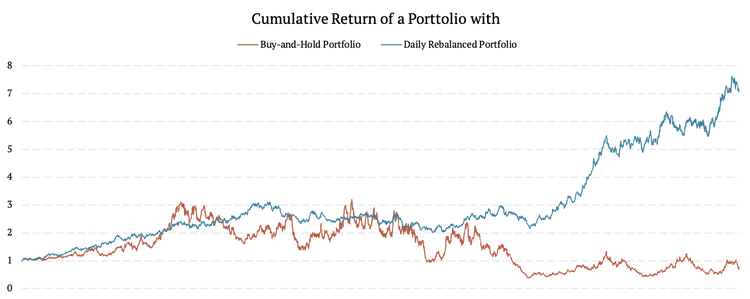
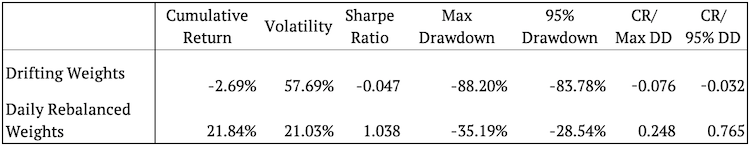
As we can see, the daily rebalancing not only improved the cumulative return of the portfolio it also lowered the volatility, thus increasing the Sharpe ratio. Moreover, the drawdowns are not as significant when applying daily rebalancing.
This anomaly is further analyzed in Diversification Return, Portfolio Rebalancing, and the Commodity Return Puzzle by Scott Willenbrock. The paper argues that a simple buy-and-hold portfolio does not earn a diversification return, though it generally has a lower variance than the weighted-average variance of its constituents. The cumulative return of a buy-and-hold portfolio is driven by the assets that perform the best and thus become a greater fraction of the portfolio.
On the other hand, there is a debate about the diversification return of the periodically rebalanced portfolios. Although multiple studies ascribe the diversification return to a reduction in variance, this paper explains that the underlying source of the diversification return is periodic rebalancing. Additionally, the paper emphasizes that the reduction in variance in a diversified portfolio is a necessary but not sufficient condition to earn a diversification return.
Rebalancing Cryptocurrency Portfolio
We cannot say whether cryptocurrencies will have positive or negative performance in the near future. There can be found research papers that argue both sides, and we stand somewhere in between. However, what we can say for certain is that cryptos are highly correlated with each other. That leaves us with two options: we can either construct a buy-and-hold portfolio of cryptocurrencies or a periodically rebalanced portfolio.
This paper analyzes whether the daily/ monthly rebalanced portfolio outperforms a simple buy-and-hold portfolio of cryptocurrencies and whether there is a rebalancing premium. Similarly to the example, we introduced at the beginning of this article. Moreover, in the second section, we also look at the combination of cryptos with bonds. We assume that the volatility of cryptocurrencies, in combination with low volatile assets such as bonds, could raise the overall performance while keeping the volatility at a reasonable level.
Analysis
In our analysis, we focused on rebalancing premium in cryptocurrencies. Our portfolio consisted of 27 cryptocurrencies with a time period from 31.12.2018 till 29.10.2021. The portfolio includes BAT (Basic Attention Token), BTC (Bitcoin), BTG (Bitcoin Gold), DAI (Dai), DATA (Data Coin), DGB (DigiByte), EOS (EIS.io), ETH (Ethereum), FUN (FUN Token), IOTA (Iota), LRC (Loopring token), LTC (Litecoin), MANA (Mana coin), NEO (Neo), OMG (OMG, Formally known as OmiseGo), REQ (Request), SAN (Santiment Network Token), SNT (Status), TRX (Tron), WAX (Wax), XLM (Stellar), XMR (Monero), XRP (Ripple), XVG (Verge), ZEC (Zcash), ZIL (Zilliqa) and ZRX (0x).
We analyzed three strategies. The first one, the Market Cap Benchmark strategy, is not rebalanced at all. We simply set equal weights at the beginning and let them drift. The second strategy is rebalanced daily. And the third strategy is rebalanced on a monthly basis.
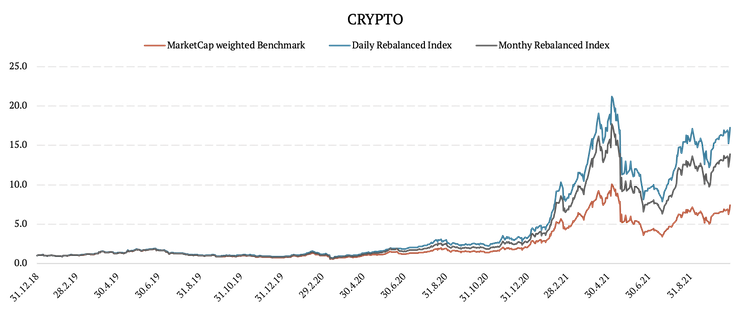
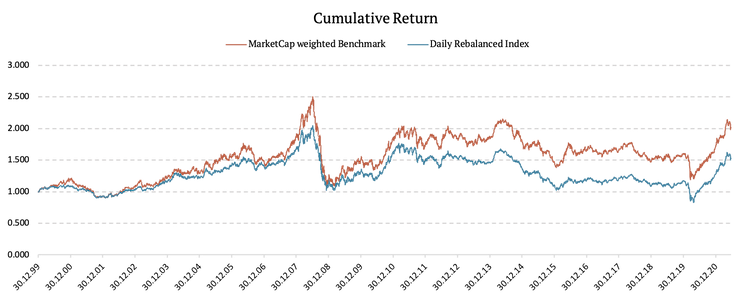
As we can see from the figure above, both the daily and monthly rebalanced portfolios outperformed the Market Cap weighted benchmark. Moreover, the daily rebalanced portfolio’s performance is even higher than the performance of the monthly rebalanced portfolio. Therefore, let’s now look at the following table of annualized risk and return characteristics of the abovementioned strategies.
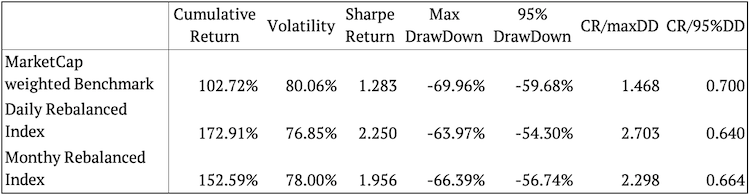
As we can see, the daily and monthly rebalancing not only increased the cumulative return but also reduced volatility resulting in overall higher Sharpe ratios. Additionally, the drawdowns are not as significant in the daily/ monthly rebalanced portfolios.
Long – Short Strategies
In this section we analyze the performance of a long-short cryptocurrency strategy. The strategy goes long 100% Daily Rebalanced Crypto Index and shorts X% of the Market Cap weighted Benchmark, where X% is 100%, 90%, 80%, 70%, 60%, and 50%. The figure shows the cumulative performance of the abovementioned long-short strategies.
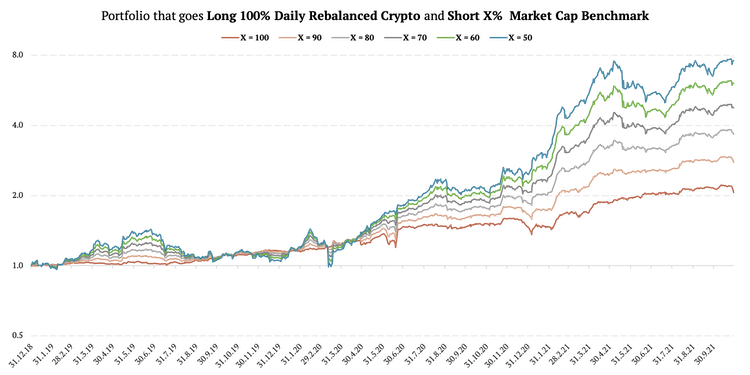
As we can see, the lower the percentage on the short side, the higher the cumulative performance. However, the strategies with a bigger short side seem to be less volatile. Let’s analyze the following table.
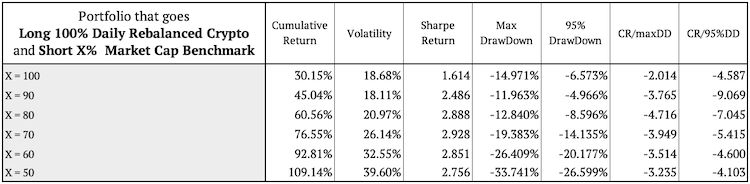
The annualized risk and return characteristics are represented in the table above. The Sharpe ratio of the strategy, which goes 70% short, is the highest. On the other hand, the strategy which goes 90% short has the smallest drawdowns. Finally, we can say that the long-short strategy improves compared to the long-only Daily Rebalanced Crypto Index.
Cryptos and Bonds
We can say that there is a significant rebalancing premium in cryptocurrencies. However, having a pure cryptocurrency portfolio is not the safest bet. On the other hand, cryptos could significantly improve the performance of a much safer portfolio. So, in the next section, we demonstrate another strategy that takes advantage of the rebalancing premium in cryptocurrencies. The following portfolio consists of IEI (iShares 3-7 Year Treasury Bond ETF) and all the cryptos from the previous section.
Overall, we analyze seven scenarios:
1) Portfolio, consisting of 95% IEI + 5% Market Cap weighted Benchmark of Cryptocurrencies, in which we let the weights drift
2) Portfolio, consisting of 95% IEI + 5% Market Cap weighted Benchmark of Cryptocurrencies, in which we rebalance the weights daily
3) Portfolio, consisting of 95% IEI + 5% Market Cap weighted Benchmark of Cryptocurrencies, in which we rebalance the weights monthly
4) Portfolio, consisting of 95% IEI + 5% Daily rebalanced Index of Cryptocurrencies, in which we let the weights drift
5) Portfolio, consisting of 95% IEI + 5% Daily rebalanced Index of Cryptocurrencies, in which we rebalance the weights daily
6) Portfolio, consisting of 95% IEI + 5% Monthly rebalanced Index of Cryptocurrencies, in which we let the weights drift
7) Portfolio, consisting of 95% IEI + 5% Monthly rebalanced Index of Cryptocurrencies, in which we rebalance the weights monthly
The following table shows the annualized risk and return characteristics of all the abovementioned strategies.
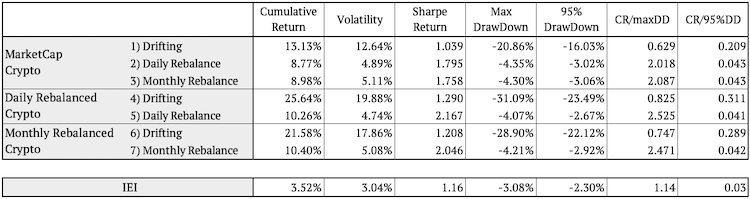
As we can see, all of the strategies 2-7 improve the Sharpe ratio of 100% IEI portfolio. However, if we let the weights drift (strategies 1, 4, 6) even though the performance is higher, so is the volatility, resulting in a lower Sharpe ratio compared to strategies that are periodically rebalanced (strategies 2, 3, 5, 7). Overall, it seems daily rebalanced portfolio consisting of 95% IEI and 5% daily rebalanced crypto portfolio (strategy 5) performed the best. And a monthly rebalanced portfolio consisting of 95% IEI and 5% monthly rebalanced crypto portfolio (strategy 7) being a close second. Both strategy 5 and strategy 7 have a Sharpe ratio above 2, and they are also the two with the smallest drawdowns.
Now let’s look at the following figures, showing the cumulative returns of the strategies 1-7.
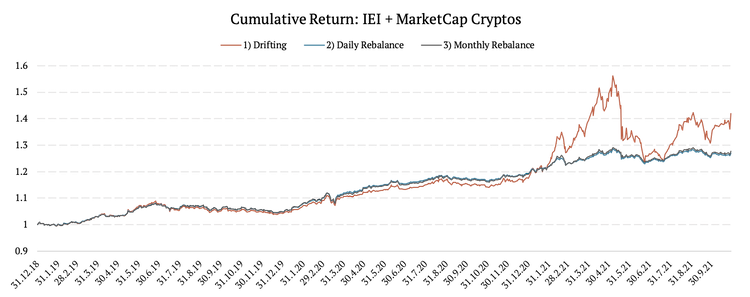
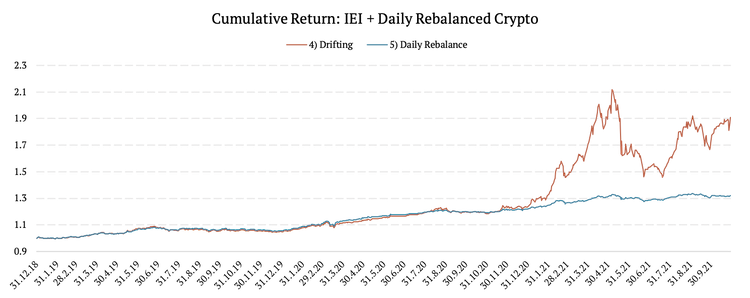
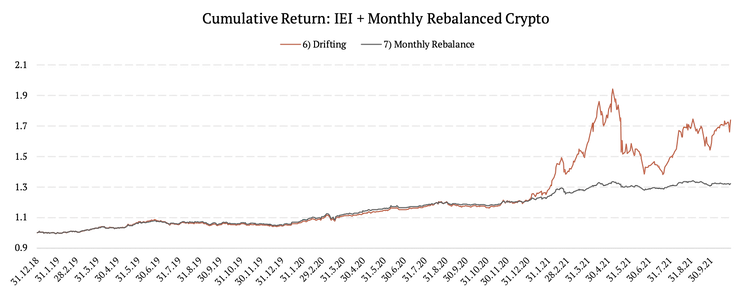
As we can see, in all the cases, the “drifting” strategy is significantly more volatile and thus resulting in a much lower Sharpe ratio.
Conclusion
Overall, we can say that there is a significant rebalancing premium in cryptocurrencies. Both the Daily rebalanced index and the Monthly rebalanced index improved the performance of a Market-Cap weighted benchmark. Additionally, to improve the Daily Rebalanced portfolio further, an investor can create a long-short strategy by shorting the Market-Cap weighted benchmark. The weight on the short side may vary, depending on the market conditions. However, it seems that any weight between 50% and 90% would improve the long-only strategy.
Moreover, the crypto portfolio can also improve the performance of less volatile assets, such as bonds, when combined in a periodically rebalanced portfolio.
However, all of this works because there is no outlier within the cryptocurrencies. By an outlier, we mean an asset that consistently outperforms the others. If there was an outlier, the rebalancing might not be profitable, and it might be wiser to let the weights drift. In such a case, the asset that outperforms the rest will take the majority weight and drive the entire portfolio’s performance.
Exactly this happened in 2010 with commodities. The following figure shows the individual daily returns of 31 commodities.
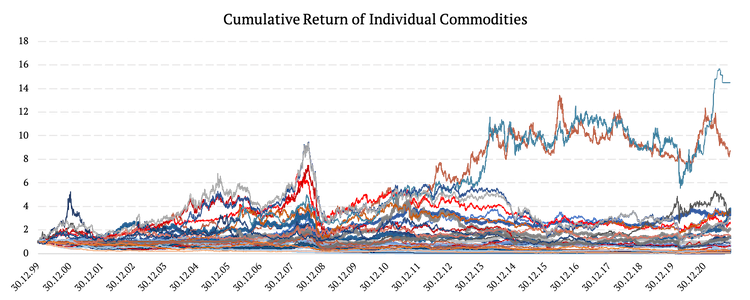
As we can see, until 2010, the performance of all commodities was similar, so it would be wise to rebalance this portfolio periodically. Then, however, the performance of the two commodities skyrocketed, and thus the periodical rebalancing is not profitable, as shown in the following figure.
This figure illustrates how the cumulative performance of the two strategies significantly changed mainly after 2010 when the returns of the two commodities rapidly grew. In another article, we will discuss how to find an outlier in our portfolio. Moreover, we will analyze what to do in such a case, whether to rebalance or take advantage of a momentum strategy.
Author:
Daniela Hanicova, Quant Analyst, Quantpedia
Are you looking for more strategies to read about? Sign up for our newsletter or visit our Blog or Screener.
Do you want to learn more about Quantpedia Premium service? Check how Quantpedia works, our mission and Premium pricing offer.
Do you want to learn more about Quantpedia Pro service? Check its description, watch videos, review reporting capabilities and visit our pricing offer.
Are you looking for historical data or backtesting platforms? Check our list of Algo Trading Discounts.
Would you like free access to our services? Then, open an account with Lightspeed and enjoy one year of Quantpedia Premium at no cost.
Or follow us on:
Facebook Group, Facebook Page, Twitter, Linkedin, Medium or Youtube
Share onLinkedInTwitterFacebookRefer to a friend


