Exploration of CTA Momentum Strategies Using ETFs
Introduction – CTA Funds
Commodity Trading Advisor (CTA) funds are commonly associated with managed futures investing in futures and options, and are a subset of the broader hedge fund universe[1]. Beyond commodities, they have the flexibility to venture into other assets, including interest rates, currencies, fixed income and equity indices. Most of the CTA strategies are trend-following in nature. Trend-following investing entails taking long positions in markets experiencing upward trends and short positions in markets undergoing downward trends, with the expectation that these trends will persist.
CTA funds as crisis hedges
CTA funds demonstrate a negative correlation with traditional assets, especially evident during periods of pronounced downturns in equity markets. This characteristic positions them as an appealing alternative investment option, serving as a protective measure against extreme events in financial markets and recognized for their potential effectiveness in safeguarding equities during market stress.
CTA funds have garnered substantial attention, particularly during and after the 2008 financial crisis. Despite their impressive returns observed in 2008, subsequent performance has been marked by disappointment and rather flat performance. Then, a series of global negative events occurred; first, it was the COVID-19 pandemic in 2019 and, shortly afterward, the Russian invasion of Ukraine. During this time, volatility and trends returned to financial markets, and CTA funds thrived.
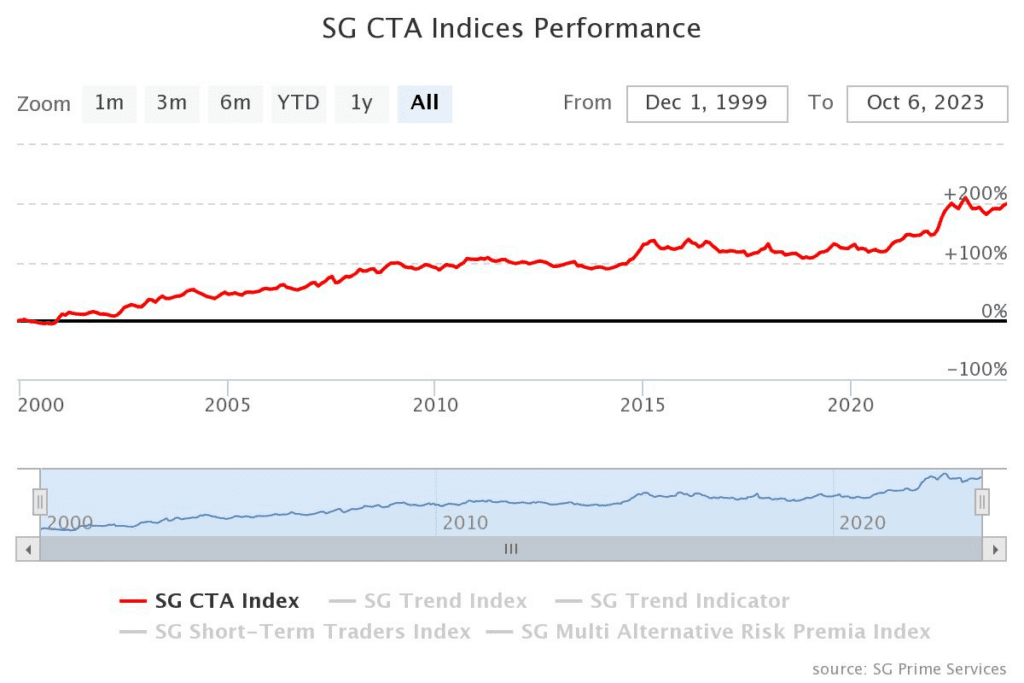
Figure 1 SG CTA Indices Performance
Figure 1 shows the performance of one of the diversified CTA funds – SG CTA Index throughout the time. The 2023 performance of the index was flat, but in a remarkable feat, the SG CTA Index[2] concluded the crisis year of 2022 with a substantial gain of 20.1%, marking its most impressive annual performance since Société Générale initiated the index calculation in 2000. The SG computes the daily net rate of return for a pool of Commodity Trading Advisors (CTAs) chosen from the most significant managers currently open to new investments. The 2022 performance underscores the effectiveness of managed futures strategies, highlighting their ability to thrive in the negative market environment.
In this paper, we devise a time series momentum model that involves creating a volatility-weighted blend of 3-month, 6-month, 9-month, and 12-month time-series momentum strategies across all four major asset classes using the dataset spanning from April 10th, 2006, to February 28th, 2023. We are not only interested in the performance of the diversified strategy itself but also in each of its sub-strategies and their contribution to its overall performance. We aim to explore trend-following strategies by creating a “CTA proxy” using ETFs across all asset classes. Using ETFs allows for maintaining the diversification of CTA funds and represents an alternative with easier data availability compared to futures contracts. Additionally, we are very interested in seeing the contribution of the short leg of CTA sub-strategies to performance, as we have a hypothesis that we can significantly improve the risk-return profile of the CTA strategies by removing a short leg from some sub-strategies.
However, it is important to note that CTA ETF proxy may not provide the same level of leverage as futures contracts. Nevertheless, for the purposes of this exploratory study, it is sufficient to utilize a maximum 2:1 leverage ratio on the final portfolio.
Data
The CTA universe consists of 13 ETFs traded between April 10th, 2006, and February 28th, 2023, spanning diverse asset classes. It comprises 6 stock ETFs, 3 bond ETFs and 3 commodities ETFs and 1 currency ETF.
Price data were obtained from Yahoo Finance, utilizing the Adjusted Close Price for each ETF. This metric reflects a stock’s closing price adjusted for stock splits, dividend distributions, and other relevant events that could affect stock’s value.
However, recently, Yahoo Finance discontinued free end-of-day data downloads. As a result, we recommend sourcing data from our preferred provider, EODHD.com – the sponsor of our blog. EODHD offers seamless access to +30 years of historical prices and fundamental data for stocks, ETFs, forex, and cryptocurrencies across 60+ exchanges, available via API or no-code add-ons for Excel and Google Sheets. As a special offer, our blog readers can enjoy an exclusive 30% discount on premium EODHD plans.
In the realm of stock ETFs, our selection comprises well-known entities such as SPDR S&P 500 ETF Trust (SPY), iShares Russell 2000 ETF (IWM) for small-cap exposure, iShares MSCI EAFE ETF (EFA) representing securities from Europe, Australia, and the Far East, iShares MSCI Emerging Markets ETF (EEM), iShares U.S. Real Estate ETF (IYR), and Invesco QQQ Trust (QQQ) focusing on technology and growth stocks. In the bond ETF category, our inclusion features iShares iBoxx $ Investment Grade Corporate Bond ETF (LQD), iShares 7-10 Year Treasury Bond ETF (IEF), and iShares TIPS Bond ETF (TIP), tracking the performance of U.S. Treasury inflation-protected public obligations. Within the realm of commodities ETFs, we encompass PDR Gold Shares (GLD), United States Oil Fund, LP (USO), and Invesco DB Commodity Index Tracking Fund (DBC), offering exposure to 14 commodities across various sectors. Lastly, currency ETFs include Invesco CurrencyShares Euro Currency Trust (FXE), designed to mirror the euro’s price.
Methodology
Our primary objective is to explore the Commodity Trading Advisor (CTA) strategy by constructing a CTA proxy using Exchange-Traded Funds (ETFs) instead of futures contracts. This approach allows us to capture the essence of CTA strategies while overcoming some of the practical challenges associated with trading futures contracts.
To establish our model, our first step involves computing the daily performance of all the ETFs in our dataset, serving as the foundation for subsequent analyses. Building on this, we calculate their performance over various time horizons, specifically examining the 3-month, 6-month, 9-month, and 12-month lookback periods. The next stage involves determining the average performance over these four distinct timeframes, providing a consolidated measure of each ETF’s medium to long-term trends. With this comprehensive dataset in hand, we proceed to derive our trend-following signals. These signals are generated based on the monthly signal of each ETF. A positive momentum (average of the 3-month, 6-month, 9-month, and 12-month lookback periods) at the end of a given month generates a positive signal, and conversely, a negative momentum generates a negative signal. We then group ETFs into the 4 groups (stocks, bonds+fx, commodities) and weight ETFs inversely in each group based on their past 20-day volatility. The final strategy weights three sub-strategies groups (stocks, bonds+fx, commodities) into the final strategy, once again using the inverse-volatility approach. This weighting methodology ensures a constant risk contribution from each ETF and asset class.
Our objective is to analyze the individual sub-strategies within the diversified CTA proxy and to quantify the contribution of each sub-strategy to the overall performance of the diversified portfolio. To achieve this, we first break down the diversified strategy into groups and then into various sub-strategies by taking different positions in each type of asset — taking long-only positions separately for stocks, bonds (plus currency) and commodities, long-short positions for stocks, bonds (plus currency) and commodities, and short-only position for stocks, bonds (plus currency), commodities. Then, we examine the performance of all sub-strategies and draw conclusions.
Results
We divide the results into two broad categories. First, let’s discuss our results for the diversified portfolio.
Long-only Diversified Portfolio (all assets/ETFs)
As shown in Table 1, the portfolio’s annualized performance stands at 3.43%, reflecting its average annual growth over the given period. The standard deviation is 5.10%, and the Sharpe ratio, a measure of risk-adjusted return, is at 0.67, suggesting a reasonable return considering the associated risk. In addition, the performance of a long-only diversified portfolio is depicted in Figure 2 in the form of the equity curve.
The performance may seem small, but it’s important to note that because our CTA proxy is volatility-weighed, low-risk fixed income and FX ETFs are a significant portion of the portfolio. Performance can be easily increased by employing broker’s leverage or by using leveraged ETFs. Our goal at this stage is not to maximize performance but to understand the drivers of the performance of individual sub-strategies.
| car | 3.43% |
| stdev | 5.10% |
| max dd | -10.39% |
| Sharpe ratio | 0.67 |
| Calmar ratio | 0.33 |
Table 1 Long-only diversified portfolio
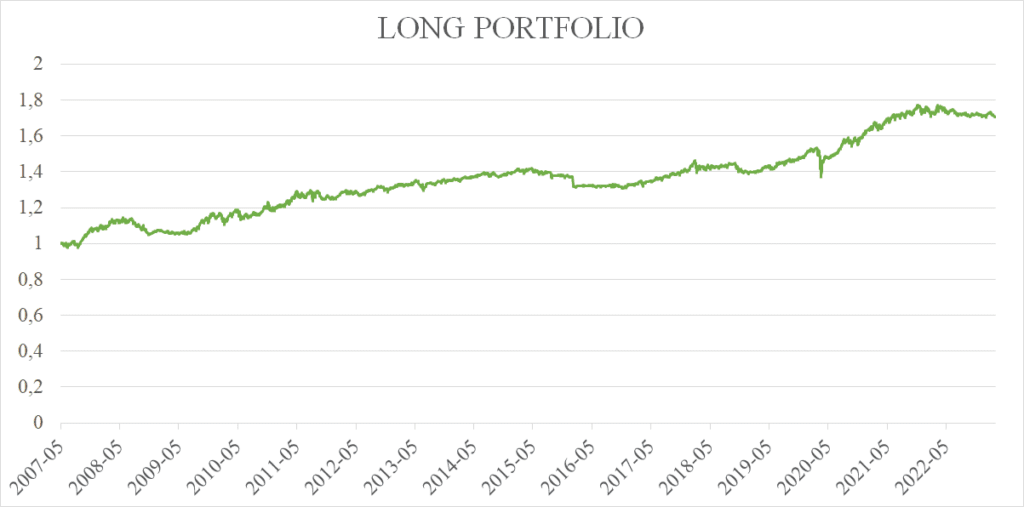
Figure 2 Long-only diversified portfolio
Short-only Diversified Portfolio (all assets/ETFs)
The short-only diversified portfolio exhibited a negative cumulative abnormal return of -0.62%, displaying a decline in value over the specified time period. With a standard deviation of 6.80%, the portfolio maintained a moderate level of risk, while its substantial maximum drawdown of -31.55% reflects a significant loss during adverse market conditions. The negative Sharpe ratio of -0.09 suggests that the return may not be sufficient to justify the risk taken, and the Calmar ratio of -0.02 emphasizes a significant risk associated with the short-only strategy. Financial characteristics mentioned are shown in Table 2. Figure 3 shows portfolio’s performance.
The short-only leg of the whole CTA Proxy strategy has, therefore, a negative contribution to the overall performance. The short-only leg may help the CTA Proxy to perform well in the crisis, but the cost for that is not negligible. We will try to amend the short leg of the strategy, decrease the costs, and improve the CTA Proxy strategy.
| car | -0.62% |
| stdev | 6.80% |
| max dd | -31.55% |
| Sharpe ratio | -0.09 |
| Calmar ratio | -0.02 |
Table 2 Short-only diversified portfolio
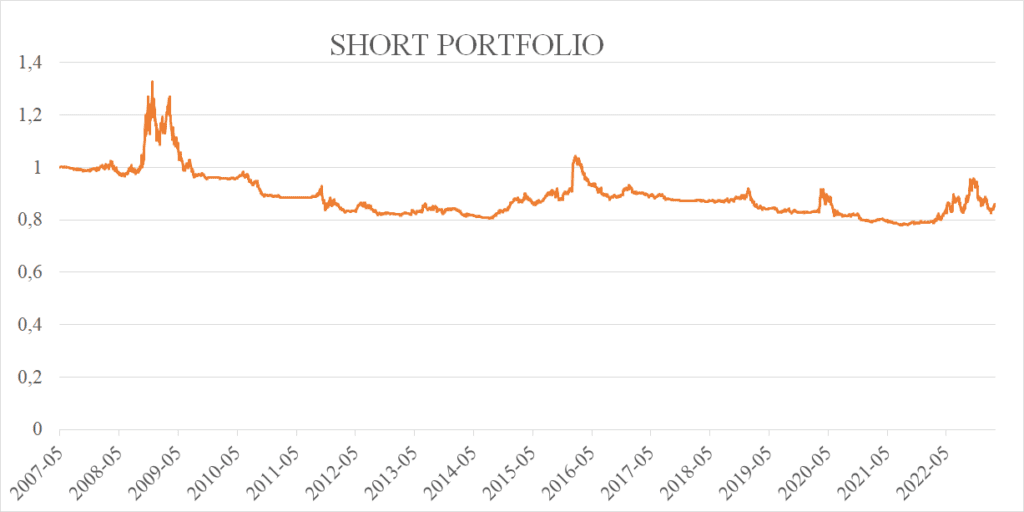
Figure 3 Short-only diversified portfolio
Long-Short Diversified Portfolio (all assets/ETFs)
Table 3 and Figure 4 illustrate the performance of the long-short diversified CTA-Proxy ETF portfolio. It achieved a cumulative abnormal return of 2.86%, with a higher volatility of 7.66% compared to the long-only counterpart. It experienced a substantial maximum drawdown of -19.45%, signaling increased vulnerability. The Sharpe ratio of 0.37 indicates that the portfolio’s return may not be adequately compensating for the higher risk.
The strategy involving both long and short positions across various asset types does not yield significant performance. It may have the “crisis hedge” characteristics, but the price for that is high. The question is, which of the individual short-only sub-strategies works as a drag on the overall performance of the CTA-Proxy ETF portfolio? Do you have any guesses? Let’s delve into the details in the next section.
| car | 2.86% |
| stdev | 7.66% |
| max dd | -19.45% |
| Sharpe ratio | 0.37 |
| Calmar ratio | 0.15 |
Table 3 Long-Short diversified portfolio
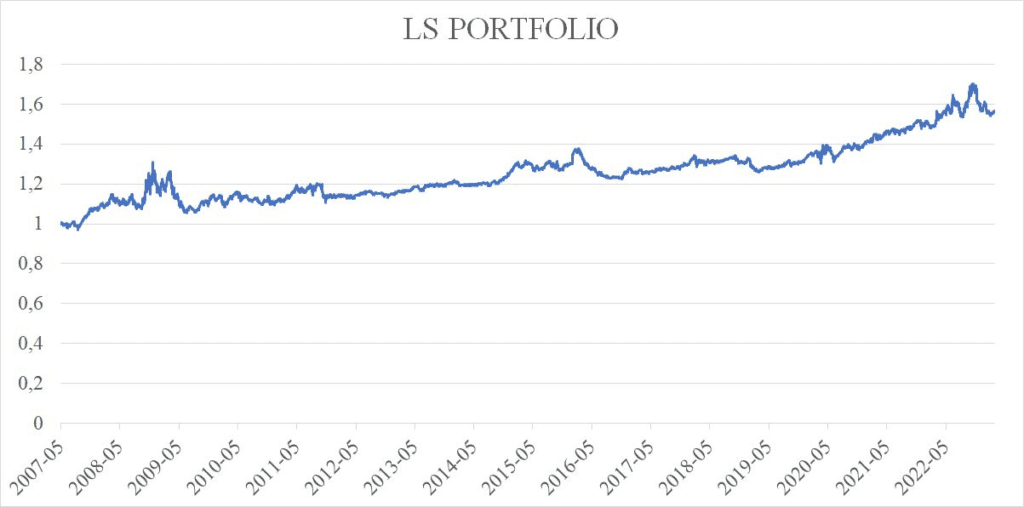
Figure 4 Long-Short diversified portfolio
Long-only (individual groups – stocks, bonds+fx, commodities)
As for long-only sub-strategies (when we take only the positive momentum signals and have a 0 position in a particular ETF when there is a negative momentum signal), sub-strategy using Stocks ETFs exhibits notable volatility (13.21%) and a substantial drawdown (-25.93%), however, leads in terms of cumulative abnormal return (4.13%), indicating the best overall performance among the three portfolios. Commodities sub-strategy exhibits high volatility (12.21%) and a substantial drawdown (-34,36%). Bonds+FX sub-strategy appears to be the least risky (3.96%), showing a more conservative performance (2.48%). Table 4 and Figure 5 present our results for taking long positions only. Overall, long-only strategies contribute positively to the overall performance of the CTA ETF proxy strategy.
| LONG | STOCKS | BONDS+FX | COMMODTIES |
| car | 4.13% | 2.48% | 3.67% |
| stdev | 13.21% | 3.96% | 12.21% |
| max dd | -25.93% | -8.34% | -34.36% |
| Sharpe ratio | 0.31 | 0.63 | 0.30 |
| Calmar ratio | 0.16 | 0.30 | 0.11 |
Table 4 Long-only stocks, bonds+fx, commodities
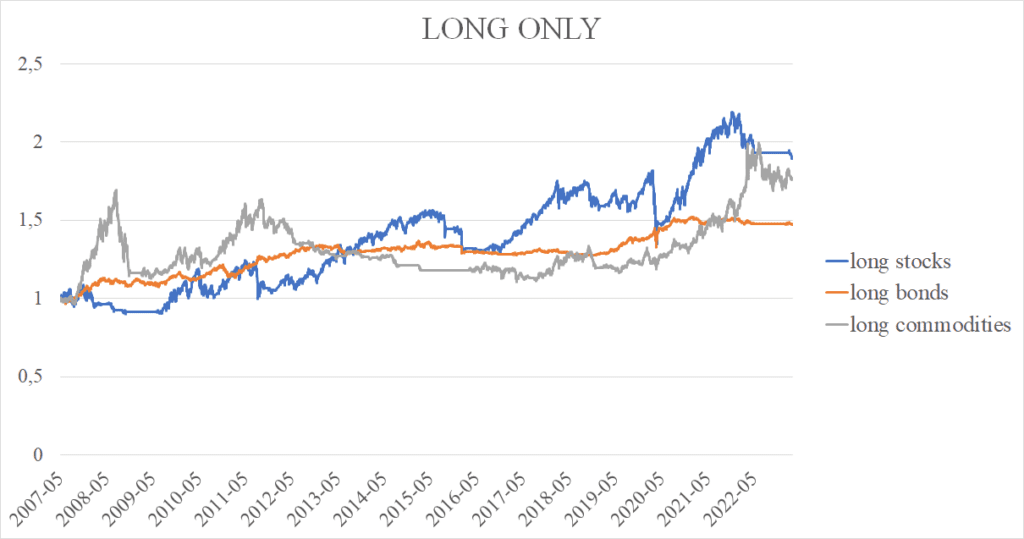
Figure 5 Long-only stocks, bonds+fx, commodities
Short-only (individual groups – stocks, bonds+fx, commodities)
The Short-only sub-strategy (when we take only the negative momentum signals and have a 0 position in a particular ETF when there is a positive momentum signal) using Stocks ETFs emerges as the riskiest with the highest volatility (16.64%) and an extensive drawdown (-72.66%). Furthermore, it yields a significantly negative annual performance of -4,94%. The Commodities sub-strategy follows in risk (12.11%) but yields positive cumulative annual returns of 0.53%. The Short Bonds+FX sub-strategy appears as the least risky, with lower volatility (4.21%) and a milder drawdown (-13.56%). The Short Bonds Portfolio stands out in terms of performance – with its annual return of 0.74%, being the best in performance among the three short portfolios. Table 5 and Figure 6 present our results for taking long-short positions.
| SHORT | STOCKS | BONDS+FX | COMMODITIES |
| car | -4.94% | 0.74% | 0.53% |
| stdev | 16.64% | 4.21% | 12.11% |
| max dd | -72.66% | -13.56% | -38.28% |
| Sharpe ratio | -0.30 | 0.18 | 0.04 |
| Calmar ratio | -0.07 | 0.05 | 0.01 |
Table 5 Short-only stocks, bonds+fx, commodities
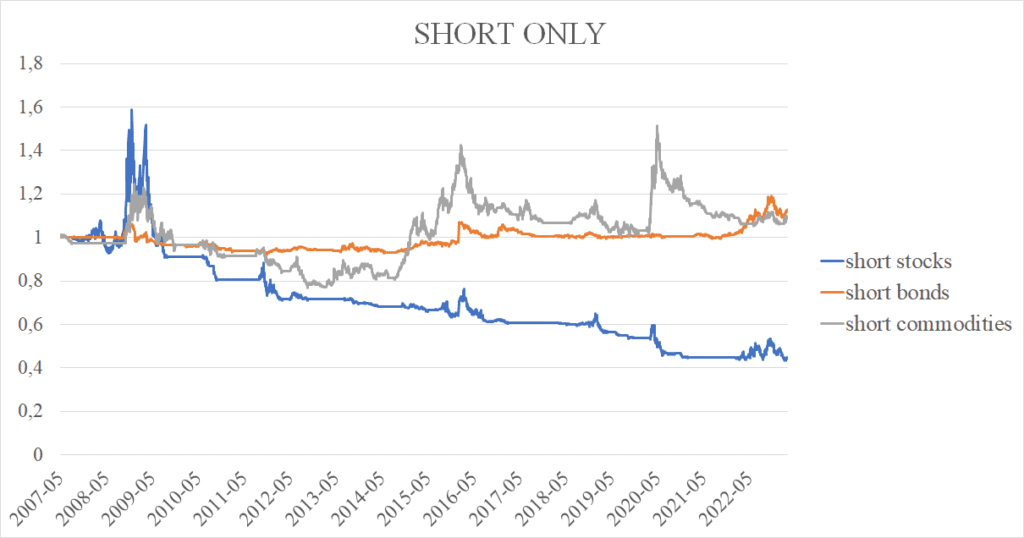
Figure 6 Short-only stocks, bonds+fx, commodities
Long-short (individual groups – stocks, bonds+fx, commodities)
The Long-Short sub-strategy using Stocks ETFs stands out as the riskiest with the highest volatility (19.35%) and a substantial drawdown (-50.02%). Its performance is negative (-0.63%) and so is its Sharpe ratio (-0.03). Long-Short Bonds+FX and Long-Short Commodities sub-strategies demonstrate positive returns, with Commodities leading in performance and Bonds+FX bearing the lowest risk. Table 6 and Figure 7 present the results for taking long-short positions.
| L/S | LS STOCKS | LS BONDS+FX | LS COMMODITIES |
| car | -0.63% | 3.28% | 4.36% |
| stdev | 19.35% | 5.18% | 16.34% |
| max dd | -50.02% | -10.58% | -39.73% |
| Sharpe ratio | -0.03 | 0.63 | 0.27 |
| Calmar ratio | -0.01 | 0.31 | 0.11 |
Table 6 Long-short stocks, bonds+fx, commodities
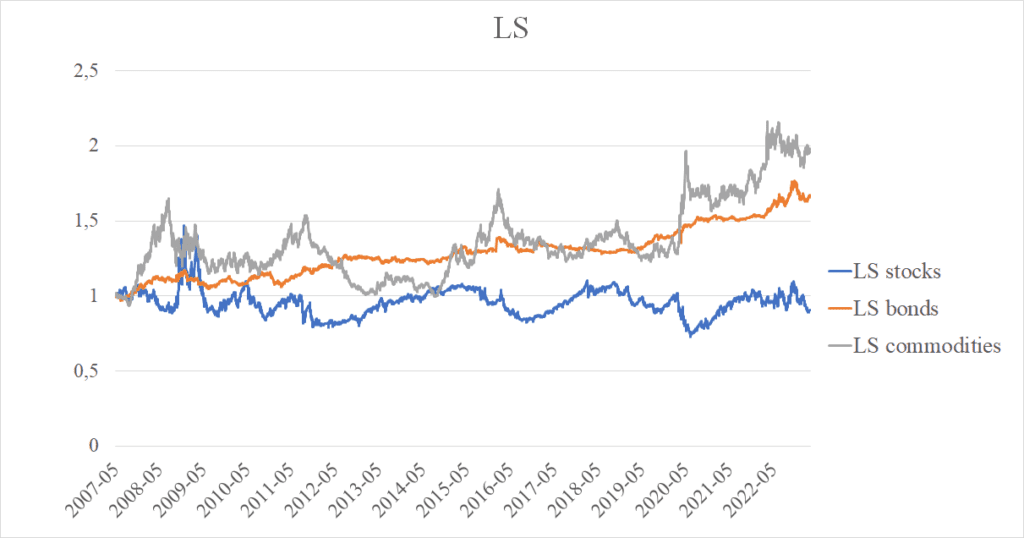
Figure 7 Long-short stocks, bonds+fx, commodities
A new CTA ETF Proxy strategy proposed
Our aim was to explore trend-following strategies and how taking different positions in different asset classes influences the final performance of the diversified CTA ETF Proxy strategy. As the results show, the short-only CTA ETF Proxy sub-strategy (when we take only the negative momentum signals and have a 0 position in a particular Stocks ETF when there is a positive momentum signal) does not provide a positive contribution to the whole CTA ETF Proxy strategy performance. Although, from time to time, a short position in stocks is useful as a crisis hedge, it is done at costs that are too high, especially when we compare this short-only sub-strategy in equity ETFs sub-universe to the short-only (or long-short) sub-strategies, that use the commodities-only ETFs or bonds+fx ETFs, which are sufficient crisis hedges at minimum costs.
Our final recommendation is thus to modify model in the following way: employ the long-short positions for bonds+fx and commodities ETFs, however long-only positions for stocks ETFs. This gives us the highest Sharpe ratio of all the alternatives as seen in Table 7.
| car | 4.11% |
| stdev | 5.27% |
| max dd | -9.08% |
| Sharpe ratio | 0.78 |
| Calmar ratio | 0.58 |
Table 7 Long-short bonds+fx and commodities ETFs, long-only equities ETFs
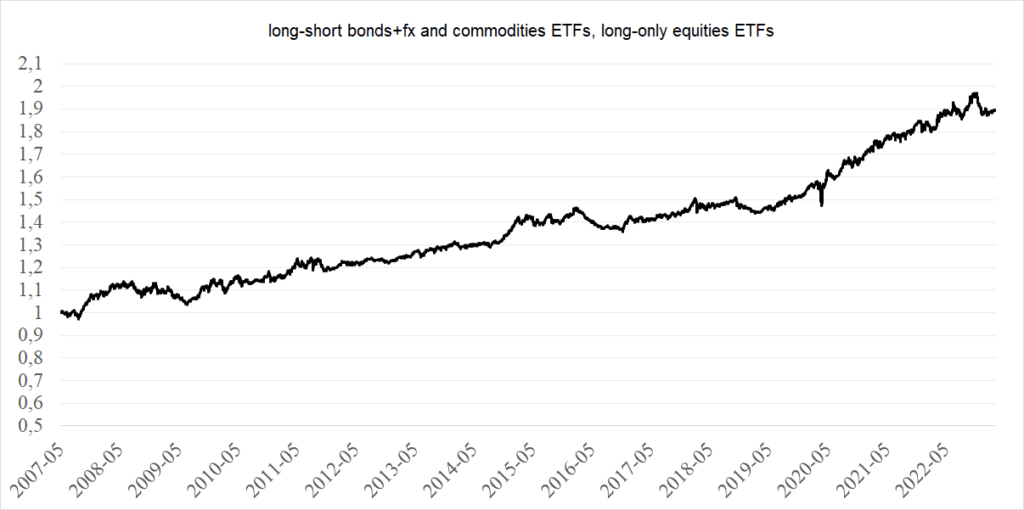
Figure 8 Long-short bonds+fx and commodities ETFs, long-only equities ETFs
As we mentioned before, lower performance can be explained by volatility weighting, concentration in the low-risk ETFs, and using ETFs instead of futures. But the performance can be increased by levering this strategy.
So, finally, to amplify the returns of the proposed strategy, we use 2:1 leverage and present the results in Table 8 and Figure 9.
| car | 8.08% |
| stdev | 10.54% |
| max dd | -17.80% |
| Sharpe ratio | 0.77 |
| Calmar ratio | 0.45 |
Table 8 Leveraged proposed CTA ETF Proxy strategy
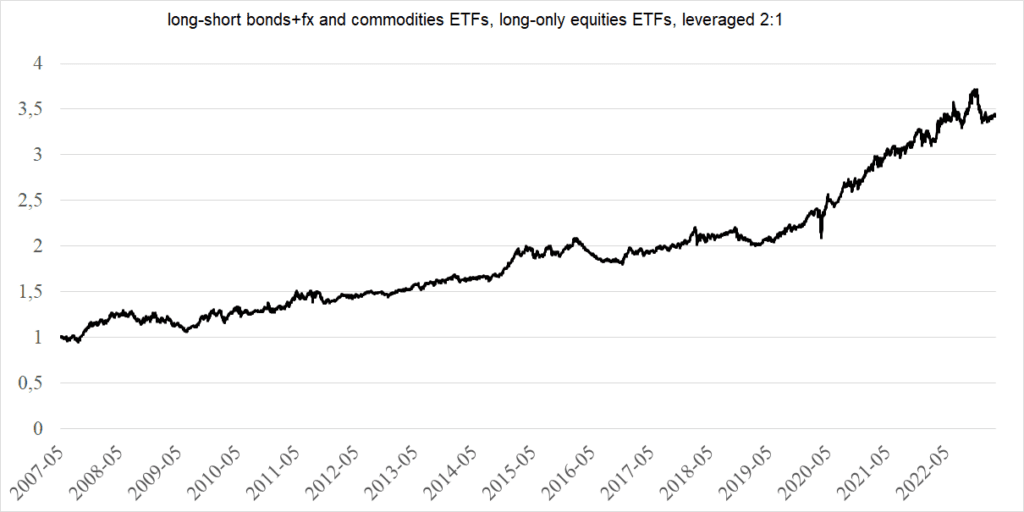
Figure 9 Leveraged proposed CTA ETF Proxy strategy
Conclusion
Commodity Trading Advisor (CTA) funds, despite their name, encompass strategies involving various asset classes, including stocks, bonds, and currencies. As demonstrated during crises such as the financial crisis in 2008 or the COVID-19 crisis, these funds prove effective as a hedge and gain popularity during bad market conditions. CTA funds are considered trend-following. Generally, trend-following strategies are formulated by going long on all assets with positive past returns and taking a short position in all assets with negative returns over the same period.
This paper aims to delve into the exploration of individual components of the CTA strategy, understanding the performance of different assets within it. We have devised a model based on the averages of 3, 6, 9, and 12-month performances of ETFs of all asset classes – stocks, bonds, commodities and currencies. This model allows us to explore how adopting different positions based on trend signals across diverse asset classes contributes to the overall strategy’s performance. As it turns out, taking short position in stock component of CTA strategy does not provide any benefits. Building on our findings, we propose the following amended investment strategy: taking long-short positions in bonds, currencies and commodities and long-only in stocks. This strategy offers the highest Sharpe ratio and possibility to use leverage.
[1] FUNG, William; HSIEH, David A. A primer on hedge funds. Journal of empirical finance, 1999, 6.3: 309-331.
[2] https://wholesale.banking.societegenerale.com/en/prime-services-indices/
Share onLinkedInTwitterFacebookRefer to a friend


