The Russia-Ukraine war is a conflict that has not been in Europe since WW2. And it has great implications not only on human lives but also on security prices. It bears numerous characteristics of the cold war crises, where two nuclear powers (Soviet Union and USA/NATO) were often very close to hot war or were waging a proxy war in 3rd countries. We thought it might be wise to look at similar periods from the past to understand what happens in such situations. We selected five events and analyzed the performance of main equity factors (market, HML, SMB, momentum & 2x reversal) and energy and fixed income proxy portfolios.
Cold War Conflicts
The Cold War was a 44-year long period of geopolitical tension between the United States and the Soviet Union. The two parties, which were in a temporary alliance against Nazi Germany during World War II, started the ideological and geopolitical race for global influence shortly after.
From Wikipedia, “The term cold war is used because there was no large-scale fighting directly between the two superpowers, but they each supported major regional conflicts known as proxy wars.” The slow expansion of their influence had consequently divided Europe into two blocks. Western Europe had the support of the United States, while the countries of Eastern Europe became satellites of the USSR.
We choose numerous cold war crises periods which we think best resemble today’s situation in Europe. All the selected incidents carried a high risk of conflicts between the nuclear powers. We understand that our list may be arbitrary, and other analysts could pick different events. But we still feel that it’s still useful to look into the past to learn something about the present. This article is similar to our Quantpedia Pro Crisis Analysis report, but it covers a longer time span.
Event 1. – Berlin Blocade
After WW II, Germany was divided into four temporary occupation zones. The zones were under the control of the United States, the United Kingdom, France, and the Soviet Union. Despite Berlin’s location entirely inside Soviet-controlled eastern Germany, the city was also divided into four occupation zones. The United States, United Kingdom, and France controlled western parts of Berlin, while Soviet troops controlled the city’s eastern sector.
The western allies introduced the new official currency, the Deutsche Mark, against the will of the USSR. Subsequently, the Soviet Union blocked all ground access (railway, road, and canal) to Berlin for the Western Allies. The Berlin Blockade started on June 24th 1948. They offered to drop the blockade under the condition of withdrawing the new currency. The actions forced the Western parties to create the “Berlin Air Bridge,” supplying the people of West Berlin by the air forces.
The USSR lifted the blockade of West Berlin on May 12th, 1949, due to economic issues in East Berlin.
Event 2. – Korean War
After Koreas surrendered at the end of WW II, The United States and the Soviet Union divided the country into two occupation zones. The Soviets claimed the northern zone, and the Americans administered the southern area. In 1948, the occupation zones became two sovereign states due to Cold War tensions. As a result, a socialist state, the Democratic People’s Republic of Korea, was established north. In contrast, a capitalist state, the Republic of Korea, was established in the south. Neither party accepted the border as permanent.
The Korean war between North Korea and South Korea began on June 25th, 1950, when North Korea invaded South Korea following clashes along the border. China and the Soviet Union supported North Korea, while South Korea had support from the United Nations, principally the United States. The fighting ended with a ceasefire on July 27th 1953.
Event 3. – Suez Crisis and Hungarian Revolution of 1956
The aim of an invasion of Egypt in late 1956 by Israel, the United Kingdom, and France was to regain control of the Suez Canal. They also aimed to remove the Egyptian president, who had just nationalized the foreign-owned Suez Canal Company, which administered the canal. Before the nationalization, the company was owned primarily by British and French shareholders.
Britain and France issued a joint ultimatum to a ceasefire. However, the request was ignored, which led the two countries to send paratroopers along the Suez Canal and block it. As a result, the Suez Canal was blocked from all shipping by sinking 40 ships. It later became apparent that Israel, France, and Britain had conspired to plan the invasion.
There was heavy political pressure from the United States, the Soviet Union, and the United Nations to end The Suez Crisis. The president of the United States had strongly warned Britain not to invade. He also threatened to sell the U.S. government’s pound sterling bonds. The Suez Canal was closed from October 1956 until March 1957.
During the same time, there was a countrywide revolution against the Stalinist government of the Hungarian People’s Republic. The Hungarian Revolution began on October 23rd, 1956, in Budapest when university students petitioned the civil populace to join them at the Hungarian Parliament Building. The students wanted to protest the USSR’s geopolitical domination of Hungary with the Stalinist government.
Additionally, they broadcasted their 16 demands for political and economic reforms from the building of Hungarian Radio and later were detained by security guards. Police officers from the ÁVH killed several student protestors during the uprising, which led to a battle between the people of Hungary and the ÁVH. The new government disassembled the ÁVH, declared Hungary to retire from the Warsaw Pact, and pledged to re-establish free elections.
Event 4. – Berlin Crisis of 1961
On June 4th, 1961, Soviet First Secretary of the Communist Party Nikita Khrushchev issued the ultimatum for a separate peace treaty with East Germany at Vienna Summit. The Soviet Union demanded the withdrawal of all armed forces from Berlin, including the Western armed forces in West Berlin. Adoption of this ultimatum would lead to the end of the existing four-power agreements guaranteeing American, British, and French rights to access West Berlin and the occupation of East Berlin by Soviet forces.
The United States, Great Britain, and France did not accept the unilateral treaty. Instead, the United States specified vital interests in its policy for Berlin and linked all of them only to the western part of the city. John F. Kennedy proclaimed: “We seek peace, but we shall not surrender.”
However, as the conflict over Berlin grew, people started leaving for the West. The First Secretary of the Socialist Unity Party and Staatsrat chairman and thus East Germany’s chief decision-maker persuaded the USSR that force was necessary to stop the migration of people. Thus the idea of the Berlin Wall was created, although the city’s four-power status required free travel between zones.
On Saturday, August 12th, 1961, Walter Ulbricht signed the order to close the border and erect a wall around West Berlin. At midnight, East Germany’s border police, the East German army, and units of the Soviet Army began to close the border. By morning on Sunday, August 13th, 1961, the border to West Berlin had been shut, and the construction of The Berlin Wall began.
Event 5. – Cuban Missile Crisis
The one conflict that has gotten the closest to escalating into a full-scale nuclear war was the Cuban Missile Crisis. After the presence of American Jupiter ballistic missiles in Italy and Turkey, Soviet First Secretary Nikita Khrushchev agreed to Cuba’s request to place nuclear missiles on the island to deter a future invasion.
After careful consideration, President Kennedy ordered a naval “quarantine” to prevent further missiles from reaching Cuba. By operating under the term “quarantine” instead of “blockade,” the United States avoided the implications of a state of war. The US reported it would not allow offensive weapons to be delivered to Cuba and insisted on returning all the weapons already in Cuba to be returned to the USSR.
After days of negotiations, Kennedy and Khrushchev reached an agreement. The Soviets would disassemble their offensive weapons in Cuba and return them to the Soviet Union; for the U.S. to publicly declare not to invade Cuba again.
Cold War Events Analysis
The abovementioned events are the main subject of this article. We analyze the Fama and French 3 Factors (Mkt, SMB, HML), Momentum, Short-Term Reversal Factor, Long-Term Reversal Factor, and 10 Industry Portfolios during the time of the events.
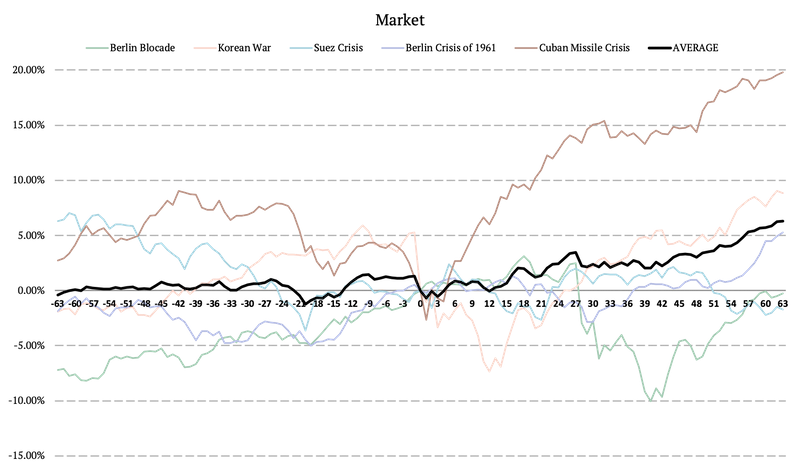
Market During Cold War
Firstly, we analyze the market’s movement during the abovementioned Cold War events. The following figure illustrates the equity curves of the market during different periods. The black curve represents the market’s average performance during the five periods. Additionally, the zero on the x-axis signifies the day “D,” the day when each event begins. On the left to the zero are the 3-months before the event, and to the right are 3-months after.
At first glance, it seems that the market factor continued performing well once the initial phase of the crisis ended. The highest volatility was during the Cuban Missile Crisis, which is understandable (as it was the point at which the nuclear conflict among superpowers was probable).
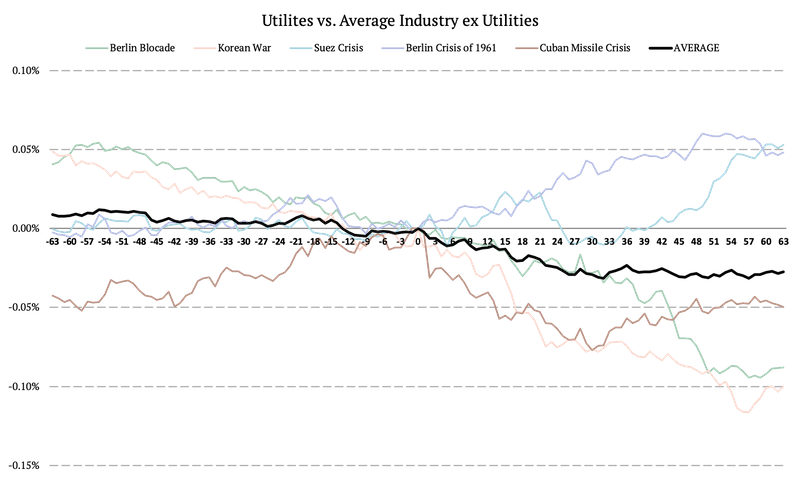
Safe-Haven Assets During Cold War
Secondly, we look into how safe-haven assets would behave during the Cold War Events. Unfortunately, we do not have a good proxy for the daily prices of government bonds as the market was not so well developed in the 40s and 50s (most of the bonds were bought and held until maturity). But we can try to figure out something different. We use the 10 Industry Portfolios to create a bond-like portfolio by going long utilities and shorting the nine industries’ average. The performance of the utility sector is strongly influenced by the level of interest rates and is mostly considered a safe-haven asset. Therefore, the long-short portfolio should have a bond-like payoff. Again the x-axis represents the 63 days prior to the event, the day of the event (day zero), and 63 days after the event’s beginning.
What does our analysis show? The utility stocks underperform the average industry, showing us that bond-like assets were probably not a good hedge. Why? The shock is usually inflationary, as we will see in the next paragraph.
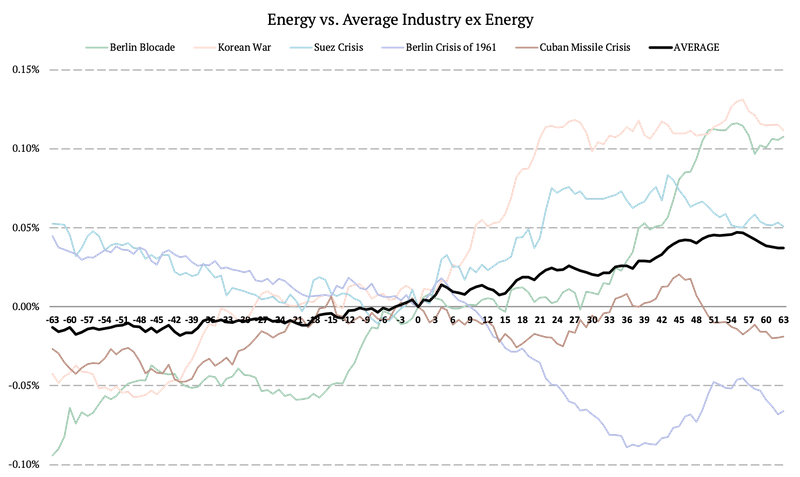
Energy Prices Proxy
Additionally, we examine the energy or crude oil proxy by calculating another long-short portfolio. Again, we analyze the 10 Industry Portfolios, and we calculate portfolio that goes long energy and shorts the average of the nine industries ex. energy. Similar to the previous figures, the x-axis represents the 63 days prior to the event, the day of the event (day zero), and 63 days after the event’s beginning.
Our analysis shows that cold war crises were almost always inflationary in nature. As the current situation is too…
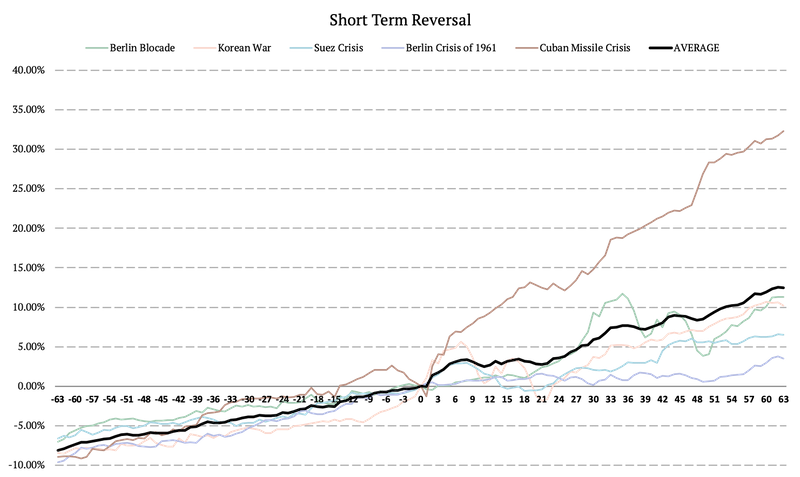
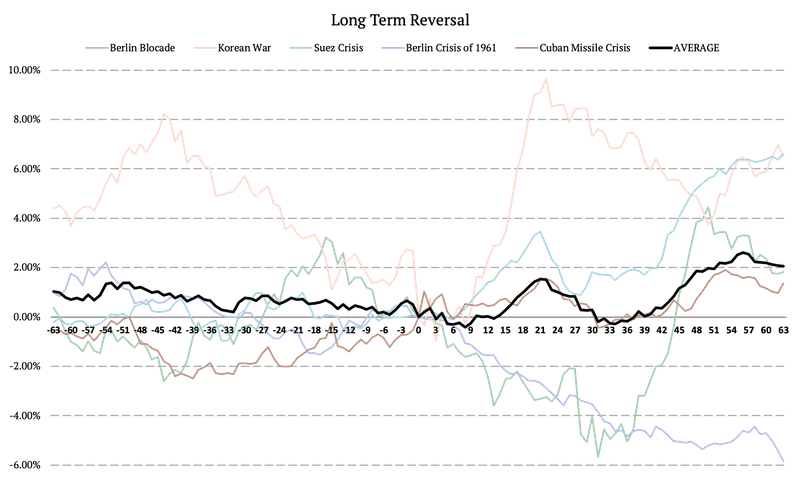
Long Term Reversal vs. Short Term Reversal
Now, let’s explore the difference between the long-term reversal factor and the short-term reversal factor during various Cold War events. As we can see from the figures, the short-term reversal factor performs well before and after the crises. But what’s remarkable is that the short-term reversal factor significantly performs after each event. Reversal anomalies often exploit volatile periods on the market, when short term-stress causes temporary strong idiosyncratic movements in stocks, which increases in-efficiencies. It seems that short-term reversal prospers in such an environment. On the other hand, for the majority of the mentioned events, the performance of the long-term reversal effect is very different before and after the event, and there is no clear trend.
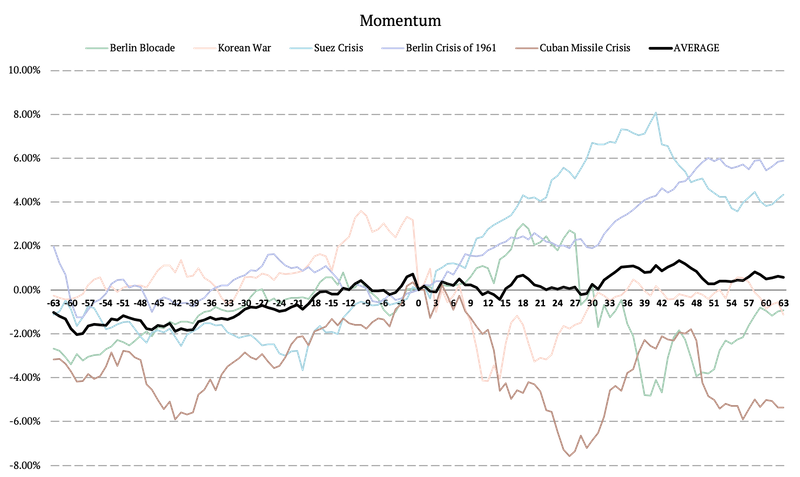
Momentum Effect During the Cold War
Similar to the long-term reversal factor, the performance of the momentum effect doesn’t have clear trend before and after the start of the various events. Plus, there is a significant difference how momentum performs during various events.
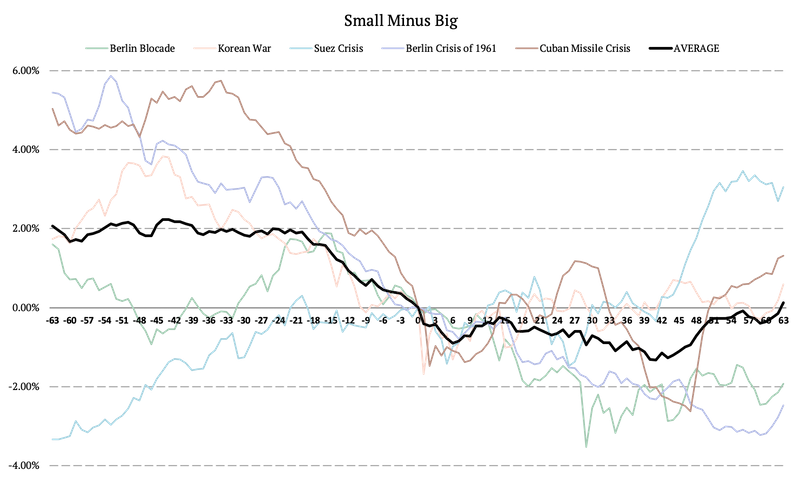
SMB and HML
Small Minus Big (SMB) and High Minus Low (HML) are two of the Fama and French 3 Factors. SMB is defined as the average return on the three small portfolios minus the average return on the three big portfolios. The performance of SMB was falling significantly before the majority of the crises. It means that large-cap stocks usually outperform in weeks before crisis events. The only time the performance was not falling was before the Suez Crisis. Additionally, the performance of SMB became more volatile after all of the events.
Secondly, HML is defined as the average return on the two value portfolios minus the average return on the two growth portfolios. The volatility of HML was low before the events of the Cold War. However, the performance usually rose dramatically after the start of the average crisis; the best performance was after the start of the Korean War or one month after the Berlin Blockade.

Conclusion
This article examines five events from the Cold War which came very close to evolving into an actual war. We choose numerous conflicts which we think best resemble today’s situation in Europe. All the selected incidents carried a high risk of conflicts between the nuclear powers.
We analyzed the performance of the Fama and French 3 Factors (Mkt, SMB, HML), Momentum, Short-Term Reversal Factor, Long-Term Reversal Factor, and 10 Industry Portfolios during the time of the events. The article presents the performance of each factor during multiple crisis periods. Also, average performance is calculated for each factor in various periods. Overall, we can say that in some cases, performance does not change much after a substantial event. But, on the other hand, there are many examples of dramatic change in the performance after a conflict/crisis occurred.
Author:
Daniela Hanicova, Quant Analyst, Quantpedia
Are you looking for more strategies to read about? Sign up for our newsletter or visit our Blog or Screener.
Do you want to learn more about Quantpedia Premium service? Check how Quantpedia works, our mission and Premium pricing offer.
Do you want to learn more about Quantpedia Pro service? Check its description, watch videos, review reporting capabilities and visit our pricing offer.
Or follow us on:
Facebook Group, Facebook Page, Twitter, Linkedin, Medium or Youtube
Share onLinkedInTwitterFacebookRefer to a friend


