The dominance of mega-tech stocks, particularly the “Magnificent 7,” in both U.S. and global equity indexes has a profound impact on factor portfolios. When constructing value-weighted smart beta strategies, these portfolios often end up heavily concentrated in a few individual stocks. This concentration introduces idiosyncratic risk, skewing the risk profiles of factor strategies. While no active strategy can entirely avoid the influence of these high-market-cap stocks, it is critical to limit their exposure to reduce idiosyncratic risk and improve the stability of factor-based approaches.
The latest research paper by David Blitz timely showcases how the rise of mega tech stocks has created new dynamics in active portfolio management. The paper contrasts two approaches: smart beta indices and diversified factor strategies with tracking error management.
Smart beta indices focus on capturing a single factor premium, often taking large overweight or underweight positions in individual stocks, such as those in the Magnificent 7. This can lead to significant performance swings based on the fortunes of these mega-cap stocks, raising questions about whether the returns are driven by factor risk or idiosyncratic risk.
On the other hand, diversified factor strategies with tracking error management, such as enhanced indexing, aim to generate consistent outperformance through diversified factor exposure while minimizing idiosyncratic risk. These strategies involve taking numerous small overweight and underweight positions in stocks based on their factor characteristics, with explicit tracking error control to limit the active position in each stock. This approach helps contain idiosyncratic risk and makes the strategy largely immune to changes in index concentration.
No active strategy is completely immune to the rise of high-flying tech stocks. However, it’s important to rely on proper risk control to prevent active management from becoming overly reliant on the performance of a few mega-cap stocks. By maintaining a balanced approach and managing tracking errors, investors can mitigate the effects of increased index concentration and achieve a better risk-return tradeoff.
Authors: David Blitz
Title: Implications of Increased Index Concentration for Active Investors
Link: https://papers.ssrn.com/sol3/papers.cfm?abstract_id=5150910
Abstract:
This short article examines the implications of the rise of mega tech stocks for active portfolio management. We show that smart beta factor indices take big over-and underweights in mega caps that can make or break their performance. As a result, one can wonder if factor risk is still the main driver of their performance, or if they mostly expose investors to idiosyncratic risk nowadays. By contrast, we argue that the performance of diversified factor strategies with tracking error management is largely unaffected by increased index concentration. We conclude that although no active strategy is completely immune to the effects of increased index concentration, the effects can be largely mitigated with proper risk control. This is vital to prevent active management from degenerating into a binary bet on the fortunes of a few magnificent tech stocks.
As always, we present several interesting figures and tables:
Notable quotations from the academic research paper:
“Over the past decade, the stock market has undergone a dramatic transformation, with an increasing concentration of market value in a small number of giants related directly or indirectly to the technology sector. These stocks were first popularly referred to as FAANG, an acronym for Facebook (now Meta), Apple, Amazon, Netflix, and Google (now Alphabet), or FANMAG, with Microsoft additionally included. With the replacement of Netflix by new rising stars Nvidia and Tesla this has morphed into the so-called Magnificent 7, while the most recent variation is BATMMAAN, which also includes Broadcom.
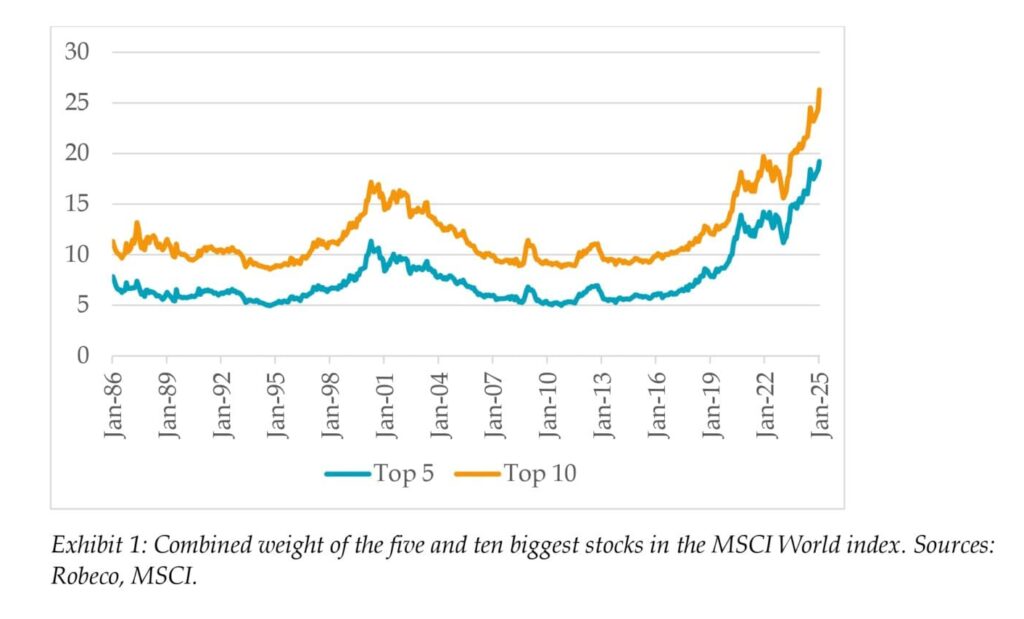
Exhibit 1 illustrates how the weight of the five biggest stocks in the MSCI World index has grown from around 6% a decade ago to around 20% nowadays. Similarly, the top ten has risen from less than 10% to over 25% today. This mega-cap dominance has reshaped the landscape of investing, creating both opportunities and risks. While the meteoric growth of tech giants has driven outsized returns and innovation, it has also heightened market vulnerability to the performance of just a handful of firms, raising questions about diversification, systemic risk, and the long-term implications for investors and economies alike. In this article we zoom in on the implications of increased index concentration for active investors.
Single factor ‘smart beta’ indices are generally able to take large overweight or underweight positions in individual stocks, such as doubling up on a stock that is already very big in the market index, or taking no position at all. To illustrate the implications of smart beta portfolio design choices we consider the MSCI World Quality, Momentum, and Minimum Volatility indices over the 7-year period from 2018 to 2024, during which growth stocks massively outperformed value stocks.
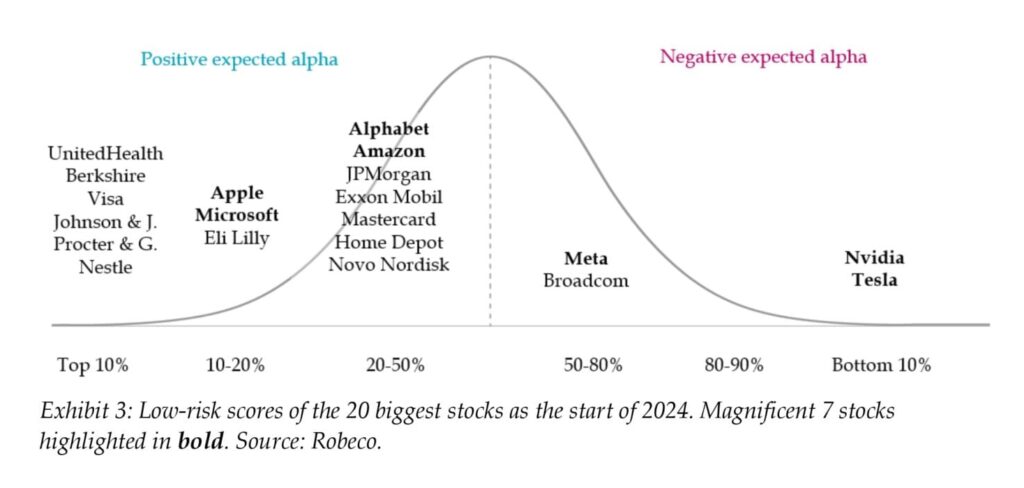
Exhibit 3 shows the low-risk score of the twenty biggest stocks at the beginning of 2024 (we use data from a year ago to avoid the benefit of hindsight). For this analysis we use a composite low-risk factor, which combines statistical metrics, such as past volatility and beta, with forward-looking distress risk indicators. Although none of the Magnificent 7 stocks are in the top decile, which contains a lot of stocks from the consumer staples and health care sectors, both Apple and Microsoft are in the second decile, meaning that they are actually less risky than over 80% of the stocks in the universe. Two other Magnificent 7 names, Alphabet and Amazon, have lower risk than the average stock and hence cannot be considered particularly high risk either. Only Tesla and Nvidia have dismal low-risk characteristics, ending all the way in the bottom decile.
Enhanced indexing portfolios can be dialed up to higher tracking error levels by increasing the total active share and the maximum active position size per stock. The efficiency loss due to increased index concentration remains small for these more active versions, but the extent to which active share can be stretched is affected. For instance, if we consider maximum active positions of 1.0% per stock and no limit on the total active share then the maximum active share drops from 80% in 2010 to only 68% in 2024, as shown in Exhibit 6. As a result of this decreased maximum activeness, the expected alpha drops from 1.97% to 1.69%, corresponding to a decay of 14%.”
Are you looking for more strategies to read about? Sign up for our newsletter or visit our Blog or Screener.
Do you want to learn more about Quantpedia Premium service? Check how Quantpedia works, our mission and Premium pricing offer.
Do you want to learn more about Quantpedia Pro service? Check its description, watch videos, review reporting capabilities and visit our pricing offer.
Are you looking for historical data or backtesting platforms? Check our list of Algo Trading Discounts.
Or follow us on:
Facebook Group, Facebook Page, Twitter, Linkedin, Medium or Youtube
Share onLinkedInTwitterFacebookRefer to a friend


