How to Deal With Missing Financial Data
The problem of missing financial data is widespread yet often overlooked. An interesting insight into the structure of missing financial data provides a novel research paper by authors Bryzgalova et al. (2022). Firstly, examining the dataset of the 45 most popular characteristics in asset pricing, the authors found that missing data is frequent among almost any characteristic and affects all kinds of firms – small, large, young, mature, profitable, or in financial distress. The requirement of multiple characteristics simultaneously makes the problem even worse. Moreover, the data is not missing randomly; missing values clusters both cross-sectionally and over time. This may lead to a selection bias, making most famous ad-hoc approaches like the median invalid. Last but not least, the returns depend on whether a firm has missing fundamentals. Stocks with a missing characteristic value have lower returns in comparison to their counterparts observing the same variable.
Considering the abovementioned findings, the authors proposed a novel imputation method by modeling characteristics in three-dimensional space (time, individual stocks, and type of characteristics). The main idea is based on estimating a low-dimensional cross-sectional factor model by Principal Component Analysis (PCA) for each month. In conclusion, they used the XS (cross-sectional) information with TS (time-series) information in characteristics to predict missing values, creating two baseline models: the backward-cross-sectional model (B-XS), using only past observed data and backward-forward-cross-sectional model (BF-XS), combining past and future information. According to the authors, the novel approach is simple, easy to use, and significantly outperforms existing alternatives.
Authors: Svetlana Bryzgalova, Sven Lerner, Martin Lettau and Markus Pelger
Title: Missing Financial Data
Link: https://papers.ssrn.com/sol3/papers.cfm?abstract_id=4106794
Abstract:
Missing data is a prevalent, yet often ignored, feature of company fundamentals. In this paper, we document the structure of missing financial data and show how to systematically deal with it. In a comprehensive empirical study we establish four key stylized facts. First, the issue of missing financial data is profound: it affects over 70% of firms that represent about half of the total market cap. Second, the problem becomes particularly severe when requiring multiple characteristics to be present. Third, firm fundamentals are not missing-at-random, invalidating traditional ad-hoc approaches to data imputation and sample selection. Fourth, stock returns themselves depend on missingness. We propose a novel imputation method to obtain a fully observed panel of firm fundamentals. It exploits both time-series and cross-sectional dependency of firm characteristics to impute their missing values, while allowing for general systematic patterns of missing data. Our approach provides a substantial improvement over the standard leading empirical procedures such as using cross-sectional averages or past observations. Our results have crucial implications for many areas of asset pricing.
As always we present several interesting figures:


Notable quotations from the academic research paper:
„Missing characteristic data has several potential effects for asset pricing. First, it reduces the number of stocks in portfolios that are constructed by sorts on characteristics. Second, the set of stocks in portfolios may vary by characteristic, which could make comparisons across factors difficult. Third, the performance of factor premia might be affected if firm fundamentals are not missing at random.
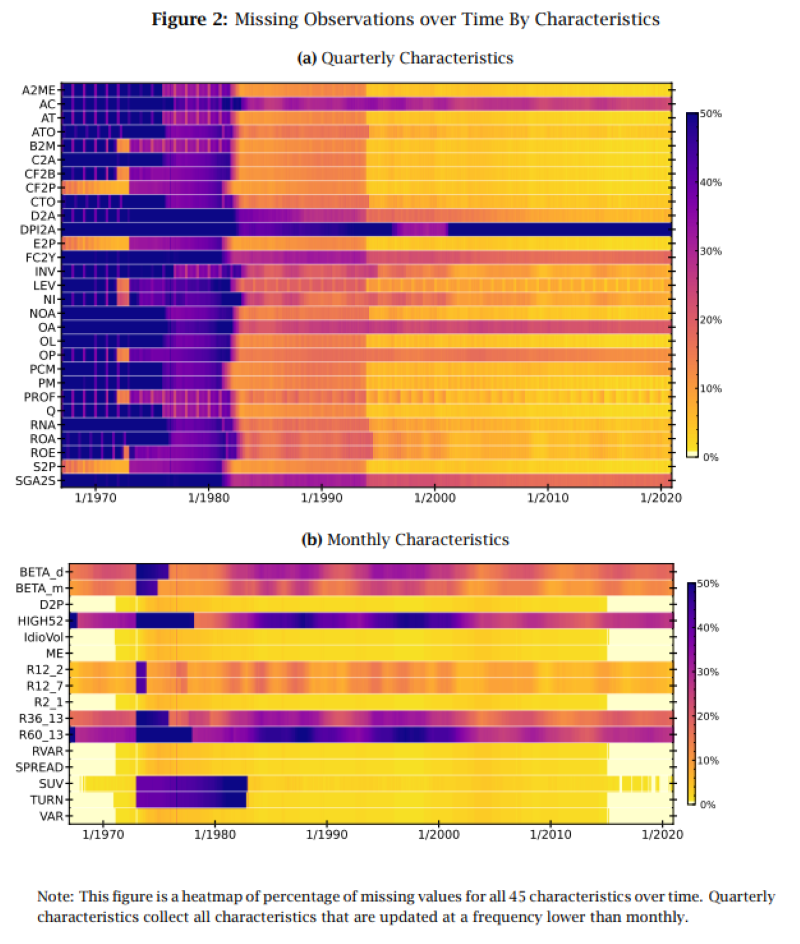
First, we find that the issue of missing data is profound in several dimensions. While the frequency of missing data is particularly severe until the early 1980s, missing data is still prevalent in more recent data. For example, through the 2000s, over 75% of all stocks, accounting for over half the market cap, have missing observations. Moreover, while the frequency of missing observations decreases with firm size, even the largest firms are affected. Second, the problem becomes particularly severe when requiring multiple present characteristics. Third, firm fundamentals are not missing-at-random, and have complicated dependency in both time series and cross-section; as a result, imputation based on simple cross-sectional averages or focusing on a fully balanced panel of observations, may lead to a significant bias in empirical findings. Fourth, stock returns depend on the extent of missing data.
Our paper also provides a novel approach to the imputation of missing firm fundamentals. A conceptual contribution of our method lies in the joint modeling of characteristics values in the three-dimensional space, reflecting time periods, individual firms, and the type of characteristics. Our approach leverages both the time-series and cross-sectional dependency in characteristics to impute the missing values, while accounting for patterns in missing data.
Figure 14 shows the average return of long-only portfolios that include or exclude particular characteristics. Just the sheer presence of many firm-specific fundamentals seems to have an impact on asset returns – in part, due to the selection of firms with certain characteristics into the observable set. Overall, stocks with an observable characteristic value seem to have a higher rate of return, compared to those, for which this variable is missing. For example, stocks for which we observe earnings-to-price ratios, have more than twice the annual returns of the firms missing this data.
Requiring more characteristics drastically reduces the number of stocks that are included in portfolios sorts. In the case of size, the number of small stocks (decile 10, based on NYSE breakpoints) drops from almost 50% of all the tradable companies to less than 10%, whenever all the characteristics are required to be observed. Restricting stocks to have contemporaneous observations for the book-to-market (B2M), investment (INV), and operating profitability (OP), removes 15% of the overall sample. These results are even more extreme for portfolios sorted by the book-to-market ratio (see Panel A in Figure 15). In this case the number of available stocks for the extreme growth and value deciles drops from above 10% to about 2% of the sample, whenever all the characteristics are required to be observed.
Naturally, the problem of missing data does not just apply to stock-specific characteristics, and is encountered universally in various applications in finance: I/B/E/S forecast data, ESG ratings of firms, and many others. Given the Big Data environment, and new sources of information being available with an increasing speed, we suspect that the issue of missing data will become even more paramount going forward.“
Are you looking for more strategies to read about? Sign up for our newsletter or visit our Blog or Screener.
Do you want to learn more about Quantpedia Premium service? Check how Quantpedia works, our mission and Premium pricing offer.
Do you want to learn more about Quantpedia Pro service? Check its description, watch videos, review reporting capabilities and visit our pricing offer.
Are you looking for historical data or backtesting platforms? Check our list of Algo Trading Discounts.
Would you like free access to our services? Then, open an account with Lightspeed and enjoy one year of Quantpedia Premium at no cost.
Or follow us on:
Facebook Group, Facebook Page, Twitter, Linkedin, Medium or Youtube
Share onLinkedInTwitterFacebookRefer to a friend


