How to Identify Ponzi Funds?
Can we spot a Ponzi scheme before it collapses? That question haunts regulators, investors, and journalists alike. But what if some modern investment funds operate on dynamics that, while not technically illegal, closely resemble Ponzi-like behavior? A new paper by Philippe van der Beck, Jean-Philippe Bouchaud, and Dario Villamaina examines whether certain actively managed funds inflate their own performance — and in doing so, unwittingly mislead investors chasing past returns.
The study reveals a striking phenomenon: many funds generate part of their returns through “price pressure” — buying into the same illiquid stocks they already hold, which drives up prices and boosts portfolio performance. Investors, unable to distinguish between genuine skill and self-inflated returns, pour more money into these funds. That money gets reinvested in the same stocks, pushing prices even higher. The authors call this feedback loop “Ponzi-like” — not because it’s fraudulent, but because it mimics the wealth redistribution seen in actual Ponzi schemes: new investors effectively reward early ones through rising prices that later collapse when flows dry up or markets correct.
The implications are sobering. The paper finds that for the most illiquid ETFs, as much as 10% of daily flows are driven by these self-inflated returns — translating to an estimated $500 million in daily wealth reallocation across U.S. ETFs alone. Worse, funds with the highest levels of this behavior are often those that suffer the steepest future drawdowns. To help mitigate the risk, the authors propose a simple metric — “fund illiquidity” — that captures a fund’s potential to generate self-inflated returns. In a time of booming thematic and niche ETFs, it’s a timely warning: not all performance is created equal, and some success stories may be built on sand.
Authors: Philippe van der Beck, Jean-Philippe Bouchaud, Dario Villamaina
Title: Ponzi Funds
Link: https://arxiv.org/abs/2405.12768
Abstract:
Many active funds hold concentrated portfolios. Flow-driven trading in these securities causes price pressure, which pushes up the funds’ existing positions resulting in realized returns. We decompose fund returns into a price pressure (self-inflated) and a fundamental component and show that when allocating capital across funds, investors are unable to identify whether realized returns are self-inflated or fundamental. Because investors chase self-inflated fund returns at a high frequency, even short-lived impact meaningfully affects fund flows at longer time scales. The combination of price impact and return chasing causes an endogenous feedback loop and a reallocation of wealth to early fund investors, which unravels once the price pressure reverts. We find that flows chasing self-inflated returns predict bubbles in ETFs and their subsequent crashes, and lead to a daily wealth reallocation of 500 Million from ETFs alone. We provide a simple regulatory reporting measure — fund illiquidity — which captures a fund’s potential for self-inflated returns.
As always, we present several interesting figures and tables:
Notable quotations from the academic research paper:
“[…] emphasize that the title of this paper does not suggest that concentrated investment funds are literal Ponzi schemes as defined by the SEC: “A Ponzi scheme is an investment fraud that involves the payment of purported returns to existing investors from funds contributed by new investors.”4 Instead, the term ‘Ponzi funds’ merely conveys the notion of self-inflated returns. The reallocation of capital happens indirectly via observable market prices instead of direct capital transfers as in true Ponzi schemes. The SEC also states that “Ponzi schemes inevitably collapse, most often when it becomes difficult to recruit new investors or when a large number of investors ask for their funds to be returned.” This is closer to our proposed mechanism, as the wealth reallocation from self-inflated returns unravels once the price impact in the underlying securities reverts and investors stop misinterpreting self-inflated returns as managerial skill.
Last, we combine the self-inflated returns with return chasing to quantify the economic importance endogenous price spirals caused by impact chasing: Funds with concentrated portfolios in illiquid basket securities have a high potential impact on the underlying. Flows into these funds pushes up the price of the underlying, leading to high realized fund returns. Following this price impact return, investors allocate more flows to these funds, which we label ‘Ponzi flows’. The economic magnitude of Ponzi flows and their price impact are meaningful. Around 2% of all daily flows and 8-12% of flows in the top decile of illiquid funds can be attributed to Ponzi flows. We estimate that every day around $500 Million of investor wealth is reallocated because of the price impact of Ponzi flows. We furthermore find that funds with high Ponzi flows experience subsequent drawdowns of over 200%.
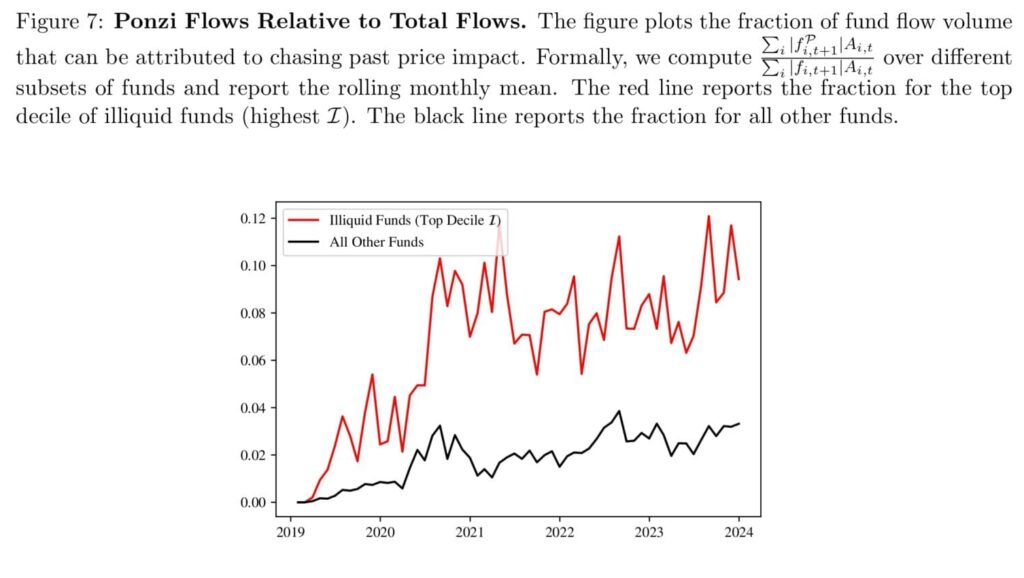
Figure 7 plots the relative Ponzi volume over time.
Among the most illiquid funds (top decile ℐ), around 10% of the daily flow volume can be attributed to Ponzi flows, i.e. flows chasing past price impact. Among all other funds, Ponzi flows are still sizeable and account for 2-3% of total flow volume.
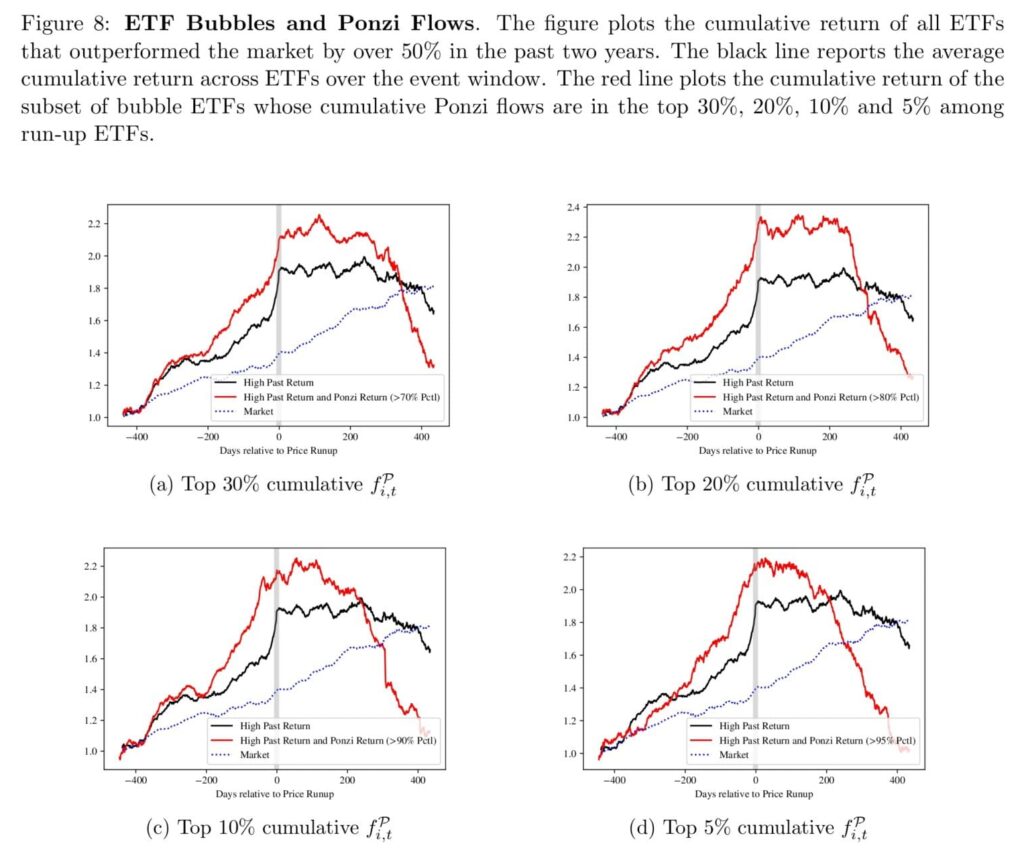
Figure 8(d) plots the cumulative returns over the event window for the run-up ETFs and the bubble ETFs.
The black line reports the average cumulative return over the event window across all run-up ETFs. As in Greenwood et al. (2019), excessive outperformance is on average not followed by a subsequent crash. Cumulative returns rather converge back to the market return. The red line splits the sample of run-up ETFs into the funds that received the highest cumulative Ponzi flows fi,t𝒫 during the period. On average, these bubble funds experienced steep crashes, with cumulative returns exceeding -200% in the two years following the runup. However, as in Greenwood et al. (2019), timing the crash is difficult. On average, bubble ETFs do not crash within the first year of the run-up.”
Are you looking for more strategies to read about? Sign up for our newsletter or visit our Blog or Screener.
Do you want to learn more about Quantpedia Premium service? Check how Quantpedia works, our mission and Premium pricing offer.
Do you want to learn more about Quantpedia Pro service? Check its description, watch videos, review reporting capabilities and visit our pricing offer.
Are you looking for historical data or backtesting platforms? Check our list of Algo Trading Discounts.
Or follow us on:
Facebook Group, Facebook Page, Twitter, Linkedin, Medium or Youtube
Share onLinkedInTwitterFacebookRefer to a friend


