Impact of Dataset Selection on the Performance of Trading Strategies
Introduction
We have previously mentioned that not all models (such as CAPM) that work well for developed markets (DM, such as the U.S. and Europe) are suited to be applicable in other world parts. The following article is a short analysis that shows that investing in Emerging Markets (EM) has its peculiarities. Especially investing in Chinese equities can sometimes be complicated with its mix of mainland exchanges, Hong Kong exchange, and/or Chinese ADRs listed abroad. While all of these investment possibilities can seem the same at first glance – they are all “Chinese stocks” to an external observer, the truth is that stocks on each exchange behave differently and are sensitive to different risk factors. Therefore it’s important to understand how the performance of equity factor investing strategy can be dependent upon the selection of the dataset on which we backtest it.
Approach, Methods, and Data
We have been provided data by Datayes. Datayes is a leading fintech company that helps the investment community to find out potential investment opportunities in China using financial big data. Datayes has a wealth of data regarding China A shares, including comprehensive fundamental databases featuring point-in-time financial data and its exclusive alternative data sets. The company processes these massive data and mines valuable investment information from fragmented data by cognitive algorithms. It is also an industry-leading technology provider in terms of in-depth data analysis in China Mainland and recognized by large numbers of professional asset management institutions globally in the use of in-depth data for quantitative investment (feel free to contact Datayes for any data inquiry).
Specifically, for purposes of our work, we have been given various information about 500 large-cap Chinese companies listed on their A-market within the 7 years period span. All data used are point-in-time to ensure the accuracy of backtesting.
First Trading Strategy
As previously mentioned, we would like to show that and demonstrate that there is a crucial difference in the selection of the dataset that’s used to backtest the trading strategy. Let’s for beginning start to recapitulate our strategy a bit.
The relatively young Chinese stock market provides ambitious investors and asset managers with a wide range of opportunities to deploy varieties of ideas in a manner unusual for already-established Western markets. China has the second largest stock market in the world, and unlike the U.S., it is dominated mainly by retail investors. Since retail investors generally make suboptimal investment decisions, the Chinese stock market offers great arbitraging opportunities to sophisticated investors. Among the documented market anomalies, the stock price reversal, in particular, appears to be strong in China and cannot be explained by the Chinese three-factor model of Liu, Stambaugh, and Yuan (2019). Given the robust profitability of the reversal strategy and its vast popularity among quantitative investors in China, a novel paper by Liu, Qiu, Shen, and Zheng (2022) examines the returns to the standard long-short reversal portfolio conditional on arbitrage intensity. To capture the arbitrage intensity, the authors construct a variable called coreversal (CoREV) that measures the degree of abnormal return correlation among stocks on which arbitrageurs speculate.
Strategy is built as follows: At the end of each month, investors sort the available stocks into decile portfolios based on their past twelve months’ cumulative returns and form a value-weighted reversal strategy that buys stocks in the bottom decile (past losers) and sells stocks in the top decile (past winners). CoREV is calculated exactly as from Equations (1) and (2). And based on the results, if the calculated variable is within its top quintile, investors buy the standard long-short reversal portfolio over the next year; otherwise, they hold cash. They hold stocks for one year, and the one-twelfth portion of the portfolio is rebalanced monthly.
First Backtest
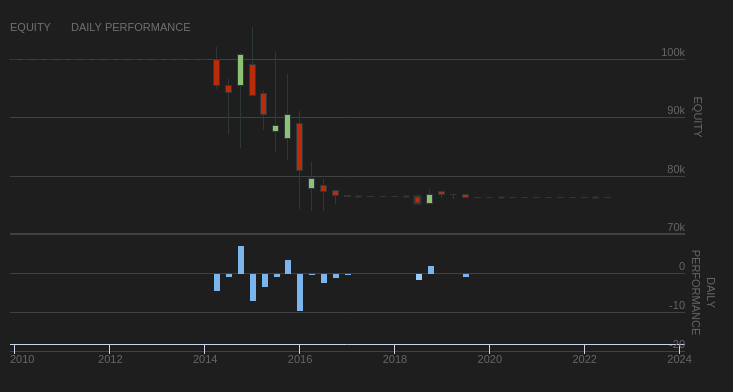
What does the performance of this strategy look like? Our backtest has shown that the strategy is not profitable when it’s being performed on Chinese ADRs (American Depositary Receipts) listed in U.S. markets (like NYSE). These are results from backtesting in QuantConnect, followed by a summary of results from our Portfolio Manager (which is available for our Quantpedia Pro clients):

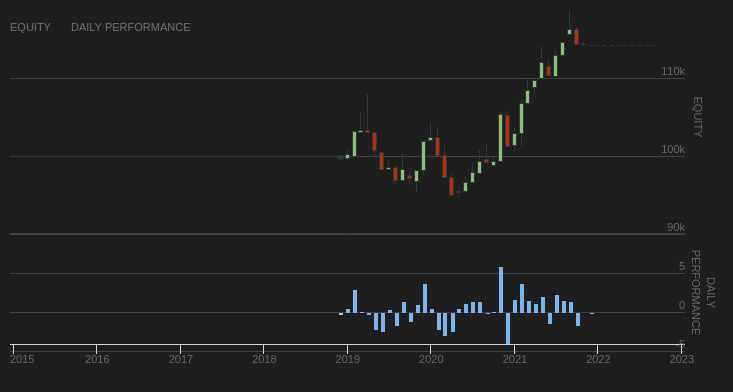
On the other hand, there was a significant difference in performance when we tested the strategy on the local Chinese A-shares, the same dataset on which the authors of the paper performed their tests. Our backtest uses a 12-month parameter for the holding period, 12-m CoREV variable parameter, and 24 months quintile selection, which gives us a 3-year out-of-sample strategy’s performance curve, which is more than enough for comparison against the strategy’s version using ADRs. Overall, the strategy performs satisfying which can be seen from the following figure:

Second Trading Strategy
The second strategy successfully builds on recurring notions of momentum and reversal, which are even more specific in Chinese markets, and exploits them to gain steady profits with an acceptable range of volatility. For example, Du, Jun and Huang, Dashan and Liu, Yu-Jane and Shi, Yushui and Subrahmanyam, Avanidhar and Zhang, Huacheng in their Retail Investors and Momentum (July 15, 2022) found that participation of retail investors may be low in high-priced stocks because of a strictly-enforced round-lot (100-share minimum) rule; hence short-term reversals are strongest in the lowest-priced stocks and weakest in highest-priced stocks, a pattern that is opposite to that for momentum (strongest in the highest-priced stocks and weakest in lowest-priced stocks). Overall, the results paint a picture that institutions contribute to momentum, and reversals induced by retail investors attenuate momentum.
Once again, we would like to test, what’s the difference if we backtest the strategy using ADRs and Chinese A-shares. Some of the methodologies suggest removing the bottom 30% of the investment universe in the emerging markets (and China) to remove potentially biased micro-cap data. The tested strategy, therefore, focuses on the momentum factor – based on the Du, Huang, Liu, Shi, Subrahmanyam, and Zhang paper, we independently sort stocks into decile groups based on nominal prices and quintile groups based on cumulative returns over the past 12 months and then build a portfolio by buying winners from top priced decile and selling losers from the top-priced decile.
Second Backtest
Our investment universe consists of the largest 400 stocks by market cap, tested on local A-shares markets. And as we can see, the strategy works nicely.
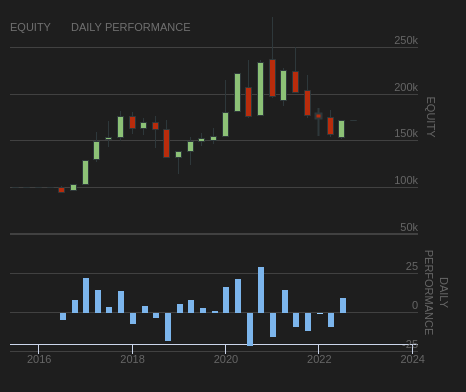

Backtest on data sample from July 2016 shows satisfying profits of 8.46 % annually, which with wise selection of total allocation in the portfolio, can provide interesting market-neutral exposure to the Chinese market.
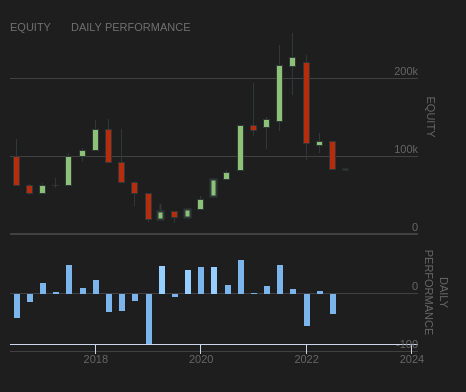
And how does the result look when we use the same momentum trading rules but this time apply them to ADRs (American Depositary Receipts) in the United States? Here can be seen that the strategy is not performing well; volatility is significant, and drawdown can, in some instances, bring margin requirements into question.

Conclusion and Discussion
It would be great if the investment factors and trading strategies worked all around the world without change and under all circumstances. But, unfortunately, it doesn’t work like that. Some of the strategies are market-specific, as shown in this short analysis. The Chinese market has its own specifics, mainly higher representation of retail investors and lower efficiency. And it’s not alone; countless strategies work just in cryptocurrencies, selected futures, or some other derivatives markets. So, what’s the takeaway? Simple, it’s really important to understand that each anomaly is linked to the underlying dataset and market structure, and we need to account for it in our backtesting process.
Are you looking for more strategies to read about? Sign up for our newsletter or visit our Blog or Screener.
Do you want to learn more about Quantpedia Premium service? Check how Quantpedia works, our mission and Premium pricing offer.
Do you want to learn more about Quantpedia Pro service? Check its description, watch videos, review reporting capabilities and visit our pricing offer.
Do you want algorithmic access to the full Quantpedia database via the API? Subscribe to Quantpedia Pro, ask for an API key, and explore the in/out-of-sample statistics, source academic papers, and code snippets — ideal for quantitative research, systematic trading workflows, and AI model training.
Are you looking for historical data or backtesting platforms? Check our list of Algo Trading Discounts.
Or follow us on:
Facebook Group, Facebook Page, Twitter, Linkedin, Medium or Youtube
Share onLinkedInTwitterFacebookRefer to a friend


